11email: joanna@astro.ex.ac.uk 22institutetext: Department of Physics and Astronomy, The University of Georgia, Athens, GA USA 30602-2451 33institutetext: School of Earth and Space Exploration, Arizona State University, Tempe, AZ USA 85281 44institutetext: Department of Physics and Astronomy, Caltech, MC 249-17, Pasadena, CA 91125, USA 55institutetext: The Department of Astronomy and Steward Observatory, The University of Arizona, Tucson, AZ USA 85721
Sub-millimeter observations of IRAS and WISE debris disk candidates††thanks: Herschel is an ESA space observatory with science instruments provided by European-led Principal Investigator consortia and with important participation from NASA
A set of six debris disk candidates identified with IRAS or WISE excesses were observed at either 350 m or 450 m with the Caltech Submillimeter Observatory. Five of the targets – HIP 51658, HIP 68160, HIP 73512, HIP 76375, and HIP 112460 – have among the largest measured excess emission from cold dust from IRAS in the 25-100 m bands. Single temperature blackbody fits to the excess dust emission of these sources predict 350-450 m fluxes above 240 mJy. The final target – HIP 73165 – exhibits weak excess emission above the stellar photosphere from WISE measurements at 22 m, indicative of a population of warm circumstellar dust. None of the six targets were detected, with 3 upper limits ranging from 51-239 mJy. These limits are significantly below the expected fluxes from SED fitting. Two potential causes of the null detections were explored – companion stars and contamination. To investigate the possible influence of companion stars, imaging data were analyzed from new adaptive optics data from the ARIES instrument on the 6.5m MMT and archival HST, Gemini NIRI, and POSS/2MASS data. The images are sensitive to all stellar companions beyond a radius of 1-94 AU, with the inner limit depending on the distance and brightness of each target. One target is identified as a binary system, but with a separation too large to impact the disk. While the gravitational effects of a companion do not appear to provide an explanation for the submm upper limits, the majority of the IRAS excess targets show evidence for contaminating sources, based on investigation of higher resolution WISE and archival Spitzer and Herschel images. Finally, the exploratory submm measurements of the WISE excess source suggest that the hot dust present around these targets is not matched by a comparable population of colder, outer dust. More extensive and more sensitive Herschel observations of WISE excess sources will build upon this initial example to further define the characteristics of warm debris disks sources.
Key Words.:
submillimeter: planetary systems, stars: circumstellar material, stars: imaging, techniques: high angular resolution| Name | RA | Dec | Prop. mot. | D | SpTy | Age | Excess | Tdust | Ldust / L⋆ | Ref. |
|---|---|---|---|---|---|---|---|---|---|---|
| (J2000) | (J2000) | (″/yr) | (pc) | (Myr) | source | (K) | ||||
| HIP 51658 | 10:33:13.88 | +40:25:31.65 | -0.142, 0.008 | 34.6 0.6 | A7 | 200 | IRAS | 40 | 1.06 10-4 | 1 |
| HIP 68160 | 13:57:16.13 | +23:21:44.37 | -0.330, -0.158 | 38 1 | K0 | 230 | IRAS | 1.49 10-3 | 2 | |
| HIP 73165 | 14:57:11.01 | -04:20:47.32 | -0.097, -0.153 | 26.9 0.2 | F0 | WISE | ||||
| HIP 73512 | 15:01:29.96 | +15:52:08.45 | 0.102, -0.238 | 30 1 | K2 | 3000? | IRAS | 85 | 1.17 10-3 | 1 |
| HIP 76375a | 15:35:56.61 | +40:25:31.65 | -0.448, 0.051 | 22 0.3 | K3 | 5000? | IRAS | 29 | 7.86 10-4 | 1 |
| HIP 112460 | 22:46:49.81 | +44:20:03.10 | -0.705, -0.461 | 5.12 0.05 | M3.5 | 500 | IRAS | 19 | 3 |
1 Introduction
Debris disks were first identified with the Infrared Astronomical Satellite (IRAS), from the observation that the far-IR flux of Vega (Aumann et al., 1984) was significantly brighter than expected from the stellar photosphere. Excess emission above the level of a stellar photosphere at wavelengths from the mid-IR to the millimeter provides evidence of reprocessed starlight emitted by a circumstellar debris disk of dust (c.f. reviews by Zuckerman, 2001; Wyatt, 2008). The disk origin of these excesses has been confirmed with spatially resolved imaging (e.g. Smith & Terrile, 1984; Holland et al., 1998). Given the timescale for the dust to spiral into the star or be ejected from the system, these dust disks must be sustained by an ongoing process such as the collisional grinding of planetesimals into smaller particles (Backman & Paresce, 1993) or an event such as a catastrophic collision of planets (Cameron, 1997).
While IRAS provided an all-sky survey for debris disks with a typical sensitivity of (Ldust / L⋆) 10-5, subsequent pointed observations from the Spitzer Space Telescope (Werner et al. 2004), achieved an order of magnitude greater sensitivity. The combined results of the all-sky and pointed observations have identified over 200 debris disks among field stars (e.g. Mannings & Barlow, 1998; Moór et al., 2006; Rhee et al., 2007; Habing et al., 1999; Silverstone, 2000; Rieke et al., 2005; Su et al., 2006; Bryden et al., 2006; Beichman et al., 2006; Hillenbrand et al., 2008; Carpenter et al., 2009). Assuming a single temperature blackbody model for the excess emission in the spectral energy distribution, it is possible to classify debris disks as warm (equivalent to that of our Asteroid belt), with Tdust 100-250 K, that lie at distances 10 AU, and cold debris disks (equivalent to that of our Kuiper belt), with Tdust 50 K, typical distances of several hundred AU.
With the more recent Herschel and Wide-field Infrared Survey Explorer (WISE) missions, it is possible to conduct pointed searches for cold debris disks down to the Kuiper belt level (Ldust / L⋆) 10-7 to 10-6 (Stern, 1996) and all-sky surveys for warm debris disks at a sensitivity level that was previously only obtained with Spitzer pointed observations. In addition to the sensitivity offered by both Herschel and WISE, the significant improvement of spatial resolution is important to identify possible sources of contamination. Examples of debris disks identified through IRAS excesses (e.g. Moór et al., 2006; Rhee et al., 2007) that are actually due to confusion from background source contamination have been revealed by higher resolution ground-based observations carried out in the IR and submm (e.g. Song et al., 2002; Jayawardhana et al., 2002; Lisse et al., 2002; Sheret et al., 2004).
Mid-IR to far-IR observations have been critical in identifying the current population of debris disks, however measurements at longer wavelengths in the submm/mm wavelength range provide the best means to estimate one of the most important properties of a disk, the dust mass. For disks that are spatially resolved in the submm, it is also possible to determine additional disk characteristics such as size and inclination which are degenerate with other disk parameters in an SED fit. For disks that have imaged asymmetries, these structures can encode the effects of gravitational interactions (e.g. Liou & Zook, 1999; Kuchner & Holman, 2003; Wyatt, 2006; Quillen & Faber, 2006). The submm/mm wavelength range is ideal for studying the interaction of the disk and planets, i.e. in the case of the multiple planet, debris disk system around HR 8799 (e.g. Patience et al., 2011; Hughes et al., 2011), since the large grains are expected to remain in resonances with the planets, while the smaller grains evolve into axisymmetric structures due to scattering or radiation pressure (Wyatt, 2006).
In this paper, we present the results of a submm and IR imaging study of several IRAS excess stars and one WISE excess star. This sample includes previously known systems with cold dust (Moór et al., 2006; Rhee et al., 2007) and newly identified debris disk candidates with evidence of either cold or warm dust. The properties of the sample are summarized in Section 2. The single-dish submm observations, infrared imaging and archival searches are described in Section 3. In Section 4, the data reduction and analysis of our submm and IR observations is presented. The results and implications of the IR image analysis is given in Section 5. In Section 6, we draw comparisons of our investigation to previous submm studies of debris disks. Finally, the conclusions of our study are given Section 7.
| Name | UT Date | (m) | Exp. Time | 225GHz range | Secondary Calibrators | Flux Calibrators |
|---|---|---|---|---|---|---|
| HIP 51658 | 2012 02 16 | 450 | 610 min | 0.04-0.06 | 3C273, OH231.8, OJ287 | CRL618, OH231.8 |
| HIP 68160 | 2012 02 16 | 450 | 510 min | 0.03-0.06 | 3C273, OJ287 | CRL618, OH231.8 |
| HIP 73165 | 2012 06 10 | 350 | 510 min | 0.06-0.07 | Arp220 | Neptune, Uranus |
| HIP 73512 | 2012 06 10 | 450 | 610 min | 0.06-0.07 | Arp220 | Arp220, Mars |
| HIP 76375 | 2012 06 10 | 350 | 85 min | 0.05-0.06 | Arp220 | Neptune, Uranus |
| HIP 112460 | 2012 06 13 | 350 | 810 min | 0.06-0.07 | Arp220 | Neptune, Uranus |
2 The sample
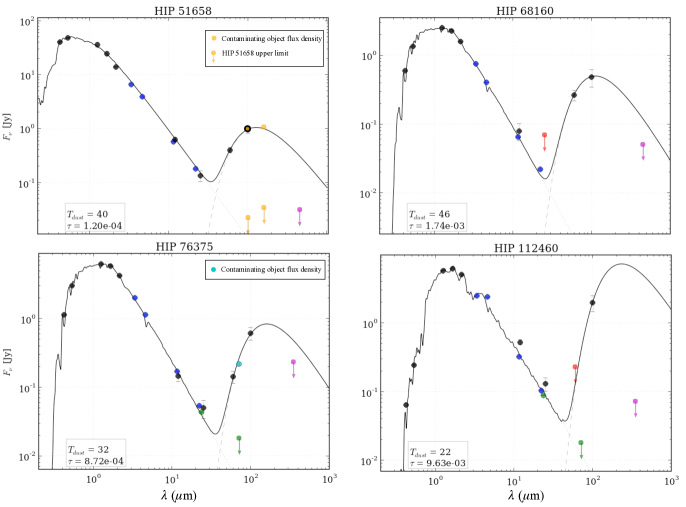
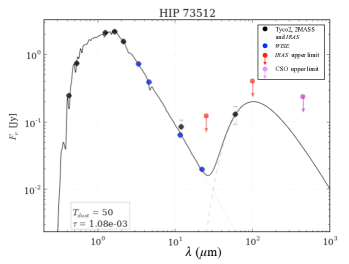
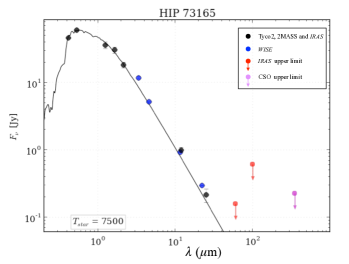
The target sample for this investigation of cold and warm excess debris disks is drawn from two main sources – the IRAS Faint Source Catalog (FSC v.2) (Moshir et al., 1992) and results from the WISE All-Sky Data Release (Cutri & et al., 2012). We selected a sample of cold excess disk candidates from the literature (Lestrade et al., 2006; Moór et al., 2006; Rhee et al., 2007) that satisfy three criteria: (1) a large IRAS excesses at 60 m or 100 m, (2) a distance within 100 pc, and (3) a declination above -30. Spectral energy distributions (SEDs) were constructed, and a single temperature blackbody model was fit to the IRAS excesses. Targets with an expected 350 m flux greater than 100 mJy were considered for this study, and the SEDs of the targets are shown in Figures 1 and 2. Due to weather considerations, we focused our observations on sources with the greatest predicted 350 m flux and and with nearby distances (40 pc), in order to obtain meaningful limits and have the capacity to resolve the disks of the nearest systems. A total of 5 cold debris disks candidates were observed in this study, and are listed in Table 1, along with a summary of the modelled dust properties from the literature. The second type of target with evidence for warmer dust was drawn from the WISE (3.4 m, 4.6 m, 12 m, and 22 m) All-Sky Data Release. The identification of a WISE W3 (12 m) and/or W4 (22 m) band excess was based on a careful cross-correlation of the WISE and Hipparcos catalogues (Perryman & ESA, 1997; van Leeuwen, 2007) with a distance cut of 100 pc and an estimate of the photospheric flux from theoretical atmosphere models (Hauschildt et al., 1999). Due to the limited clear weather windows during the observing runs, it was only possible to observe one warm excess source – HIP 73615. HIP 73615 has an excess only in the WISE W4 band, and the excess above the photosphere is 34 times the uncertainty in the photometry. The properties of the target are listed in Table 1, and the SED for this warm debris disk candidate is plotted in Figure 3.
3 Observations
3.1 Submm Observations
Observations of the six sources were made with the SHARCII bolometer array (Dowell et al., 2003) on the 10.4m Caltech Sub-millimeter Observatory (CSO) on Mauna Kea. SHARCII contains a 12 32 array of pop-up bolometers with a 90 % filling factor over the field and provides background-limited 350 m and 450 m maps. For the closest systems, we obtained 350 m maps to potentially resolve the disks. For the remaining targets we measured 450 m maps to measure longer wavelength fluxes distinct from the Herschel bands. Table 2 which wavelengths were observed for each source and the exposure times. The field-of-view of the SHARCII maps was 2′ 0′.6, and the beam sizes at 350 m and 450 m are 85 and 100, respectively. The beam shape was stabilized by the active primary surface correction (Leong et al., 2006), which corrects for dish surface imperfections and changes in the gravity vector as a function of elevation.
The data were acquired during two observing runs: February 14-22 2012 and June 6-14 2012. There were no significant changes to the instrument over the course of the project. The conditions during the observations ranged from excellent 225GHz = 0.03 to marginal 225GHz = 0.07.The observing sequence consisted of a series of target scans bracketed by scans of planets and nearby secondary calibrators, serving as both absolute flux calibration and pointing calibration measurements. Table 2 lists the calibrators observed for each science target. Pointing calibration measurements were taken at least once per hour during the observing period and focus corrections were monitored throughout the night. Typical individual target scan times were 620s, while 120s was sufficient for the calibrators. A total of 1 to 11 scans were taken on the science targets.
| This Work | Archival Data | |||||||
| Name | UT Date | Filter | Instrument/ | Exp. Time | UT Date | Filter | Instrument/ | Exp. Time |
| Telescope | (s) | Telescope | (s) | |||||
| HIP 51658 | 2012 12 23 | Ks | ARIES/MMT | 600 | 2010 02 04 | Kp | AOBIR/CFHT | 440 |
| HIP 68160 | 2012 12 23 | Ks | ARIES/MMT | 620 | 2008 03 21 | F606W | WFPC2/HST | 500 |
| HIP 73165 | - | - | - | - | 2005 08 15 | F160W | NICMOS/HST | 1663 |
| HIP 73512 | 2012 12 23 | Ks | ARIES/MMT | 450 | 2008 03 09 | F160W | NICMOS/HST | 1120 |
| HIP 76375 | - | - | - | - | 2008 03 13 | F160W | NICMOS/HST | 1120 |
| HIP 112460 | - | - | - | - | 2002 07 24 | FeII | AOBIR/CFHT | 64 |
3.2 Imaging Observations
High angular resolution observations were used to search for the presence of a stellar binary companion to each member of the sample, since a companion can impact the stability of debris disk material. Dedicated observations were obtained for four targets with the Arizona Infrared Imager and Echelle Spectrograph (ARIES; McCarthy et al., 1998) at the 6.5m AO-equipped MMT on December 23 2012. The observing strategy was the same for each target, with a series of short unsaturated exposures taken first to calibrate the photometry of the observing sequence, followed by deep exposures in which the core of the PSF of the target was saturated, increasing the sensitivity to faint stellar companions. For both sets of exposures, images were obtained at a series of offset positions to measure the sky background and mitigate the effects of bad pixels. Additionally, the CFHT and HST archives were searched for previous high angular resolution observations of each sample member. Collectively, the new and archival observations include all the targets. Details of the high angular resolution observations of the sample are given in Table 3.
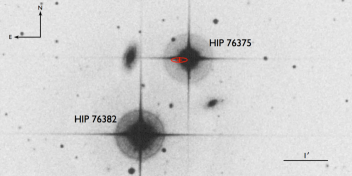
To increase the range of separations at which a stellar binary companion can be detected to a limit of 10,000 AU, digitized photographic plates were obtained from the SuperCosmos Sky Survey Science Archive (Hambly et al., 2001) for each target within the sample. For the targets within 30 pc, several of the 15′ 15′digitized plates were combined to ensure the angular coverage was sufficient to detect co-moving companions with separations up to the 10,000 AU outer boundary considered for this study. The large time baseline between the first and last photographic observation, combined with the high proper motion of the sample members, allowed for an identification of wide common proper motion (CPM) companions. An example of one of the wide-field images is shown in Figure 4.
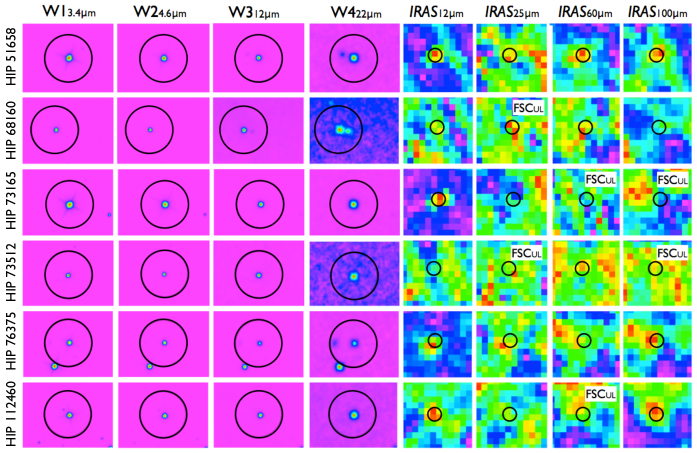
3.3 Archival mid-IR/far-IR images
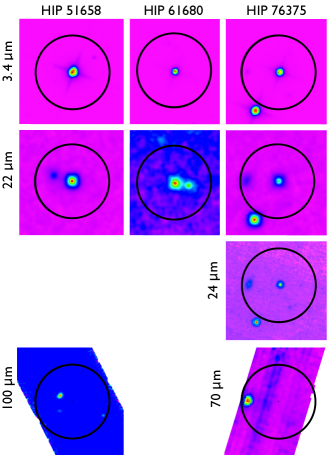
For each target, images from the all-sky surveys of IRAS and WISE were obtained for this program. Figure 5 shows the region centered on each target for each of the four bands of WISE (left) and four bands of IRAS (right). Overplotted on each image is the approximate size of the 100 m IRAS beam; the beam is estimated as circular using the average of the elliptical major and minor axis as the radius. We searched the Spitzer Heritage Archive and the Herschel Science Archive for higher resolution, pointed far-IR observations for each target, and three of the targets have additional higher resolution data. Level 2 MIPS data at 24 m and 70 m were retrieved for HIP 76375 and HIP 112460, and level 2.5 PACS data at 100 and 160 m was retrieved for HIP 51658. The pointed observations with Spitzer and Herschel are shown in Figure 6.
4 Data Analysis
4.1 Submm maps and fluxes
The analysis of the CSO 350 m and 450 m data included four main steps: application of a pointing model222http://www.submm.caltech.edu/sharc/analysis/pmodel, reduction of the raw data with the CRUSH pipeline (Kovács, 2006, 2008), measurement of aperture photometry, and calibration of fluxes. As an initial step, the pointing drifts of the telescope were estimated for each observation with a pointing model that accounts for both static effects, measured with many pointing sources at different positions throughout the run, and for time variable effects, measured with pointing sources observed before and after the science target. These offsets and the contemporaneous measurement of the atmospheric opacity are then incorporated into the data processing, implemented with the CRUSH (version 2.11-2) software (Kovács, 2006, 2008). The output of CRUSH includes an intensity map and signal-to-noise ratio map. The image processing algorithm is optimized depending on source brightness. We utilized the data reduction settings appropriate to the flux levels for the planets, pointing sources and science targets. Circular apertures with a radius of 95 at 350 m and 106 at 450 m were used for the target photometry; the aperture sizes are based on the measured FWHM of the point source calibrator at each wavelength.
Absolute fluxes of the planets are based on the distance from the Earth and the Sun, calculated at the time of observation and determined using the planetary brightness temperatures measured by Griffin & Orton (1993). The planets Mars, Neptune and Uranus were used for primary flux calibration and have absolute calibration uncertainties of 5-10% (Griffin & Orton, 1993). For nights without a planet observation, the calibration is tied to the secondary calibrators Arp 220, CRL 618 and OH231.8. For observations at 350 m, we use a flux density of 23.3 4.2 Jy for CRL 618 (derived by C. D. Dowell and listed on the SHARCII website333http://www.submm.caltech.edu/sharc/). The uncertainty is based on the long term variability of evolved stars (Sandell, 2003; Jenness et al., 2002). At 450 m, we use a flux density of 6.3 0.8 mJy for Arp220 (Dunne & Eales, 2001), 12.1 2.2 mJy for CLR 618 and 12.7 2.2 mJy for OH231.8 (Jenness et al., 2002). The uncertainty of the flux calibration is combined with the uncertainty of the source signal which is measured from the CRUSH source maps. The total uncertainty on the submm fluxes of the science targets ranges from 15-30%.
None of the six targets were detected in the CSO 350 m or 450 m maps. We have therefore pursued two types of analysis in order to investigate the causes for these null detections, presented in Section 5. With infrared imaging, we investigate the possible disruptive effects caused by companion stars and with an analysis of available mid-IR to far-IR maps, we explore the possibility of source contamination in the IRAS catalogue resulting in a misidentification of the target as a debris disk system.
| Target | Map noise rms | Flux limita | Dust mass limitb | |
|---|---|---|---|---|
| (m) | (mJy/beam) | (mJy) | (M⊕) | |
| HIP 51658 | 450 | 8 | 31 | 0.046 |
| HIP 68160 | 450 | 13 | 51 | 0.089 |
| HIP 73165 | 350 | 66 | 227 | 0.094 |
| HIP 73512 | 450 | 66 | 239 | 0.262 |
| HIP 76375 | 350 | 68 | 234 | 0.065 |
| HIP 112460 | 350 | 22 | 73 | 0.001 |
$b$$b$footnotetext: Calculated assuming an average dust temperature of 30 K.
4.2 High resolution and wide-field, near-IR/optical companion search images
For the ground-based AO images from the MMT and CFHT, we performed standard image processing steps to account for sky background and detector dark current, nonlinearity, bad pixels, and quantum efficiency variations. The individual science images were aligned, and median combined. For the HST archive data, the images were already reduced and flux calibrated, so no additional processing was required. Each final target image was searched for stellar companions, and detection limits were calculated as a function of separation. For each target, the minimum separation at which a stellar companion at the bottom of the Main Sequence (0.08 M) could be detected was determined. The variance of the pixel values within the science images was measured as a function of separation, scaled by the flux and apparent magnitude of the central target, and compared to the expected apparent magnitude of a 0.08 M stellar companion obtained from theoretical models (Baraffe et al., 1998).
Three of the sample members have also been searched for binary companions with speckle interferometry (HIP 51658, HIP 76375, and HIP 112460; Miura et al., 1995; Hartkopf & Mason, 2009; Balega et al., 2007), and none of which were found to have a binary companion. While these techniques would be sensitive to a high mass ratio binary companion at close separations, their sensitivity does not extend to the bottom of the Main Sequence. Future observations with increased sensitivity are required in order to rule out the presence of any stellar companion interior to the detection limits given in Table 5.
To search for companions beyond the field-of-view of the high angular resolution instruments, the digitized photographic plates for each target were blinked to reveal the presence of any wide co-moving companions. To ensure wide CPM companions were not missed during the visual inspection, the PPMXL (Roeser et al., 2010) and the UCAC4 (Zacharias et al., 2012) catalogues were also searched for stars with proper motions consistent with the object being physically bound to the primary.
4.3 IRAS data
We visually inspected each image in order to assess the quality and association of IRAS Faint Source Catalogue fluxes that have been extracted for the targets. The synthesized beam sizes of the Faint Source Survey images are approximately 1′ 4′at 12 m and 25 m, 2′ 4′and 4′ 5′at 60 m and 100 m, respectively. The positional uncertainties of IRAS detections for our sample is 3″in the in-scan direction and 18″in the cross-scan direction. In addition, we have reassessed the quality of the FSC extracted flux densities for our targets, with the use of the online Scan Processing and Integration (SCANPI) tool555http://irsa.ipac.caltech.edu/applications/Scanpi/. SCANPI combines the signal for all (in-scan) survey scans that correspond to the target position and provides fluxes of faint sources, estimates of true local upper limits and deviation of the signal peak to that of the source position. Despite the stringent processing of the survey scans and catalog criteria that have been implemented for source extraction and identification, the large angular resolution of the IRAS beams is one of the primary factors of possible source contamination.
4.4 Higher resolution mid-far IR WISE, Spitzer and Herschel images
WISE provides a factor of 10 higher resolution images in the mid-IR than IRAS. The WISE beam sizes are 61, 64, 65 and 12″at 3.4 m (W1), 4.6 m (W2), 12 m (W3) and 22 m (W4). To utilize this significant improvement of resolution, we performed visual cross inspection of the four WISE bands, to identify any contaminating objects that are contained within the IRAS beam sizes. Additionally, we investigated the available Spitzer MIPS and Herschel PACS (Poglitsch et al., 2010) processed images from the archive for the targets HIP 76375, HIP 112460, and HIP 51658. HIP 68160 was not observed by either Spitzer or Herschel. The Spitzer FWHM beam size with MIPS at 24 m is 6″, a factor two greater than the WISE W4 band, and pointed observations further increase the sensitivity beyond that achieved with the WISE survey. The far-IR MIPS channels at 70 m and 160 m, with corresponding beam sizes of 20 and 40, and the Herschel PACS channels at 70 m , 100 m and 160 m, with FWHM beam sizes of 56, 68 and 114 respectively, provide the far-IR wavelength coverage with significantly greater resolution than that of IRAS, enabling the identification of contaminating objects such as background galaxies that become increasingly brighter across the mid-far IR regime.
| Target | Radius to reach bottom of MS | Detected | Companion Separation | Position Angle | mag | Technique |
|---|---|---|---|---|---|---|
| (AU) | Companion | (AU) | (°) | (mag) | ||
| HIP 51658 | 39 | N | - | - | - | - |
| HIP 68160 | 94 | N | - | - | - | - |
| HIP 73165 | 45 | N | - | - | - | - |
| HIP 73512 | 41 | N | - | - | - | - |
| HIP 76375 | 35 | Y | 2725 | 148 | K=0.79 | CPM |
| HIP 112460 | 1 | N | - | - | - | - |
5 Results
None of the six debris disk targets were detected in the CSO SHARCII maps. The 3 upper limits range from 31 mJy for HIP 51658 to 239 mJy for HIP 73512 at 450 m, and all the limits are reported in Table 4. For four of the five cold debris disks targets, the submm flux limits are substantially below the extension of the blackbody fit to the IRAS excesses, as shown in Figure 1. The CSO limit for the cold debris disk candidate HIP 73512 is above the blackbody fit, as shown in Figure 2, and the CSO data do not constrain the disk in this case. The WISE excess source HIP 73165 also shows a lack of submm emission at a level reported in Table 4 and plotted on the SED in Figure 3.
5.1 CSO flux limits
The flux limits were converted into dust mass limits following previous submm studies (e.g. Zuckerman & Becklin, 1993) using the expression = (, where the blackbody function is equal to 2 in the Rayleigh-Jeans limit. The dust opacity at the frequency of observation assumes a functional form at submm wavelengths. We use a normalization value at 850 m and scale with =1 (Zuckerman & Becklin, 1993; Pollack et al., 1994). Existing submm studies find that =1 is a representative value of debris disks (Dent et al., 2000) and the normalization value for dust opacity is adopted for direct comparison with previous studies (e.g Sylvester et al., 2001; Wyatt et al., 2003; Liu et al., 2004; Sheret et al., 2004; Najita & Williams, 2005; Williams & Andrews, 2006). Assuming an average dust temperature of 30 K for the submm-emitting dust, the submm flux limits correspond to dust mass limits of 0.001 to 0.261 M⊕, as reported in Table 4. These dust mass limits are comparable to the detections of other nearby debris disks based on either submm fluxes or fits to IRAS fluxes over a large wavelength range (e.g. compilation in Rhee et al., 2007).
The submm upper limits are plotted along with previous measurements at shorter wavelengths to construct the SEDs of the IRAS cold excess debris disks with limits below the blackbody fit in Figure 1 and with a limit above the blackbody fit in Figure 2. The WISE warm excess debris disk SED is plotted in Figure 3. For the cold excess sources, the fits to the 60-100 m emission, assuming a single temperature blackbody, are also shown for comparison with the measured CSO limits. For the targets HIP 51658, HIP 68160, HIP 76375 and HIP 112460, the submm limits are all well below the expected flux level at these wavelengths, making these limits more restrictive than previous submm measurements of some debris disks candidates Williams & Andrews (2006). For the WISE source, there is not a large enough wavelength coverage for the excess emission to perform a fit, and the exploratory measurement at the longer wavelength is shown in comparison to the newly reported mid-IR excess in the WISE W4 band. With only an excess in the longest wavelength WISE band, it is not possible to fit a blackbody to estimate an expected flux level for the CSO measurement, but the non-detection is consistent with a spatially confined distribution of hot dust for this source. Larger scale studies with more sensitive limits from Herschel will provide more definitive constraints on the origin of WISE excesses for sources such as HIP 73165.
5.2 Companion systems
Since a companion star will gravitationally truncate the outer portion of a disk and reduce the amount of submm-emitting dust, all targets were searched for stellar companions. A visual inspection of the high-resolution data did not reveal any companion candidates. Separately, a visual inspection of each of the blinked image pairs combined with a search of the astrometric catalogues, identified one co-moving object - the known wide common proper motion (CPM) companion to HIP 76375 (Shaya & Olling, 2011). The HIP 76375 system is shown in Figure 4. The binary separation is 1218, which corresponds to a projected physical separation of 2700 AU – too large to impact the disk size unless the orbit is very eccentric and periastron passage occurs at a much smaller separation. Table 5 lists the details of the HIP 76375 binary system and the closest separation at which the data become sensitive to companions at the bottom of the Main Sequence for each of the targets. The minimum separation ranges from only 1 AU for the M-star HIP 112460 at 5 pc to 94 AU for the more massive and more distant A-star HIP 51658 at 30 pc. In addition to the the companion search we performed, five targets were included in the interferometric (van Belle et al., 2008; van Belle, 2010) and speckle (Hartkopf & McAlister, 1984; Miura et al., 1995; Hartkopf & Mason, 2009; Balega et al., 2007) searches, and no companions were discovered for these targets, although the detection limits were not deep enough to include all possible stellar companions.
5.3 IRAS source contamination
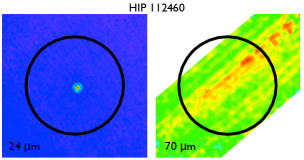
For the four cold debris disk candidates with submm limits well below the SED fit (shown in Figure 1), we investigated the possibility of contaminating sources within the IRAS beam. All targets have WISE images in four bands with higher resolution than IRAS, and three of the four targets have Spitzer data in at least one bandpass. Three of the four objects – HIP 51658, HIP 61680, and HIP 76375 – show contaminating sources in the higher resolution mid-IR/far-IR images shown in Figure 6. Only one – HIP 112460 – shows a single object in the higher resolution WISE and Spitzer maps shown in Figure 7. The results of the contamination analysis for these sources is discussed in the following subsections.
5.3.1 HIP 51658
From the sequence of WISE images for HIP 51658 in Figures 5 and 6, a nearby object 55″to the NE of HIP 51658 is seen and becomes increasingly brighter with wavelength. Also shown in Figure 6 is the Herschel PACS 100 m map centered on the target which reveals the offset source, but not the target. In both the WISE and Herschel maps there are additional fainter sources within the IRAS beam (not visible with the scaling of Figure 6). Three distinct sources are detected in the Herschel 100 m map. From our SCANPI analysis of this source, we find that signals are significant in all IRAS bands (5) and the the deviation from source position to the signal peak is 0.5′.
To determine the flux of the contaminating objects, we have measured the flux densities of the nearby three objects that fall within the IRAS beam centered over the source position, and find that the cumulative flux density at 100 m is consistent with the IRAS FSC 100 m flux. Furthermore, the 160 m cumulative flux density fits well to the single temperature blackbody, modelled excess fit. The PACS fluxes, along with our 450 m upper limit that lies significantly below the fit, are shown in Figure 1. This analysis indicates that the associated IRAS 60 m and 100 m fluxes of this source are contaminated and that HIP 51658 is not a bona fide debris disk system. To determine more accurate flux upper limits for HIP 51658, we have extracted level 2.5 processed PACS 100 m and 160 m images from the Herschel archive and measured 3 flux upper limits of 22 mJy at 100 m and 34 mJy at 160 m, following the point source photometry guidelines recommended by the Herschel team666Technical Note PICC-ME-TN-037 in http://herschel.esac.esa.int.
5.3.2 HIP 68160
As shown in Figure 6, a nearby object 35″to the west of HIP 68160 is visible in the W4 22 m image, and lies within the IRAS beam. The IRAS 25 m flux for this source is reported as an upper limit in the FSC. As there are no higher resolution far-IR observations available from Spitzer or Herschel for this source, we are unable to quantify the level of flux contamination within the IRAS 60 m and 100 m bands, unlike the case of HIP 51658. The presence of the additional source in the WISE W4 image does, however, suggest that the IRAS fluxes are heavily influenced by this red object. Based on this second source in the field, HIP 68160 is also a probable case of a misclassified debris disk system.
5.3.3 HIP 76375
This target is the only known binary in our sample. Both the target and binary companion (separation of 1218) are visible in all four WISE images (see Figure 5) and the MIPS 24 m image (see Figure 6). From our SCANPI analysis we note that there is a large positional offset (1.9′) from the source to signal peak in the IRAS 12 m band, with a SNR of 8. Figure 5 shows the IRAS scans at 12 m, 60 m and 100 m. In the 12 m scan, the position of the binary companion falls on the peak emission pixel, indicating that the IRAS 12 m flux reported for this source contaminated is from emission of the secondary.
To investigate the longer wavelength measurements, we have extracted the archival MIPS images at 24 m and 70 m for this source, shown in Figure 6. In all the WISE images and in the MIPS 24 m image, both the target and companion are visible. The galaxy, IC 45634777Identified in the NASA/IPAC Extragalactic Database - http://ned.ipac.caltech.edu/ (80″to the E) is seen to become increasingly brighter with longer wavelengths, as seen in Figures 5 and 6. In the MIPS 70 m image, neither the source or companion are visible, yet the galaxy is clearly seen and lies within the IRAS 100 m beam, centered over the source position. The SNR of the signal, returned with SCANPI at 60 m is marginal at 2.9 and the positional offset from the source to signal peak is 0.33′. Whilst this offset is below the FSC criteria to flag the source as an upper limit, it is significantly greater than that of other 60 m source detections (as determined through comparison of our sources and those of a similar study i.e. Williams & Andrews, 2006 - as is discussed in Section 6).
From the MIPS images we have measured the source flux at 24 m, the 3 upper limit at 70 m, and the flux of the galaxy (light blue point); included on the SED shown in Figure 1. We find that the source 24 m flux lies on the modelled photosphere of this object and that the 70 m upper limit lies significantly below the single blackbody, model excess fit. Furthermore, we find that the 70 m flux of the galaxy matches well to the excess fit. In visual inspection of the IRAS scans it can be seen that at the position of the galaxy, the corresponding pixel becomes increasingly brighter at longer wavelengths. From this analysis, we conclude that both the IRAS 60 m and 100 m flux is contaminated due to the emission from the galaxy.
5.3.4 HIP 112460
Although the HIP 112460 M-star cold debris disk candidate has the largest discrepancy between the predicted submm flux from the SED and the measured CSO limit (a factor of 100), no additional source was identified within the IRAS beam. From inspection of the higher resolution WISE and MIPS images, no contaminating object is detected in the surrounding field of this source, as shown in Figure 7. Due to the low latitude of the source (b = -13°), it is possible that the associated 100 m IRAS flux is contaminated from Galactic cirrus emission. Another possibility for this nearby source is a dilution of the flux from a disk due to a spatially resolved disk. To assess the impact of a spatially resolved disk, we searched for the largest reported spatially resolved disks around M-stars (AU Mic – MacGregor et al., 2013 and GJ 581 – Lestrade et al., 2012), scaled the disk size based on the distance to HIP 112460, and determined the number of beams across which the flux would be distributed in a uniform disk. Even for the larger of the two resolved M-star disks, the resulting size at the distance of HIP 112460 would spread the flux across 9 beams, diluting the flux by a factor too small to account for the large discrepancy.
Another possible explanation for the submm non-detection is a variable source. Some support for this hypothesis comes from the conflicting flux measurements at different epochs, since the fluxes obtained from later observations with WISE at 12 m and 22 m and Spitzer MIPS at 24 m fall on the photosphere of the star, compared to the excesses obtained from the earlier IRAS at 12 and 25 m scans, and seen at high significance at 12 m and 100 m in Figure 5. From the Spitzer MIPS images of this source, we measured the 24 m flux and the 70 m upper limit. As shown in Figure 1, the Spitzer 24 m flux lies on the modelled stellar photosphere for this source and both the 3 upper limits at 70 m and our 350 m observation, lie well below the modelled, single blackbody excess fit (unlike the IRAS values). A large scale IRAS variability investigation of blazars (Impey & Neugebauer, 1988) did find sources with variability up to an order of magnitude at 100 m, however such a large amplitude change was very rare. Another example of a large degree of variability intrinsic to a debris disk at somewhat shorter wavelengths in the mid-IR was reported for the TYC 8241 2652 1 debris disk (Melis et al., 2012) which exhibited a remarkable change of a factor of 30 over a timescale of less than two years. More observations are required to provide further understanding into the nature of this unusual, possibly variable, system.
6 Investigation of other debris disks with upper limits
The high rate of source contamination of the IRAS FSC fluxes found amongst our cold debris disk sample prompted us to conduct the same contamination analysis for a previous submm study, at 850 m of eight debris disks (Williams & Andrews, 2006), to further assess the likelihood of additional examples of misidentified debris disks. In the Williams & Andrews (2006) study, the sources were selected through IRAS FSC excesses, similar to our program. Upper-limits were obtained for two of the eight sources – HD 56099 and HD 78702. From inspection of the higher resolution WISE and Spitzer MIPS images of these two sources, we find that a nearby object lies within the IRAS beam size for HD 56099). No nearby contaminating objects are visible in either the WISE or Spitzer images for HD 78702. For HD 56099, the nearby object is visible in the WISE W3 and W4 images and in the MIPS 24 m, 70 m and 160 m images, and becomes increasingly brighter with wavelength. Moór et al. (2006) identify this source to be a misclassified debris disk system, due to the nearby object contamination as identified, and Moór et al. (2011) have further analysed the Spitzer observations for this target and find a low significance level of excess above that of the stellar photosphere. One out of eight sources, in the study carried out by Williams & Andrews (2006), was misidentified of possessing a cold debris disk. Comparatively, for the cold debris disk sample within this paper, three out of the five sources show evidence of nearby object contamination of the associated IRAS FSC fluxes.
7 Conclusions
We have presented new submm observations at either 350 m or 450 m, searching for dust emission around a sample of cold and warm nearby ( 40pc) debris disk candidates that have been identified from IRAS or WISE excesses.
Upper-limits were obtained for all six targets, and four of the limits are well below the expected submm flux, based on a single temperature blackbody model fit to previous shorter wavelength photometry. Of the four cold excess sources with very discrepant submm limits compared to the SED fit, we found that three targets have clearly identified contaminating objects in the IRAS beam, and, therefore, are likely misidentified debris disk candidates. Quantitive measurements of the contaminating objects were obtained for two targets – HIP 51658 and HIP 76375 – from higher resolution, pointed Herschel PACS and Spitzer MIPS observations at wavelengths comparable to the IRAS excess fluxes. From visual inspection of the WISE all-sky survey images, we find that HIP 61680 is also like to suffer from IRAS contamination, in which we identify a nearby, background object that becomes increasingly brighter over the WISE bands as the likely true source of the IRAS FSC measurement.
The rate of IRAS contamination has likely lead to a greater number of sources in being identified as possessing cold debris disks than the actual number. Considering the high level of source contamination in this study and comparable results from an analysis of other debris disks candidates with submm non-detections (Williams & Andrews, 2006), lower detection rates than anticipated for large scale debris disks surveys that are currently being pursued with Herschel and SCUBA2 may be found.
It is important to highlight the need for careful examination of source contamination for observations in the far-IR and submm wavelengths, where the probability of detecting a nearby background source can be as high as 36% (Booth et al., 2013; Berta et al., 2011). In this study we find 4-5 examples of contamination either from identified objects or possible background variability, giving a contamination rate of 31-38% similar to the probability reported in Booth et al. (2013).
Finally, we note that it is only now that it is possible to assess systematically the IRAS associations of debris disk candidates by using the complementary mid-IR to far-IR wavelength coverage and higher resolution and sensitivity provided by WISE, Spitzer and Herschel.
Acknowledgements.
This material is based upon work at the Caltech Submillimeter Observatory, which is operated by the California Institute of Technology under cooperative agreement with the National Science Foundation (AST-0838261) We gratefully acknowledge support to Exeter from the Leverhulme Trust (F/00144/BJ) and STFC (ST/F0071241/1, ST/H002707/1). This research is partly based on data obtained from the ESO Science Archive Facility, and the CFHT Science Archive. Based on observations made with the NASA/ESA Hubble Space Telescope, obtained from the data archive at the Space Telescope Science Institute. STScI is operated by the Association of Universities for Research in Astronomy, Inc. under NASA contract NAS 5-26555. This research has made use of the SIMBAD database, operated at CDS, Strasbourg, France. This publication makes use of data products from the Two Micron All Sky Survey, which is a joint project of the University of Massachusetts and the Infrared Processing and Analysis Center/California Institute of Technology, funded by the National Aeronautics and Space Administration and the National Science Foundation. This research has made use of the Washington Double Star Catalog maintained at the U.S. Naval Observatory. This research has made use of data obtained from the SuperCOSMOS Science Archive, prepared and hosted by the Wide Field Astronomy Unit, Institute for Astronomy, University of Edinburgh, which is funded by the UK Science and Technology Facilities Council. This research used the facilities of the Canadian Astronomy Data Centre operated by the National Research Council of Canada with the support of the Canadian Space Agency. This research has made use of the NASA/IPAC Infrared Science Archive, which is operated by the Jet Propulsion Laboratory, California Institute of Technology, under contract with the National Aeronautics and Space Administration. This publication makes use of data products from the Wide-field Infrared Survey Explorer, which is a joint project of the University of California, Los Angeles, and the Jet Propulsion Laboratory/California Institute of Technology, funded by the National Aeronautics and Space Administration.References
- Aumann et al. (1984) Aumann, H. H., Beichman, C. A., Gillett, F. C., et al. 1984, Astrophysical Journal, 278, L23
- Backman & Paresce (1993) Backman, D. E. & Paresce, F. 1993, In: Protostars and planets III (A93-42937 17-90), 1253
- Balega et al. (2007) Balega, I. I., Balega, Y. Y., Maksimov, A. F., et al. 2007, Astrophysical Bulletin, 62, 339
- Baraffe et al. (1998) Baraffe, I., Chabrier, G., Allard, F., & Hauschildt, P. H. 1998, Astronomy and Astrophysics, 337, 403
- Beichman et al. (2006) Beichman, C. A., Tanner, A., Bryden, G., et al. 2006, The Astrophysical Journal, 639, 1166
- Berta et al. (2011) Berta, S., Magnelli, B., Nordon, R., et al. 2011, Astronomy & Astrophysics, 532, 49
- Booth et al. (2013) Booth, M., Kennedy, G., Sibthorpe, B., et al. 2013, Monthly Notices of the Royal Astronomical Society, 428, 1263
- Bryden et al. (2006) Bryden, G., Beichman, C. A., Trilling, D. E., et al. 2006, The Astrophysical Journal, 636, 1098
- Cameron (1997) Cameron, A. G. W. 1997, Icarus, 126, 126
- Carpenter et al. (2009) Carpenter, J. M., Bouwman, J., Mamajek, E. E., et al. 2009, The Astrophysical Journal Supplement, 181, 197
- Cutri & et al. (2012) Cutri, R. M. & et al. 2012, VizieR On-line Data Catalog, 2311, 0
- Dent et al. (2000) Dent, W. R. F., Walker, H. J., Holland, W. S., & Greaves, J. S. 2000, Monthly Notices of the Royal Astronomical Society, 314, 702
- Dowell et al. (2003) Dowell, C. D., Allen, C. A., Babu, R. S., et al. 2003, Millimeter and Submillimeter Detectors for Astronomy. Edited by Phillips, 4855, 73
- Dunne & Eales (2001) Dunne, L. & Eales, S. A. 2001, Monthly Notices of the Royal Astronomical Society, 327, 697
- Griffin & Orton (1993) Griffin, M. J. & Orton, G. S. 1993, Icarus, 105, 537
- Habing et al. (1999) Habing, H. J., Dominik, C., de Muizon, M. J., et al. 1999, Nature, 401, 456
- Hambly et al. (2001) Hambly, N. C., MacGillivray, H. T., Read, M. A., et al. 2001, Monthly Notices of the Royal Astronomical Society, 326, 1279
- Hartkopf & Mason (2009) Hartkopf, W. I. & Mason, B. D. 2009, The Astronomical Journal, 138, 813
- Hartkopf & McAlister (1984) Hartkopf, W. I. & McAlister, H. A. 1984, Astronomical Society of the Pacific, 96, 105
- Hauschildt et al. (1999) Hauschildt, P. H., Allard, F., & Baron, E. 1999, The Astrophysical Journal, 512, 377
- Hillenbrand et al. (2008) Hillenbrand, L. A., Carpenter, J. M., Kim, J. S., et al. 2008, The Astrophysical Journal, 677, 630
- Holland et al. (1998) Holland, W. S., Greaves, J. S., Zuckerman, B., et al. 1998, Nature, 392, 788
- Hughes et al. (2011) Hughes, A. M., Wilner, D. J., Andrews, S. M., et al. 2011, The Astrophysical Journal, 740, 38
- Impey & Neugebauer (1988) Impey, C. D. & Neugebauer, G. 1988, Astronomical Journal (ISSN 0004-6256), 95, 307
- Jayawardhana et al. (2002) Jayawardhana, R., Holland, W. S., Kalas, P., et al. 2002, The Astrophysical Journal, 570, L93
- Jenness et al. (2002) Jenness, T., Stevens, J. A., Archibald, E. N., et al. 2002, Monthly Notice of the Royal Astronomical Society, 336, 14
- Kovács (2006) Kovács, A. 2006, Proquest Dissertations And Theses 2006. Section 0036, 28
- Kovács (2008) Kovács, A. 2008, Millimeter and Submillimeter Detectors and Instrumentation for Astronomy IV. Edited by Duncan, 7020, 45
- Kuchner & Holman (2003) Kuchner, M. J. & Holman, M. J. 2003, The Astrophysical Journal, 588, 1110
- Leong et al. (2006) Leong, M., Peng, R., Houde, M., et al. 2006, Millimeter and Submillimeter Detectors and Instrumentation for Astronomy III. Edited by Zmuidzinas, 6275, 21
- Lestrade et al. (2012) Lestrade, J.-F., Matthews, B. C., Sibthorpe, B., et al. 2012, Astronomy & Astrophysics, 548, 86
- Lestrade et al. (2006) Lestrade, J.-F., Wyatt, M. C., Bertoldi, F., Dent, W. R. F., & Menten, K. M. 2006, Astronomy and Astrophysics, 460, 733
- Liou & Zook (1999) Liou, J.-C. & Zook, H. A. 1999, The Astronomical Journal, 118, 580
- Lisse et al. (2002) Lisse, C., Schultz, A., Fernandez, Y., et al. 2002, The Astrophysical Journal, 570, 779
- Liu et al. (2004) Liu, M. C., Matthews, B. C., Williams, J. P., & Kalas, P. G. 2004, The Astrophysical Journal, 608, 526
- MacGregor et al. (2013) MacGregor, M. A., Wilner, D. J., Rosenfeld, K. A., et al. 2013, The Astrophysical Journal Letters, 762, L21
- Mannings & Barlow (1998) Mannings, V. & Barlow, M. J. 1998, Astrophysical Journal v.497, 497, 330
- McCarthy et al. (1998) McCarthy, D. W., Ge, J., Hinz, J. L., et al. 1998, American Astronomical Society, 193, 1265
- Melis et al. (2012) Melis, C., Zuckerman, B., Rhee, J. H., et al. 2012, Nature, 487, 74
- Miura et al. (1995) Miura, N., Iribe, T., Kubo, T., Baba, N., & Isobe, S. 1995, Publications of the National Astronomical Observatory of Japan, 4, 67
- Moór et al. (2006) Moór, A., Ábrahám, P., Derekas, A., et al. 2006, The Astrophysical Journal, 644, 525
- Moór et al. (2011) Moór, A., Pascucci, I., Kóspál, Á., et al. 2011, The Astrophysical Journal Supplement, 193, 4
- Moshir et al. (1992) Moshir, M., Kopman, G., & Conrow, T. A. O. 1992, Pasadena: Infrared Processing and Analysis Center
- Najita & Williams (2005) Najita, J. & Williams, J. P. 2005, The Astrophysical Journal, 635, 625
- Patience et al. (2011) Patience, J., Bulger, J., King, R. R., et al. 2011, Astronomy & Astrophysics, 531, L17
- Perryman & ESA (1997) Perryman, M. A. C. & ESA. 1997, The Hipparcos and Tycho catalogues. Astrometric and photometric star catalogues derived from the ESA Hipparcos Space Astrometry Mission, 1200, iSBN: 9290923997
- Poglitsch et al. (2010) Poglitsch, A., Waelkens, C., Geis, N., et al. 2010, Astronomy and Astrophysics, 518, L2
- Pollack et al. (1994) Pollack, J. B., Hollenbach, D., Beckwith, S., et al. 1994, Astrophysical Journal, 421, 615
- Quillen & Faber (2006) Quillen, A. C. & Faber, P. 2006, Monthly Notices of the Royal Astronomical Society, 373, 1245
- Rhee et al. (2007) Rhee, J. H., Song, I., Zuckerman, B., & McElwain, M. 2007, The Astrophysical Journal, 660, 1556
- Rieke et al. (2005) Rieke, G. H., Su, K. Y. L., Stansberry, J. A., et al. 2005, The Astrophysical Journal, 620, 1010
- Roeser et al. (2010) Roeser, S., Demleitner, M., & Schilbach, E. 2010, The Astronomical Journal, 139, 2440
- Sandell (2003) Sandell, G. 2003, ‘The calibration legacy of the ISO Mission’, 481, 439
- Shaya & Olling (2011) Shaya, E. J. & Olling, R. P. 2011, The Astrophysical Journal Supplement, 192, 2
- Sheret et al. (2004) Sheret, I., Dent, W. R. F., & Wyatt, M. C. 2004, Monthly Notices of the Royal Astronomical Society, 348, 1282
- Silverstone (2000) Silverstone, M. D. 2000, Thesis (PhD). UNIVERSITY OF CALIFORNIA, 17
- Smith & Terrile (1984) Smith, B. A. & Terrile, R. J. 1984, Science (ISSN 0036-8075), 226, 1421
- Song et al. (2002) Song, I., Weinberger, A. J., Becklin, E. E., Zuckerman, B., & Chen, C. 2002, The Astronomical Journal, 124, 514
- Stern (1996) Stern, S. A. 1996, Astronomy and Astrophysics, 310, 999
- Su et al. (2006) Su, K. Y. L., Rieke, G. H., Stansberry, J. A., et al. 2006, The Astrophysical Journal, 653, 675
- Sylvester et al. (2001) Sylvester, R. J., Dunkin, S. K., & Barlow, M. J. 2001, Monthly Notices of the Royal Astronomical Society, 327, 133
- van Belle (2010) van Belle, G. T. 2010, The Interferometric View on Hot Stars (Eds. Th. Rivinius & M. Curé) Revista Mexicana de Astronomía y Astrofísica (Serie de Conferencias) Vol. 38, 38, 119
- van Belle et al. (2008) van Belle, G. T., van Belle, G., Creech-Eakman, M. J., et al. 2008, The Astrophysical Journal Supplement Series, 176, 276
- van Leeuwen (2007) van Leeuwen, F. 2007, Astronomy and Astrophysics, 474, 653
- Williams & Andrews (2006) Williams, J. P. & Andrews, S. M. 2006, The Astrophysical Journal, 653, 1480
- Wyatt (2006) Wyatt, M. C. 2006, The Astrophysical Journal, 639, 1153
- Wyatt (2008) Wyatt, M. C. 2008, Annual Review of Astronomy & Astrophysics, 46, 339
- Wyatt et al. (2003) Wyatt, M. C., Dent, W. R. F., & Greaves, J. S. 2003, Monthly Notice of the Royal Astronomical Society, 342, 876
- Zacharias et al. (2012) Zacharias, N., Finch, C. T., Girard, T. M., et al. 2012, VizieR On-line Data Catalog, 1322, 0
- Zuckerman (2001) Zuckerman, B. 2001, Annual Review of Astronomy and Astrophysics, 39, 549
- Zuckerman & Becklin (1993) Zuckerman, B. & Becklin, E. E. 1993, Astrophysical Journal, 414, 793