Incidence of Strong Mg ii Absorbers Towards Different Types of Quasars
Abstract
We report the first comparative study of strong Mg ii absorbers (Å) seen towards radio-loud quasars (RLQs) of core-dominated (CDQ) and lobe-dominated (LDQ) types and normal quasars (QSOs). The CDQ and LDQ samples were derived from the Sloan Digital Sky Survey data release 7 (SDSS-DR7) after excluding known ‘broad-absorption-line’ quasars (BALQSOs) and blazars. The Mg ii associated absorption systems having a velocity offset km.s-1 from the systemic velocity of the background quasar were also excluded. Existing spectroscopic data for redshift-matched sightlines of 3975 CDQs and 1583 LDQs, covering a emission redshift range 0.394.87, were analysed and 864 strong Mg ii absorbers were found, covering the redshift range 0.452.17. The conclusions reached using this well-defined large dataset of strong Mg ii absorbers are: (i) The number density, , towards CDQs shows a small, marginally significant excess ( at 1.5 significance) over the estimate available for QSOs; (ii) In the redshift space, this difference is reflected in terms of a excess of over the QSOs, within the narrow redshift interval 1.2 1.8; (iii) The distribution (with ) for CDQs shows a significant excess (at level) over the distribution found for a redshift and luminosity matched sample of QSOs, at in the range 0.050.1. This leads us to infer that a significant fraction of strong Mg ii absorption systems seen in this offset velocity range are probably associated with the CDQs and might be accelerated into the line of sight by their powerful jets and/or due to the accretion-disk outflows close to our direction. Support to this scenario comes from a consistency check in which we only consider the spectral range corresponding to 0.2. The computed redshift distribution for strong Mg ii absorbers towards CDQs now shows excellent agreement with that known for QSOs, as indeed is expected for purely intervening absorption systems. Thus, it appears that for CDQs (and blazars) the associated strong Mg ii absorbers can be seen at much larger velocities relative to the nucleus than the commonly adopted upper limit of 5000 km.s-1.
keywords:
galaxies: active – quasars: absorption lines – quasars: general — BL Lacertae objects: general — intergalactic medium — galaxies: jets — techniques: spectroscopic1 Introduction
The analysis of quasar absorption line systems (QALs) has emerged as a powerful means of investigating the physical conditions of the gaseous medium of the intervening galaxies also when they lie at very large redshifts and are too faint for direct imaging/spectroscopy even with the largest telescopes (Bahcall & Salpeter, 1966; Bahcall, 1980; Wolfe et al., 2005; Kulkarni et al., 2012). Further, recent studies have revealed the potential of QALs as tracers of extremely high-speed (mildly relativistic) ejection of cool gas clouds by the powerful jets emanating from radio-loud quasars (Bergeron, Boissé, & Ménard 2011, henceforth BBM; Chand & Gopal-Krishna 2012, Paper I). Among the best studied population of intervening galaxies is the one selected by Mg ii absorption systems, which based on their rest-frame equivalent width (), whether greater than 1Å or not, are classified as ‘strong systems’ and ‘weak systems’, respectively. It is now well established that for strong Mg ii system (Å) a galaxy is nearly always found within an impact parameter of 100 kpc (e.g., Steidel, 1995; Churchill et al., 2005; Zibetti et al., 2007; Kacprzak et al., 2008; Chen & Tinker, 2008) and spanning a wide range in optical luminosity (e.g., Bergeron & Stasińska, 1986; Steidel, 1995; Kacprzak et al., 2008). On the other hand, weak Mg ii system (Å Å) are thought to predominantly trace separate populations of galaxies, such as low surface brightness galaxies, or dwarf galaxies (e.g., Churchill et al., 1999; Narayanan et al., 2007).
Until recently, the paradigm has been that the cool gas clouds (e.g., Mg ii absorption systems) with velocities km.s-1 relative to the background quasar are mostly associated with the quasar itself (‘associated systems’), although somewhat higher velocity limit has been inferred in recent literature (e.g., Wild et al., 2008). Absorbers at significantly larger velocity offsets are believed to be ‘intervening’ systems entirely unrelated to the background quasar. Recent evidence, however, appears to question this canonical view and suggests that even associated systems can have significantly relativistic velocities relative to the background quasar, in case the quasar is undergoing powerful jet activity and/or high speed accretion-disk outflows (see below). A possible signature of this would be if the occurrence rate, , of ‘intervening’ absorbers is found to depend on the type of the background source. Indeed, such an indication came from the unexpected finding of BBM that of Mg ii absorption systems towards blazars is 2 times (at 3 confidence) higher than the value known for normal (optically selected and mostly radio-quiet) quasars (QSOs), when strong Mg ii lines alone are considered. A similar excess of times (at 2.5 confidence) was also seen for the weak Mg ii absorption systems by BBM. However, this result for blazars, which are as a class, believed to have relativistic jets pointed close to our direction, is drawn from a modest size sample consisting of only 45 powerful blazars having . On the other hand, no significant excess of was found by Chand & Gopal-Krishna (2012) in their analysis of the spectral data for radio core-dominated quasars (CDQs, also called flat-spectrum radio quasars: FSRQs), whose flux is also jet dominated, albeit only weakly polarized.
These authors also presented evidence that the observed excess of Mg ii absorption systems towards blazars is confined to the velocity offsets of up to 0.15c, relative to the background source. Thus, they proposed that the excess of Mg ii absorbing clouds seen towards blazars is not evident towards CDQs because their jets are less closely aligned with our direction than are the blazar jets and, consequently, the putative absorbing clouds accelerated to mildly relativistic speeds by those jets are unlikely to intersect the line-of-sight. This explanation conforms to the orientation based unified model for powerful radio sources, according to which powerful blazars, core-dominated quasars (CDQs), lobe-dominated quasars (LDQs) and classical radio galaxies (RGs) form an orientation sequence characterized by an increasing degree of the jet’s mis-alignment from the line of sight (as reviewed, e.g., by Urry & Padovani, 1995; Barthel, 1999; Antonucci, 2012).
In order to further probe the role of the quasar jets in accelerating the absorption-line clouds to extremely large velocities, we endeavor here to extend the investigation of strong Mg ii absorption systems by one more step along the orientation sequence, i.e., by including LDQs. To do this, we shall examine multiple attributes of Mg ii absorption in uniformly selected, well-matched large samples of CDQs and LDQs and compare the and for these two quasar types, and also with the corresponding estimates available for optically selected ‘normal’ quasars (QSOs) which are known to be mostly radio-quiet and lack powerful jets. As explained below, the definitions of CDQs and LDQs used here, although somewhat unconventional, basically conform to the intended difference in terms of mis-alignment of the radio jet from the line-of-sight, as mentioned above.
We have taken the CDQ/LDQ classification for each quasar from the SDSS catalog which itself is based on the criterion adopted in Jiang et al. (2007). Although seemingly different, their criterion is effectively consistent with the standard definition based on either radio spectral index, or the fraction of total radio flux contributed by the nuclear core. In the definition of Jiang et al. (2007) a quasar is CDQ if its radio counterpart in the FIRST survey (resolution 5 arcsec, Becker et al. 1995) is either a single component, or is unresolved, or only partially resolved. On the other hand, a multi-component radio counterpart in the FIRST survey (within a 30 arcsec region) is designated by them as LDQ. Despite being unconventional, such a classification scheme meets the basic requirement for the purpose of the present statistical study, since the axes of the quasars classified by them as LDQs can be expected to have, on average, a larger mis-alignment from our direction, in comparison to the quasars classified by them as CDQs. Therefore, we have adopted here the CDQ/LDQ classification as provided in the SDSS-DR7 catalog.
Here, we may recall the few alternative physical explanations that have been considered for the reported excess of towards blazars vis a vis QSOs. These are (i) obscuration of the background QSO by the foreground dust, possibly associated with the Mg ii absorbers themselves, and (ii) gravitational lensing of the background blazar by intervening galaxies, possibly the ones hosting the Mg ii absorbers (see also, Frank et al., 2007; Hao et al., 2007). Due to the dust obscuration, one might miss the QSOs (especially, the optically-selected QSOs); however, the expected change in of Mg ii systems due to these effects is estimated to be minute (only 1%) (e.g. Ménard et al., 2008). BBM have argued that the expected amplitude of dust obscuration, or gravitational lensing falls short, by at least an order of magnitude, of explaining the afore-mentioned factor of two excess in the incidence of Mg ii absorbers towards blazars, vis a vis normal QSOs. As an alternative possibility, they have argued that the powerful blazar jets are capable of sweeping cool gas clouds of sufficiently large column densities (up to ) and accelerating them to velocities of order , potentially accounting for the observed excess of Mg ii absorption systems towards blazars, as compared to normal QSOs.
This paper is organised as follows. Sections 2 and 3 describe the selection of the samples of CDQs and LDQs, as well as the procedure for analysis of their optical spectra. In Section 4, we present the results of our analysis, followed by a discussion in Section 5.
2 The CDQ and LDQ samples
Our samples of CDQs and LDQs are extracted from the quasar catalog of Shen et al. (2011) (their online Table 1) which is derived from the Sloan Digital Sky survey, Data Release 7 (SDSS-DR7; (Abazajian et al., 2009; Schneider et al., 2010). We have applied five selection filters. Firstly, the radio-loudness parameter, R (= ratio of flux densities at 5 GHz and at 2500Å in the rest-frame) must exceed 10 (Kellermann et al., 1989). This resulted in 8257 radio-loud sources. The next filter was the availability of radio classification (CDQ, or LDQ), which was in fact available for all 8257 quasars in the Shen et al. (2011) compilation1110=FIRST undetected; 1=core-dominated; 2=lobe-dominated (radio morphology classification following Jiang et al. 2007), based on the FIRST survey, as already explained in Section 1. This filter resulted in 6152 CDQs and 2105 LDQs (the latter having a FIRST radio image resolved into multiple components). A third filter was applied to exclude the sources with smaller than 0.389, for which Mg ii emission line falls below the SDSS wavelength coverage (3800Å-9200Åin the observer’s frame of reference). This reduced the sample to 5824 CDQs and 2014 LDQs. The fourth filter was then applied by selecting only non-BAL quasars, which are flagged in the Shen et al. (2011) catalog, resulting in 5447 CDQs and 1971 LDQs. The final filter excluded all sources marked in the Véron-Cetty & Véron (2010) catalog as ‘HP’ (i.e., high optical fractional polarization), or BL Lac, or Seyfert. This selection chain led to a final sample containing 5333 CDQs and 1925 LDQs (total 7258 radio-loud quasars).
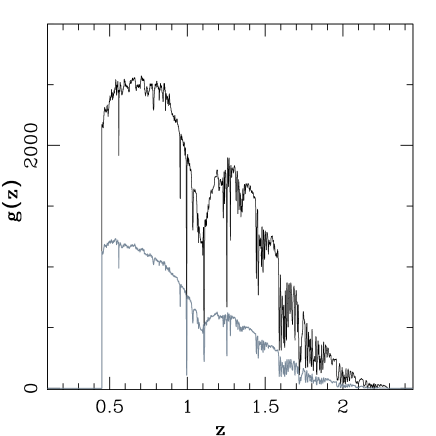
The reduced one-dimensional (1D) spectra for our entire sample of 7258 quasars were downloaded from the SDSS Data Archive Server222mirror.sdss3.org/bulk/Spectra (detail about the SDSS spectral information can be found inYork et al. 2000). Briefly, the SDSS spectra cover a spectral range from 3800Å to 9200Å, with a resolution () of about 2000 (i.e., 150 km.s-1). This spectral coverage allowed us to search for Mg ii absorption systems over a redshift range 0.389 2.27. The median redshifts of the redshift paths covered by our CDQ and LDQ samples are essentially identical, being 1.37 and 1.36, respectively (see Figure 1). This is not surprising since the spectra of both correspond to the SDSS spectral coverage and hence have the same observed wavelength window. This redshift matching is a well known essential requirement for the purpose of comparing of intervening Mg ii absorbers in quasar samples. Equally important is to ensure a matching range of , before comparing the distributions of the relative velocity () of the absorption systems relative to the respective background sources of different types (Section 4.2). At the same time, for the relative velocity distribution to be free from any systematic bias, accuracy of measurements is a crucial requirement. Recently, Hewett & Wild (2010) have refined the SDSS emission redshift values by reducing the net systematic errors by almost a factor of 20, attaining an accuracy of up to 30km.s-1. Therefore, throughout our analysis we have used the emission redshift values for our entire sample taken from this new catalog by Hewett & Wild (2010).
| Selection criteria | CDQs | LDQs | |
|---|---|---|---|
| For sample selection | Number of CDQs/LDQs | ||
| 1. | Radio loudness () | 6152 | 2105 |
| 2. | 0.389 | 5824 | 2014 |
| 3. | after excluding BALQSOs | 5447 | 1971 |
| 4. | after excluding HP, BLlac, Sy | 5333 | 1925 |
| 5. | (over 121-pixels) | 3975 | 1583 |
| For Mg ii Doublet identification | Number of absorbers | ||
| 6. | Mg ii2796,2803 candidates | 66726 | 16926 |
| 7. | doublet with 0.5Å(Mg ii2796) | 15096 | 4316 |
| and 0.2Å(Mg ii2803) | |||
| 8. | visual confirmation | 1113 | 424 |
| 9. | (over 121-pixels) and 1Å | 640 | 224 |
3 Analysis
3.1 Identification of Mg ii absorption systems
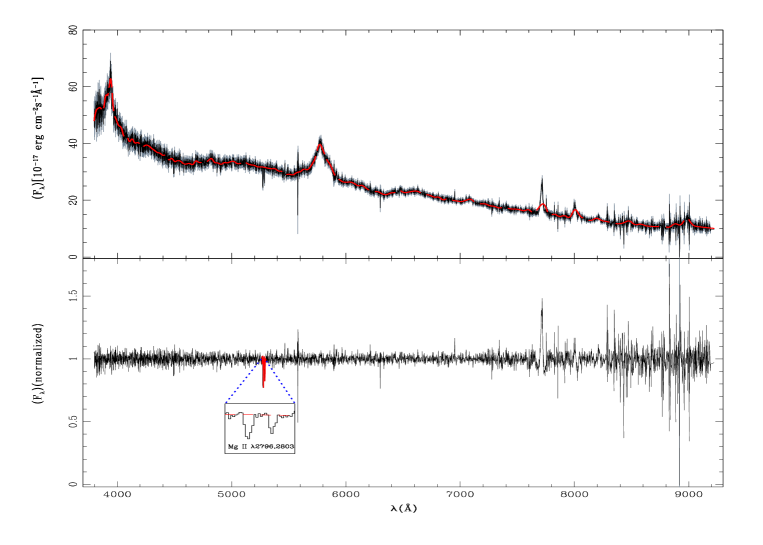
For each quasar, identification of the Mg ii absorption doublet in the normalized continuum spectrum, was carried out using several publicly available routines and, in particular, following the procedure outlined in Prochter et al. (2006)333e.g. cvs.ucolick.org/viewcvs.cgi/xmen/xidl/SDSS/. Basically, this algorithm initially fits a continuum to the SDSS spectroscopic data, employing first a principal component analysis (PCA) as a guess for the Ly and C iv emission lines (i.e., from 1000Å-2000Å in the rest-frame). Next, a b-spline algorithm is used to fit the underlying residual continuum, which results roughly in a power-law with broad emission features superposed. An example is shown in Figure 2.
This procedure automatically searches for absorption features in the normalized spectrum redward of Ly . The search was carried out for absorption features, which are fitted with Gaussian profile by taking an initial FWHM of 2.5 pixels, with the additional requirement that the minimum separation between lines should be about two times the FWHM. Out of all such cases, the final selection was made by accepting only the lines which are above two times the rms() noise in the spectrum.
The absorption features thus identified in each quasar spectrum, were searched for absorption line pairs. For this purpose our procedure first computed redshift of a given absorption feature, assuming it to be Mg ii2796. The corresponding positions of the expected Mg ii2803 and Fe ii2600 lines were then inspected. The criterion for accepting a feature as genuine Mg ii absorption system was that at least two of these three lines must be present at the expected locations above a 2 threshold. Equivalent widths of all the accepted Mg ii absorption lines were then measured (in the observed frame), by summing the difference from unity of the flux in the normalized observed-frame spectrum, within about 10 pixels wide boxes (11.51Å in the observed frame) placed at the centroids of the two Mg ii lines. In the spectra of 5333 CDQs and 1925 LDQs, our automated routine has detected 66726, 16926 possible Mg ii doublet candidates, out of which we have selected only those candidates having their value for Mg ii2796Å and Mg ii2803Å. This selection filter resulted in 15096 and 4316 possible strong() Mg ii doublet candidates for CDQ and LDQ samples, respectively.
As a further check, we also carried out a visual confirmation of each absorption system identified via the above automated procedure. This step is important since (i) our automated search does not carry out the line profile matching of the Mg ii candidate doublet and hence can result in over counting the Mg ii doublets rather than missing out any genuine systems, and (ii) any visually noticed uncertainty in the continuum level could have significantly distorted the estimate of , rendering the strong/weak classification of absorption systems unreliable. In this process of visual scrutiny, we first looked for the strongest five Fe ii lines corresponding to the candidate Mg ii doublet. We then made a velocity plot of the Mg i , Mg ii and the five Fe ii lines, so as to match by eye the line profiles and their strengths to those expected on the basis of the line oscillator strengths. Thus, in the spectra of the 5333 CDQs, we visually inspected all 15096 Mg ii absorption systems candidates and confirmed 1113 of them. Likewise, a total of 424 Mg ii absorption system were confirmed out of the 4316 candidates visually inspected in the spectra of the 1925 LDQs. Continuum fitting of each confirmed Mg ii absorption system was then further checked by plotting the fitted continuum to the spectral segment containing the Mg ii doublet. In all cases where the continuum fitting over the relevant spectral segment seemed unsatisfactory, we refined the local continuum fit and recomputed the (Mg ii). Summary of our step-wise selection and the criteria used to make our final sample are given in Table 1.
3.2 Number density of ‘intervening’ strong Mg ii absorption systems
In order to determine the number density, , of Mg ii absorption systems, we first excluded the redshift segments unsuited for a secure detection of the Mg ii absorption lines: (i) the regions blueward of the Ly- emission line, as it is strongly contaminated by the Ly- forest; (ii) the spectral regions within km.s-1 of the Mg ii emission line for a given background quasar, as any such absorbing clouds are generally thought to have a high probability of being associated with the quasar; (iii) the spectral regions polluted by the various known atmospheric absorption features. This was somewhat complicated, since some spectra were more affected by telluric lines than the others. Simply excluding these regions equally from each quasar spectrum would have led to an unnecessarily excessive exclusion out of the available redshift path-length coverage. Therefore, we have only excluded the obvious cases of blending revealed by a visual inspection of each Mg ii system candidate picked by our automated algorithm. In addition, the uncertainty arising from very noisy spectral segments was minimized by demanding that the average SNR per pixel averaged over a 121-pixel box centered on the pixel in question, be 5 and the member of the stronger component of the Mg ii absorption doublet is detectable above the designated threshold (which is 1.0Å for strong systems) at more than level (e.g see also, Lawther et al., 2012). Here, is determined by integrating the noise spectrum over a resolution element() around each pixel. For the 1358 spectra in our CDQ sample and 342 spectra in our LDQ sample, the SNR in their entire spectral range was found to be below this desired SNR threshold of 5 (averaged over a 121-pixel box) and hence they were dropped out from our subsequent analysis. This leads to a final sample of 3975 CDQs and 1583 LDQs having 640 and 224 strong Mg ii absorbers, respectively.
We have taken the form of redshift path density , which at any given redshift is the path in the redshift space available to search for Mg ii systems in our data sample, as
| (1) |
Where, is the Heaviside step function, correspond to the minimum and maximum Mg ii absorption redshifts allowed by the spectral range considered for our search of Mg ii doublet and is lower detection limit on at level allowed by the SNR per resolution element of the spectrum. In Figure 1 we plot Å available at minimum of detection significance, for our sample of 3975 CDQs and 1583 LDQs. The redshift path, , for our sample between redshift is then given by
| (2) |
The number density of absorbers per unit redshift is , where is the number of the Mg ii absorption systems with , detected over the redshift path at a significance level. Using this formalism, we find for our sample of 3975 CDQs:
| (3) |
with mean value of the redshift path being . For the sightlines towards our sample of 1583 LDQs, we similarly find:
| (4) |
with a mean value of the redshift path being . Here, the errors on correspond to 1 confidence level, and are computed using the standard Poisson statistics. However, for (small number statistics), e.g., in the subsequent analysis (Section 4), errors will be computed using the limits corresponding to 1 confidence level of a Gaussian distribution, as tabulated by Gehrels (1986). Using Eq. 3 and Eq. 4 one can compute the ratio (excess factor) of values for strong Mg ii absorber between CDQ and LDQ sightlines, as
| (5) |
which is found to differ only at a 1.3 level.
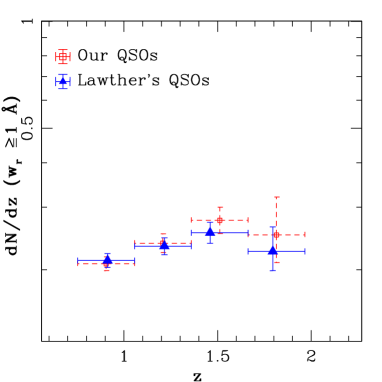
As a check on our analysis procedure, we have tested our method of estimation with the recent result reported in Lawther et al. (2012) catalog, using their redshift path information for each sightline (priv. comm. with Dr. D. Lawther). For this we have derived a subset of 3366 normal quasars from the QSO catalog of Lawther et al. (2012), members of which are closely matched in emission redshift and bolometric luminosity with members of our CDQ sample. By downloading their spectra from the SDSS, we have computed for Mg ii strong absorbers, following the analysis procedure described above and then compared it with that obtained using the results provided in Lawther et al. (2012) catalog. A very good statistical agreement is found between the two estimates of , with a -test giving (e.g., see Figure 3), validating our analysis procedure.
4 Results
4.1 Comparison of for CDQs and LDQs versus normal QSOs
We now compare the incidence rate of strong Mg ii absorbers found here along the CDQ and LDQ sightlines with that known for the sightlines towards normal quasars (QSOs). For this, we have computed the number per unit redshift towards QSOs, using the analytical fit recently published by Zhu & Ménard (2013). The fit is based on their analysis of the Mg ii absorbers towards QSOs in the SDSS-DR7, where they have defined the incidence rate of Mg ii absorbers in a given range of rest-frame equivalent width as:
| (6) |
where
| (7) |
and
in which , , , , , and with their best-fit values are as listed in their Table 2. The values we have used here for , are 1.0Å and 5.0Å , respectively.
To begin with, we computed the expected number of strong Mg ii absorbers for the QSO sightlines () corresponding to the same redshift path as available for the CDQs/LDQs sightlines, by multiplying Eq. 6 with the total redshift path for the CDQs/LDQs. These are found to be N and , corresponding to the total redshift paths towards the CDQs and LDQs, respectively. As a result the expected towards normal QSOs corresponding to the total redshift paths towards the CDQs and LDQs are found, respectively, as
| (8) |
| (9) |
These expected towards normal QSOs along with the use of Eq. 3 and Eq. 4 for towards CDQ/LDQ, give the ratios (excess factors) for strong Mg ii absorbers as:
| (10) |
| (11) |
Thus, we detect only a marginally significant () excess of ‘intervening’ strong Mg ii absorbers towards CDQ versus QSO sightlines. Although in Paper I, no statistically significant excess was detected for CDQs, this implies no real contradiction, in view of about 35 times smaller CDQ sample available in Paper I. The same explanation probably holds for the non-detection by Ellison et al. (2004) who used an even smaller sample of CDQs.
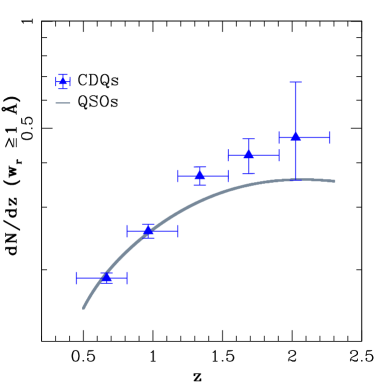
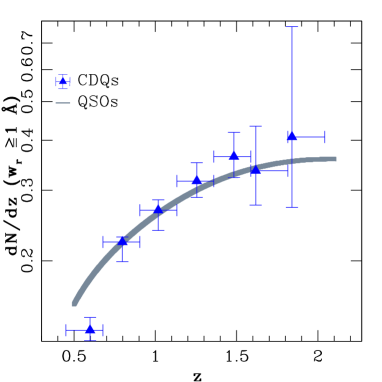
. The horizontal bars indicate the velocity bins and vertical bars the uncertainty from counting statistics.
In Figure 4, we have displayed for different redshift bins, the values of determined for ‘intervening’ strong Mg ii absorption systems towards CDQs and then compared them with the analytical fit taken from Zhu & Ménard (2013) for normal QSOs. The null hypothesis that the two distributions are statistically indistinguishable is ruled out by a -test, for the CDQ versus QSO sightlines, at . This is further discussed in Section 5.
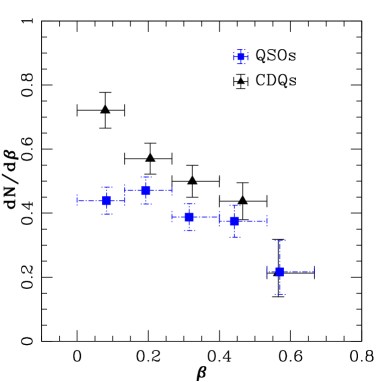
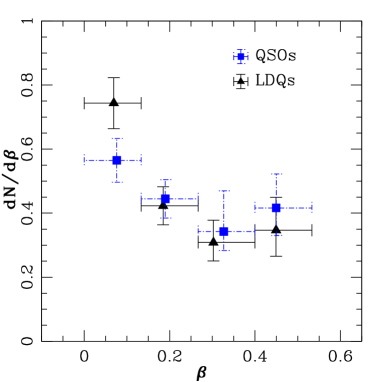
4.2 The distribution of offset velocity (v) for ‘intervening’ strong Mg ii absorbers
To probe further the marginal excess of found here towards CDQs vis a vis QSOs, we now compute the distribution of offset velocity, , of the strong Mg ii absorption systems (observed at ), relative to the background quasar (), where is given by BBM,
| (12) |
Note that in Paper I, the excess of strong Mg ii absorption systems reported for blazars was concentrated towards the lower end of distribution (, see also BBM). The excess was attributed to acceleration of the absorbing gas clouds by the powerful blazar jets pointed close to our direction. For a meaningful check on this idea we need to derive a subset from our CDQ sample so that of each selected CDQ is such that its SDSS spectral coverage is continuous at least out to about km.s-1 blueward of its , thus allowing the possibility of detecting any associated absorber masquerading as intervening absorber due to an unusually high offset velocity , relative to the quasar. This requirement, together with the fact that Å and Å are the conservative lower and upper observed wavelength limits in the SDSS spectra, constrains us to adopt the range of between 0.62 and 2.2. This redshift range contains 2919 of the CDQs and 1339 LDQs from our sample, in all showing 473 and 190 ‘intervening’ strong Mg ii absorbers, respectively. For comparison purpose, we have also constructed a subset of normal QSOs, via an emission redshift matching with each member of the CDQ subset, taking a redshift matching tolerance of 0.003. In addition, we impose a similar constraint on luminosity matching, taking a matching tolerance of 0.01, to account for the known correlation between bolometric luminosity () and redshift in flux limited surveys like SDSS (e.g., see Sharma et al., 2013). As these CDQ and QSO subsets are both derived from the SDSS, the observed wavelength window is common for them. This automatically ensures that the observable range of the relative velocity (i.e., offset velocity, ) detectable in the optical spectrum is quite similar for both subsets and an unbiased comparison of the distributions is thus possible for them.
The incidence of absorbers as a function of velocity, with , for the CDQQSO and LDQQSO subsets matched in emission redshift and bolometric luminosity are shown in Figure 5. At velocity offset, , an excess in the distribution can be seen for the CDQs compared to the normal quasars, while for LDQs the distribution is similar to that for the normal quasars. The null hypothesis that the two distributions are statistically indistinguishable is ruled out by a -test, for the CDQ versus QSO and LDQ versus QSO sightlines, at , levels, respectively. It is noteworthy that the excess seen for CDQs comes primarily from the low- range (0.05-0.1).
5 Discussion
The intriguing possibility of of strong Mg ii absorbers being dependent on the type of background source has been raised in recent literature (Section 1). Here we have extended those investigations using two samples of radio-loud quasars, one showing a core-dominated radio morphology (3975 sightlines) and the other consisting of lobe-dominated quasars (1583 sightlines). These two samples are not only well defined, but are also very similar in terms of redshift path distribution and wavelength coverage (since all the spectra are taken from the SDSS), which renders them highly suitable for the purpose of comparison.
Our analysis firstly shows that for ‘intervening’ strong Mg ii absorption systems display a small excess of about 9% () for CDQs in comparison to a redshift-matched sample of optically selected QSOs (Section 4.1). Potential biases considered to explain this marginal excess are extinction due to dust within the absorbers (which would lower the towards QSOs) and gravitational lensing amplification of the background optical continuum, which could enhance towards CDQs/blazars (see Section 1). Recently, BBM have estimated that both these phenomena are unlikely to noticeably influence the counts of strong Mg ii absorption systems towards blazar sightlines. As a more plausible alternative, they have attributed the observed excess of Mg ii absorbers towards blazars (in comparison to QSOs) to absorbing gas clouds swept up by the powerful blazar jets and accelerated to mildly relativistic speeds (also, Wild et al., 2008; Krause, 2002). BBM have estimated that for reasonable values of jet power and ambient gas density, a column of cool gas as large as can be swept up and accelerated to velocities of up to 0.2c, if not higher. This is consistent with the result presented in Paper I where a hint was presented for strong Mg ii absorption systems to be accelerated by blazar jets up to 0.15c.
Compared to blazars, the jets in CDQs and LDQs, are progressively less well aligned from the line-of-sight (e.g. Antonucci, 2012; Barthel, 1999; Urry & Padovani, 1995). This is in accord with the present work which has revealed a mild ( 9%) excess of strong Mg ii absorbers towards CDQs, relative to QSOs, and no excess towards LDQs. More specifically, the distribution of shown in Figure 5 has revealed for CDQs a significant excess at offset velocities around , while comparing with QSO. The null hypothesis that their distributions are identical is ruled out at level using the -test (see Section 4.2) Thus, the results of this study and Paper I are both consistent with the proposal that cool gas clouds capable of producing strong Mg ii absorption can be accelerated by the jets of powerful AGN and/or due to the accretion-disk outflows, even up to mildly relativistic speeds i.e., several times more than the canonical limit of km.s-1 adopted in the literature for associated absorbers. This underscores the importance of a more realistic numerical modelling of the interaction of collimated outflows from the nuclei of quasars/blazars, particularly their jets with the ambient medium (see also, BBM).
Finally, we examine the implication of this inference for estimating the cosmological evolution of the purely intervening strong Mg ii absorbers, by repeating the analysis of Section 4.1 after excluding all redshift paths corresponding to . The result of this analysis are shown in Figure 6 (which is a refined version of Figure 4). The distributions for CDQs and QSOs now appear quite similar (a -test shows that the difference is significant only at level), as indeed is expected for bona-fide intervening absorbers. In contrast, it may be recalled that by setting the offset velocity exclusion limit at the conventional value of km.s-1, a excess of was found for CDQs around the redshift range (Figure 4). This again goes to support the inference that associated strong Mg ii systems may well occur at velocity offsets that are an order-of-magnitude larger than the conventionally adopted limit of km.s-1. This may have interesting physical interpretation such as what fraction of CDQs have cool gas outflows (e.g., see Nestor et al., 2008) as outlined below.
From the excess of seen for CDQs compared to QSOs at low values (Figure 5), we can compute the fraction of strong Mg ii absorber within (i.e., ) that are likely to be associated with CDQs itself, similar to the C iv outflow fraction analysis by Nestor et al. (2008). For this purpose we take intervening Mg ii absorbers seen towards normal quasars within as the model for intervening absorbers for our CDQ sightlines (e.g., see Figure 5). Using this model we have then computed the excess fraction of strong Mg ii absorbers from their observed values towards the CDQ sightlines (e.g., see Figure 5) and found this excess fraction to be for CDQs. We further note that strong Mg ii absorbers were actually contributed by just 5% of the sightlines out of the total CDQ sightlines we searched for strong Mg ii absorber within range. Further, these strong Mg ii absorber consist of associated absorbers, e.g., cool gas outflows (accounting for the excess fraction of for CDQs) plus truly intervening absorber (like those detected in normal QSOs). Therefore, the fraction of CDQs having cool gas outflowing along our direction is 1.5% obtained by multiplying the fraction 0.05 of CDQs showing strong Mg ii absorbers with the excess fraction of strong Mg ii absorbers that are likely to be associated with the CDQs.
Further, if we make a loose assumption that all CDQs have outflow, then our above result of 1.5% sightlines having cool gas outflows along our direction suggest that about cone angle is covered by such cool outflowing gas. However, more likely, the axes of CDQs are not randomly orientated but lie within, say from the line of sight (e.g., Antonucci, 2012), as a result the above cone angle of the cool gas outflows decreases from to .
6 Conclusions
Our analysis of large and well-matched samples of 1583 LDQs and 3975 CDQs, covering a redshift range 0.3894.922 for the LDQs and 0.3894.821 for the CDQs, has led to the following conclusions:
-
1.
of ‘intervening’ strong Mg ii absorbers towards CDQs shows a marginal excess over the value known for normal quasars (QSOs), at a level of about with confidence. No significant excess is detected for LDQs.
-
2.
In the redshift dependence of of strong Mg ii absorbers towards CDQs versus normal QSOs, a excess is detected for CDQs over a narrow redshift interval . However, this excess vanishes when we exclude the absorbers within redshift path corresponding to velocity offsets of up to 0.2c relative to the background source (see below).
-
3.
The distribution for the redshift and bolometric luminosity matched subsets of CDQs and QSOs are found to differ, using the test, at 3.75 level. This difference appears to be due to the excess seen in the distribution up to , for CDQs.
-
4.
The noticeable excess found for CDQs at , over the matched sample of QSOs, as well as the mild overall excess of found for CDQs, can both find a plausible explanation within a scenario where a significant fraction of the absorbers seen towards CDQs (and blazars) with offset velocities, , of up to 0.1c might be accelerated by their powerful jets and/or due to the accretion-disk outflows. This velocity limit, initially hinted in Paper I and BBM, is several times the canonically adopted limit of km.s-1 for associated absorbers.
Acknowledgments
We thank an anonymous referee for the constructive criticism and helpful suggestions. We are also grateful to Dr. D. Lawther for supplying the redshift path data.
G-K is supported by a NASI Senior Scientist Platinum Jubilee fellowship.
Funding for the SDSS and SDSS-II has been provided by the Alfred P. Sloan Foundation, the Participating Institutions, the National Science Foundation, the U.S. Department of Energy, the National Aeronautics and Space Administration, the Japanese Monbukagakusho, the Max Planck Society, and the Higher Education Funding Council for England. The SDSS Web Site is http://www.sdss.org/. The SDSS is managed by the Astrophysical Research Consortium for the Participating Institutions. The Participating Institutions are the American Museum of Natural History, Astrophysical Institute Potsdam, University of Basel, University of Cambridge, Case Western Reserve University, University of Chicago, Drexel University, Fermilab, the Institute for Advanced Study, the Japan Participation Group, Johns Hopkins University, the Joint Institute for Nuclear Astrophysics, the Kavli Institute for Particle Astrophysics and Cosmology, the Korean Scientist Group, the Chinese Academy of Sciences (LAMOST), Los Alamos National Laboratory, the Max-Planck-Institute for Astronomy (MPIA), the Max-Planck-Institute for Astrophysics (MPA), New Mexico State University, Ohio State University, University of Pittsburgh, University of Portsmouth, Princeton University, the United States Naval Observatory, and the University of Washington.
References
- Abazajian et al. (2009) Abazajian K. N. et al., 2009, ApJS, 182, 543
- Antonucci (2012) Antonucci R., 2012, Astronomical and Astrophysical Transactions, 27, 557
- Bahcall (1980) Bahcall J. N., 1980, in Scientific Research with the Space Telescope, Longair M. S., Warner J. W., eds., pp. 215–240
- Bahcall & Salpeter (1966) Bahcall J. N., Salpeter E. E., 1966, ApJ, 144, 847
- Barthel (1999) Barthel P., 1999, in Astronomical Society of the Pacific Conference Series, Vol. 162, Quasars and Cosmology, Ferland G., Baldwin J., eds., p. 127
- Becker et al. (1995) Becker R. H., White R. L., Helfand D. J., 1995, ApJ, 450, 559
- Bergeron et al. (2011) Bergeron J., Boissé P., Ménard B., 2011, A&A, 525, A51
- Bergeron & Stasińska (1986) Bergeron J., Stasińska G., 1986, A&A, 169, 1
- Chand & Gopal-Krishna (2012) Chand H., Gopal-Krishna, 2012, ApJ, 754, 38
- Chen & Tinker (2008) Chen H.-W., Tinker J. L., 2008, ApJ, 687, 745
- Churchill et al. (2005) Churchill C. W., Kacprzak G. G., Steidel C. C., 2005, in IAU Colloq. 199: Probing Galaxies through Quasar Absorption Lines, Williams P., Shu C.-G., Menard B., eds., pp. 24–41
- Churchill et al. (1999) Churchill C. W., Rigby J. R., Charlton J. C., Vogt S. S., 1999, ApJS, 120, 51
- Ellison et al. (2004) Ellison S. L., Churchill C. W., Rix S. A., Pettini M., 2004, ApJ, 615, 118
- Frank et al. (2007) Frank S., Bentz M. C., Stanek K. Z., Mathur S., Dietrich M., Peterson B. M., Atlee D. W., 2007, Ap&SS, 312, 325
- Gehrels (1986) Gehrels N., 1986, ApJ, 303, 336
- Hao et al. (2007) Hao H. et al., 2007, ApJ, 659, L99
- Hewett & Wild (2010) Hewett P. C., Wild V., 2010, VizieR Online Data Catalog, 740, 52302
- Jiang et al. (2007) Jiang L., Fan X., Ivezić Ž., Richards G. T., Schneider D. P., Strauss M. A., Kelly B. C., 2007, ApJ, 656, 680
- Kacprzak et al. (2008) Kacprzak G. G., Churchill C. W., Steidel C. C., Murphy M. T., 2008, AJ, 135, 922
- Kellermann et al. (1989) Kellermann K. I., Sramek R., Schmidt M., Shaffer D. B., Green R., 1989, AJ, 98, 1195
- Krause (2002) Krause M., 2002, A&A, 386, L1
- Kulkarni et al. (2012) Kulkarni V. P., Meiring J., Som D., Péroux C., York D. G., Khare P., Lauroesch J. T., 2012, ApJ, 749, 176
- Lawther et al. (2012) Lawther D., Paarup T., Schmidt M., Vestergaard M., Hjorth J., Malesani D., 2012, A&A, 546, A67
- Ménard et al. (2008) Ménard B., Nestor D., Turnshek D., Quider A., Richards G., Chelouche D., Rao S., 2008, MNRAS, 385, 1053
- Narayanan et al. (2007) Narayanan A., Misawa T., Charlton J. C., Kim T.-S., 2007, ApJ, 660, 1093
- Nestor et al. (2008) Nestor D., Hamann F., Rodriguez Hidalgo P., 2008, MNRAS, 386, 2055
- Prochter et al. (2006) Prochter G. E., Prochaska J. X., Burles S. M., 2006, ApJ, 639, 766
- Schneider et al. (2010) Schneider D. P. et al., 2010, VizieR Online Data Catalog, 7260, 0
- Sharma et al. (2013) Sharma M., Nath B. B., Chand H., 2013, MNRAS, 431, L93
- Shen et al. (2011) Shen Y. et al., 2011, ApJS, 194, 45
- Steidel (1995) Steidel C. C., 1995, in QSO Absorption Lines, Meylan G., ed., p. 139
- Urry & Padovani (1995) Urry C. M., Padovani P., 1995, PASP, 107, 803
- Véron-Cetty & Véron (2010) Véron-Cetty M.-P., Véron P., 2010, A&A, 518, A10
- Wild et al. (2008) Wild V. et al., 2008, MNRAS, 388, 227
- Wolfe et al. (2005) Wolfe A. M., Gawiser E., Prochaska J. X., 2005, ARA&A, 43, 861
- York et al. (2000) York D. G. et al., 2000, AJ, 120, 1579
- Zhu & Ménard (2013) Zhu G., Ménard B., 2013, ApJ, 770, 130
- Zibetti et al. (2007) Zibetti S., Ménard B., Nestor D. B., Quider A. M., Rao S. M., Turnshek D. A., 2007, ApJ, 658, 161