Small Scale Microwave Bursts in Long-duration Solar Flares
Abstract
Solar small scale microwave bursts (SMBs), including microwave dot, spike, and narrow band type III bursts, are characterized with very short timescales, narrow frequency bandwidth, and very high brightness temperatures. Based on observations of the Chinese Solar Broadband Radio Spectrometer at Huairou with superhigh cadence and frequency resolution, this work presents an intensive investigation of SMBs in several flares occurred in active region NOAA 10720 during 2005 Jan 14-21. Especially long-duration flares, SMBs occurred not only in early rising and impulsive phase, but also in the flare decay phase, and even in time of after the flare ending. These SMBs are strong bursts with inferred brightness temperature at least - 1.92 K, very short lifetime of 5-18 ms, relative frequency bandwidths of 0.7-3.5%, and superhigh frequency drifting rates. Together with their obviously different polarizations from the background emission (the quiet Sun, and the underlying flaring broadband continuum), such SMBs should be individual independent strong coherent bursts which is related to some non-thermal energy releasing and production of energetic particles in small scale source region. These facts show the existence of small scale strong non-thermal energy releasing activities after the flare maxima, which is meaningful to the prediction of space weather. Physical analysis indicates that plasma mechanism may be the most favorable candidate for the formation of SMBs. From plasma mechanism, the velocities and kinetic energy of fast electrons can be deduced, and the region of electron acceleration can also be tracked.
1 Introduction
In solar broadband spectral observations at microwave frequency range, especially at decimeter and centimeter wavelength, it has been known for a long time that there are many isolated short-timescale strong bursts, such as microwave spike bursts (Benz, 1986; Huang & Nakajima, 2005; Rozhansky et al, 2008; Debrowski et al, 2011), dot bursts (Karishan et al. 2003), and narrow bandwidth type III bursts (Huang & Tan, 2012) occurred frequently associated with solar flares. The main features of these bursts include very short timescales (lifetime s), very narrow frequency bandwidth (relative bandwidth ), very high brightness temperatures (), and always occurred in great clusters. Practically, there are always no obviously differences among these three types of bursts, we may call them by a joint name as solar small scale microwave bursts (SMBs), which possibly associates with similar strong non-thermal energy releasing processes. SMBs are always superposed on the underlying broadband flaring continuum emission (Malville, Aller, & Jensen, 1967, etc) and frequently occurred in the rising and maximum phases of solar impulsive flares (Beaz, 1986, Csillaghy & Benz, 1993, etc). However, recent observations indicate that they also occurred in flare decay phase and even after the flare ending (Benz et al, 2002; Huang & Tan, 2012).
The obvious differences of SMBs from the underlying broadband flaring continuum emissions indicate that they may have entirely different generation mechanisms. Actually, SMBs are possibly related to some strong non-thermal processes with very short timescale and very small size of flaring magnetic energy release region. Possibly, these processes may be elementary in solar flares, which should be fragmented (Benz, 1985; Messmer & Benz, 2000). However, so far, there is no perfect model to explain the formation of flaring fragmentation and the generation of SMBs. As for the source locations of SMBs, there are two different viewpoints of theories. The electron cyclotron maser emission mechanism (ECME) predicted that the SMB emission would be expected to originate from some loss-cone instabilities in some regions close to the footpoints of magnetic loop with strong magnetic field: (Melrose & Dulk 1982). Here, is electron gyro-frequency and is electron plasma frequency. In other theories, SMBs are proposed to produce from acceleration processes and therefore would be expected to originate in the location of acceleration sites. Tan & Tan (2012) found that each pulse of a microwave quasi-periodic pulsation at frequency of 2.60-3.80 GHz is composed of a group of SMBs, and the concomitant zebra pattern indicates that the corresponding magnetic field strength is only 147-210 Gs, which is too weak to meet the ECME conditions. Therefore, they proposed that SMBs are triggered by plasma emission, another coherent emission mechanism, which is triggered by Langmuir turbulence produced from non-thermal energetic electrons (Zheleznyakov & Zlotnik 1975; Chernov et al. 2003). In this case, the formation of SMBs is closely related to electron accelerations and the evolution of plasma instability. Benz et al. (2002) find that decimetric spikes are single source occurred in the flare decay phase and located about 20-400′′ away from the flare site in hard X-ray and soft X-ray bursts. This fact indicates that the decimetric spikes are questionable to related with the main flare electron acceleration, but possibly with some coronal post-flare acceleration processes. Therefore, the much more detailed investigation of SMBs will give insight into the elementary processes taking place in flaring regions, and reveal the intrinsic properties of accelerations of non-thermal particles.
In order to recognize SMBs clearly, telescopes need enough high spectral resolutions and high cadence. Gudel-Benz law indicates that the lifetime of SMBs is largely a function of emission frequency in frequency range 237-2695 MHz: (Gudel & Benz, 1990). This law predicts that the lifetime around 1.20 GHz is about 12 ms. Csillaghy & Benz (1993) found that bandwidth of individual SMB is also a function of emission frequency: , which implies the frequency bandwidth about 13 MHz at frequency around 1.20 GHz. The Chinese Solar Broadband Radio Spectrometer in Huairou (SBRS/Huairou) at 1.10-1.34 GHz has a cadence of 1.25 ms and spectral resolution of 4 MHz. It is sufficient to recognize SMBs occurred in the corresponding frequency range.
This work presents a comprehensive investigation of SMBs by using the broadband spectral observations obtained by SBRS/Huairou in several solar flares occurred in active region NOAA 10720 during 2005 January 15-20. A large number of SMBs are registered in these flares. Section 2 introduces the observation data and the main properties and evolutionary characteristics of SMBs in these flares. Section 3 presents a physical discussion on the above results, and finally, some conclusions are summarized in Section 4.
2 Observations and Analysis
2.1 The Flare Events
The solar active region NOAA 10720 is a flare-productive and most impressive one on the solar visible disk in January of 2005. It appeared on the solar disk as a simple beta type magnetic region on Jan. 10, grew rapidly and fully developed on Jan 15, ended as a complex sunspot region on Jan. 23. There are 5 X-class flares, 17 M-class flares, and more than 60 C-class flares produced in this active region and recorded by GOES satellites during its 14 days track across the solar disk (from 2005 January 10 to January 23). Cheng et al. (2011) investigated the properties of these flares and their relationships to coronal mass ejections (CME). Zhao & Wang (2006) investigated the non-potentiality and free energy transportation in this active region.
| Date | Flare | start(UT) | peak(UT) | end(UT) | Duration(min) | GOES Class | NorP | ||
|---|---|---|---|---|---|---|---|---|---|
| Jan15 | E1 | 00:22 | 00:43 | 01:02 | 40 | X1.2 | 90 | Yes | |
| E2 | 03:16 | 03:40 | 03:57 | 41 | C4.2 | 0 | No | ||
| E3 | 04:09 | 04:16 | 04:22 | 13 | M1.3 | 0 | No | ||
| E4 | 04:26 | 04:31 | 04:36 | 10 | M8.4 | 0 | Yes | ||
| E5 | 05:54 | 06:37 | 07:17 | 83 | M8.6 | 6000 | Yes | ||
| Jan17 | E6 | 03:10 | 03:21 | 03:32 | 22 | M2.6 | 0 | Yes | |
| Jan18 | E7 | 00:37 | 00:44 | 00:51 | 14 | C6.0 | 0 | No | |
| E8 | 02:06 | 02:12 | 02:17 | 11 | C3.2 | 0 | No | ||
| Jan19 | E9 | 05:10 | 05:26 | 05:35 | 25 | C7.2 | 0 | No | |
| E10 | 06:58 | 07:31 | 07:55 | 57 | M6.7 | 45 | No | ||
| E11 | 08:03 | 08:22 | 08:40 | 37 | X1.3 | 92 | No | ||
| Jan20 | E12 | 03:21 | 03:30 | 03:36 | 15 | C4.8 | 17 | Yes | |
| E13 | 06:36 | 07:01 | 07:26 | 50 | X7.1 | 12600 | Yes |
Note. — is the total number of SMBs occurred in each flare at frequency of 1.10-1.34 GHz. The last column indicates whether or not complete observations by Nobeyama Radio Polarimeters (NorP).
SBRS/Huairou observed 13 events perfectly at frequency of 1.10-1.34 GHz and 2.60-3.80 GHz around the occurrence of the active region NOAA 10720 during 2005 January 14-21, including 3 X-class flares, 5 M-class flares, and 5 C-class flares. Table 1 listed the main parameters of these 13 flare events. There are 3 events belonging to long-duration flares (duration 50 min) including 2 M-class flares (E5, E10) and 1 X7.1 flare (E13); 7 events belong to short-duration (duration 30 min) including 3 M-class flares (E3, E4, E6) and 4 C-class flares (E7, E8, E9, E12). Cheng et al (2011) reported that E1 (X1.2 flare), E4 (M8.4 flare) and E6 (M2.6 flare) are confined flares without CMEs, while the long-duration events E5, E10, and E13 are impulsive flare with strong CMEs.
2.2 Observation Data
Here, the observation data is obtained by SBRS/Huairou, which is a group of advanced high-performance solar radio spectrometers with high cadence, broad frequency bandwidth, and high frequency resolution (Fu et al. 1995, 2004, Yan et al. 2002). SBRS/Huairou includes 3 parts: 1.10 - 2.06 GHz (the antenna diameter is 7.0 m, cadence is 5 ms, frequency resolution is 4 MHz. When it works at 1.10-1.34 GHz, the cadence is 1.25 ms), 2.60 - 3.80 GHz (the antenna diameter is 3.2 m, cadence is 8 ms, frequency resolution is 10 MHz), and 5.20 - 7.60 GHz (share the same antenna of the second part, cadence is 5 ms, frequency resolution is 20 MHz). Antennae point to the center of solar disk automatically controlled by computers. The spectrometer can receive the total flux of solar radio emission with dual circular polarization (left- and right-handed circular polarization, LCP and RCP), and the dynamic range is 10 dB above quiet solar background emission. The observation sensitivity is: , here is the standard flux of the quiet Sun. From the Solar Geophysical Data (SGD) we can obtain at frequencies of 610 MHz, 1415 MHz, 2695 MHz, 2800 MHz, and 4995 MHz, and make the calibration of the observational data followed the method reported by Tanaka et al. (1973). As for the strong burst, the receiver may work beyond its linear range and a nonlinear calibration method is replaced (Yan et al. 2002). Similar to other congeneric instruments, such as Phoenix (100 - 4000 MHz, Benz et al. 1991), Ondŕejov (800 - 4500 MHz, Jiricka et al. 1993) and Brazilian Broadband Spectrometer (BBS, 200 - 2500 MHz, Sawant et al. 2001), SBRS/Huairou has no spatial resolution. However, as the Sun is a strong radio emission source, a great deal of works (e.g. Dulk 1985, etc.) indicate that the microwave bursts received by spectrometers are always coming from the solar active region when the antenna points to the Sun. A specialized software based on IDL program has also been developed for analyzing the spectrograms, which can display the spectral fine structures clearly. In order to corroborate the results obtained by SBRS/Huairou, we also scrutinize the observation data obtained by Nobeyama Radio Polarimeters (NorP). We found that NorP also got the completed observations during the several interesting flare events, such as E1, E4, E5, E6, E12, and E13. This work focused on studying these flare events.
In order to present a receivable statistical analysis of SMBs, it is necessary to confirm practical definitions of parameters for describing SMBs. Here we follow the definitions mainly from Tarnstrom & Philip (1972) to obtain the parameters.
(1) Burst strength (): defined as the maximum emission intensity subtracting the background emission intensity before and after the corresponding SMB. A flux enhancement which exceeds obviously to the quiet Sun emission may be regarded as a microwave burst. An universal accepted criterion is 5, here is the standard deviation of the background emission, when a flux enhancement exceeds respect to the background emission, we may say it is an isolated burst event. For example, From the SGD record during 2005 Jan 15-20, we may get the standard flux value of the quiet Sun sfu at frequency of 1.10 - 1.34 GHz. The corresponding sensitivity is about sfu.
Because the signal of SMB is much shorter timescale and much narrower bandwidth than that of the underlying flare continuum emission, it is easily affected by other factors, such as the instrument perturbations. Here we adopt the similar criteria of high energy physical experiments of 5 sigma to show a real observation result (3-5 sigma to show an evidence, and sigma only reflects a hint or clue). Naturally, this criteria will leave out some SMBs with relatively weak intensities. However, such high criteria can help us to avoid the influence of other factors and increase the confidence level of our analysis.
(2) Lifetime (): can be measured from time interval of the SMB temporal profile with half maximum of emission intensity.
(3) Frequency bandwidth (): can be measured from frequency width of the SMB spectral profile with half emission intensity maximum.
In the above three parameters, the key step is to determine the time or frequency at the maximum value and the half maximum value. Here we use an IDL GAUSSFIT function fitting method to compute the non-linear least-squares fit to a function as:
.
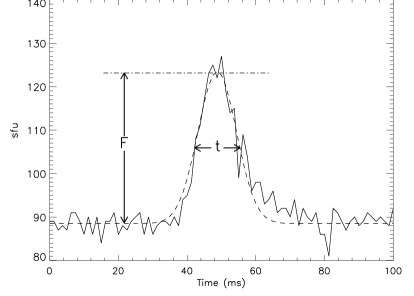
Then, the burst intensity is , the averaged emission intensity of the background is , the time of maximum intensity is at , and SMB lifetime is . The left panel of Fig.1 is an example of this method applying to the temporal profile of an SMB. Here, the burst strength sfu, lifetime ms.
As the averaged emission intensity of the background is increasing with frequency, we may use another function to fit the spectral profile of SMB:
.
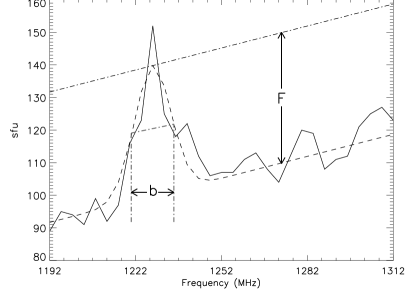
Here, is the emission frequency, presents the averaged emission intensity of the background at different frequencies. The frequency bandwidth of SMB can be obtained . The right panel of Fig.1 is an example applying to the spectral profile of an SMB. Here, the frequency bandwidth of SMB is MHz.
Sometimes, SMBs become so crowded that we can’t distinguish them with each other. In order to make the result believable, here we only analyze the isolated SMBs, while neglect the crowded SMBs which can not be distinguished from each other clearly. The isolated SMB is defined as: the quench time between two SMBs is longer than its lifetime, and the frequency gap between two SMBs is wider than its frequency bandwidth.
(4) Frequency drifting rate (): defined as the slope of SMB on the time-frequency plane.
(5) Polarization degree, . Here, and are burst strength of SMB at LCP and RCP which subtract the background emissions, respectively. indicates the left polarization, and indicates the right polarization.
(6) SMB occurrence rate (), because almost all SMB in this work are occurred only at frequency 1.10-1.34 GHz, therefore we define as the number of SMBs per second at frequency of 1.10-1.34 GHz.
Table 1 lists the solar flares observed by SBRS/Huairou in NOAA 10720 during 2005 Jan 14-21. The following sections present the comprehensive analyzing results based on the above definitions.
2.3 Analysis Results
From the observation of SBRS/Huairou at frequency 1.10-1.34 GHz and 2.60-3.80 GHz, we found that:
(1) There are 6 flares occurring isolated SMBs, and all isolated SMBs only appeared at frequency of 1.10-1.34 GHz. The observations at frequency of 2.60-3.80 GHz obtained by SBRS/Huairou were also inspected carefully, and found that there were no SMBs occurred in the above flares, except some quasi-periodic pulsations (in E4, E5, E9, and E11) and zebra pattern structures (E1 and E5 on Jan. 15). This fact imply that all SMBs occurred only in the frequency band below 2.60 GHz in the active region NOAA 10720, which is different from other cases, such as the flare occurred in active region NOAA 10930 on 2006-12-13 (Wang, et al. 2008).
(2) The 8th column of Table 1 listed the number of isolated SMBs occurring in each flare at frequency of 1.10-1.34 GHz. Here, we find that different flare has different manifestations of SMBs: (a) the most abundant SMBs are occurred in two long-duration flares: E5, an M8.6 flare occurred on 2005-01-15 with duration of 83 min and about 6000 SMBs at frequency 1.10-1.34 GHz; and E13, an X7.1 flare occurred on 2005-01-20 with duration of 50 min and about 12600 SMBs; (b) some sporadic SMBs occurred in other 4 flares, including E1, E10, E11, and E12; (c) the short-duration flares tend to be lack of SMBs, such as E2, E3, E4, E6, E7, E8, and E9.
The following paragraphs present the detailed properties of SMBs appeared in these flares.
2.3.1 Abundant SMBs in a long-duration M8.6 flare on 2005-01-15
The GOES soft X-ray emission indicates that the M8.6 flare starts at 05:54 UT, reaches to maximum at 06:37 UT, and ends at 07:17 UT on 2005-01-15 with duration of 83 min. It is a long-duration flare accompanying with a powerful CME with speed up to more than 2000 km/s and abundant SMBs. SMBs appear not only in the early rising and impulsive peak phases of the flare, but also occur in the flare decay phase. Fig.2 presents two segments of SMBs which occurred in the rising and decay phase of the long-duration M8.6 flare (E5) on 2005-01-15, respectively. The left panels show a segment spectrograms of SMBs during 06:02:05.0 - o6:02:06.0 UT in the flare rising phase with LCP (left-upper) and RCP (left-bottom). The bright small patches represent SMBs which show very strong left polarization, and distribute randomly. The frequency bandwidth of individual SMB is in the range of 8-32 MHz, and the lifetime is about 5-21 ms. As a comparison, the quench time between each adjacent two SMBs is in the range of 50 - 100 ms which is much longer than SMB lifetime. The frequency gap between each adjacent two SMBs is in the range of 24-64 MHz, which is wider than the frequency bandwidth of each individual SMB. The right panels of Fig.2 presents another segment of SMBs during 06:38:22.0 - 06:38:23.0 UT in the flare decay phase. It shows that almost all SMBs are appeared in RCP with strong polarization. Most of the lifetimes are shorter and the frequency bandwidths are narrower than that occurred in the flare rising phase. In both of the above two cases, the frequency drifting rates of some SMBs can be measured, and the values of are in range of 1500 - 6000 MHz/s. At the same time, most of SMBs behavior as perpendicular to the time axis that we cannot detect their . Possibly this is because of their high frequency drifting rates that we can not detect them for restrictions of limited spectral and temporal resolutions. For example, when the bandwidth is 12 MHz, the detectable maximum is 9600 MHz/s for the cadence 1.25 ms, etc.
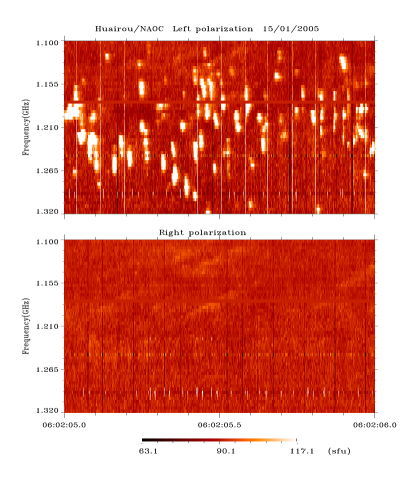
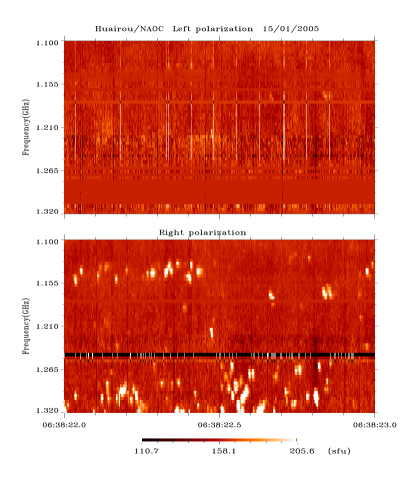
Fig.3 presents the temporal profiles of emission intensities of two segments of SMBs with LCP and RCP, respectively. As a comparison, the emission intensity of the quiet Sun recorded during 05:45:00.0-05:45:00.6 UT (before the onset of the flare) is also over-plotted on the same figure. It is obvious that the microwave emission can be decomposed into three components. The first component is the quiet Sun emission () which can be represented by the record before the solar flare (e.g. during 05:45 - 05:50 UT); the second one is the underlying broadband flaring continuum emission () which can be defined as the emission during the gap between two SMBs; and the last one is the emission of SMBs () which exceeds significantly. Around the M8.6 flare, sfu at LCP and RCP without significant polarization. The left panel of Fig.3 shows that sfu (the standard deviation sfu) at LCP and 87.7 sfu ( sfu) at RCP, and at LCP is in the range of 43-85 sfu which exceeds 5 with respect to and far surpass the instrument sensitivity . The right panel of Fig.3 indicates that sfu ( sfu) at LCP and 157.8 sfu ( sfu) at RCP. sfu at RCP which also exceeds 5 with respect to and far surpass the instrument sensitivity . We may suppose that each SMB is an independent burst which is different from the underlying broadband flaring continuum and the quiet Sun emissions.


The spectrogram in Fig. 2 implies that the distribution of SMBs is randomly, either in the flare rising phase or in the decay phase.
Actually, from the onset of the long-duration M8.6 flare to its decay phase, there are numerous SMBs occurred. The left panel of Fig.4 presents the distribution of the SMB occurrence rate in the flare and a comparison with the GOES soft X-ray emission (GOES SXR), the microwave emission intensity at LCP and RCP. The plus signs (+) indicate SMB occurrence rate. The solid curves are the radio emission intensity at 1.20 GHz. The positive and negative values indicate the presence at LCP and RCP, respectively. The comparison among GOES SXR, the microwave emission intensity at LCP and RCP indicate that there are time differences between their maxima. The maximum of GOES SXR occurred at about 06:37 UT, of LCP at about 06:25 UT, and of RCP at about 06:16 UT. A rough estimation indicates that there are about 6000 SMBs associated with the flare. Among them, about 94% LCP SMBs occurred before the LCP maximum, and about 91% RCP SMBs occurred after the LCP maximum.
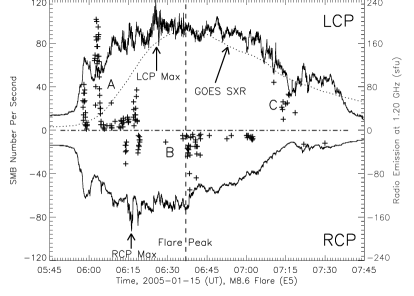
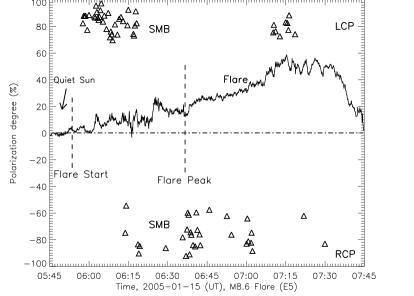
The polarization is another important parameter to reflect the nature of SMBs. The right panel of Fig.4 plots the temporal distribution of the polarization degree of SMBs averaged in time interval of one second (marked as ) associated with the M8.6 flare. In order to investigate the relationships between SMBs and the underlying flare broadband emission, the polarization degree of (during 05:45-05:57 UT) and (during 05:57-07:15 UT) are also over-plotted on the same figure. Here, we find that has no obvious polarization with , has a moderate left-handed circular polarization increasing slowly from the rising phase to decay phase and in range of , and then decreasing rapidly to below 10% after the end of the flare. Different from the above two components, almost all SMBs are strong circular polarization with degrees of polarization exceeding 55%; it is strong left-handed circular polarization before LCP maximum (06:25 UT) and strong right-handed circular polarization after LCP maximum, mainly. There is no obvious correlation between the polarizations of SMBs and background emission ( and ). This fact implies that SMBs are independent bursts overlapping on the underlying background emission.
| Event | Distribution | (sfu) | (ms) | (%) | L(km) | (K) | ||||
|---|---|---|---|---|---|---|---|---|---|---|
| E1 | rising phase | 44.3 | 71.6 | 35.5 | 3.0 | 820.5 | 90 | 600 | ||
| E5-A | rising phase | 52.8 | 15.1 | 23.6 | 2.0 | 3150 | 4600 | 400 | ||
| E5-B | around peak | 52.7 | 9.3 | 10.0 | 0.8 | 2120 | 1240 | 160 | ||
| E5-C | decay phase | 43.0 | 5.0 | 14.8 | 1.2 | 4110 | 150 | 240 | ||
| E10 | decay phase | 39.0 | 221.1 | 41.7 | 3.5 | 152.9 | 45 | 700 | ||
| E11 | rising phase | 40.1 | 49.7 | 24.8 | 2.1 | 736.3 | 92 | 420 | ||
| E12 | rising phase | 46.0 | 69.5 | 32.6 | 2.7 | 965.0 | 17 | 540 | ||
| E13 | decay phase | 55.9 | 10.3 | 20.0 | 1.7 | 3006 | 12600 | 340 |
Note. — is lifetime, is frequency bandwidth (MHz), is the frequency drifting rate (MHz/s). is the SMB occurrence rate, L and are the estimated upper limited width and lower limited brightness temperature of the source region, respectively.
According to SMB occurrence rates on the spectrograms, we may partition them into three groups: group A occurred in the flare early rising phase and mainly at LCP during 05:57-06:25 UT; group B is occurred around the impulsive peak phase at RCP during 06:13-07:10 UT; and group C is occurred in the flare decaying phase at LCP after 07:10 UT.
Among the 6000 SMBs, there are about 25% SMBs which can be measured obviously frequency drifting rates, the value of is in the range of 1200-9600 MHz/s. Table 2 lists the averaged burst strength, lifetime, frequency bandwidth, and the frequency drifting rate in each group of SMBs. Actually, the other SMBs possibly also have frequency drifting rates which are not detected because of the restrictions for the limited temporal and spectral resolutions at the instruments, which implies that the frequency drifting rates of SMBs may beyond 9600 MHz/s.
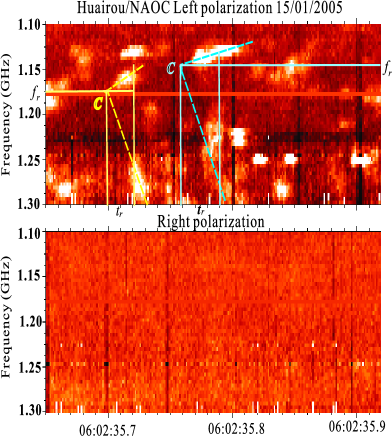
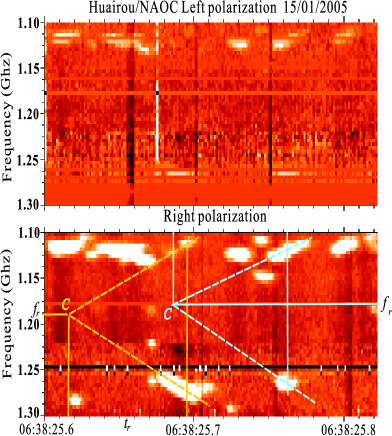
Sometimes, SMBs occurred in pairs with reversed frequency drifting rates at nearly the same time and different frequency range, we call them as reversed-drifting SMB pairs. Fig.5 presents two examples of such reversed-drifting SMB pairs occurred at 06:02:35.65-06:02:35.92 UT (in the flare rising phase) and 06:38:25.60-06:38:25.82 UT (in the flare decay phase). The crossing point of the extension lines (the dashed lines in Figure 5) of each SMB of the reversed-drifting SMB pairs can present a reversed time () and a reversed frequency (). Here, is defined as the time difference between the crossing point (C) and the corresponding SMB (approximately average of the two SMBs), and is defined as the frequency where the crossing point occurred. In the left panel of Figure 5, the reversed-drifting SMB pair occurs at the left-handed circular polarization, the reversed frequency 1.150-1.175 GHz, the low-frequency SMB is from 1.108 GHz to 1.168 GHz, with frequency drifting rate of about -600 MHz s-1; while the high-frequency SMB is from 1.200 GHz to 1.300 GHz, with frequency drifting rate of about 3900 MHz s-1. The reversed time is about 20-30 ms ahead of the corresponding SMBs. In the right panel of Figure 5, the reversed-drifting SMB pair occurs at the right-handed circular polarization, the reversed frequency 1.180-1.190 GHz, the low-frequency SMB is from 1.100 GHz to 1.150 GHz, with frequency drifting rate of about -800 MHz s-1; while the high-frequency SMB is from 1.250 GHz to 1.280 GHz, with frequency drifting rate of 1170 MHz s-1. The reversed time is 75-80 ms ahead of the corresponding SMBs. Among all the reversed-drifting SMB pairs, the reversed frequency 1.15 - 1.19 GHz, and the negative frequency drifting rate is in range from -500 MHz s-1 to -3500 MHz s-1, while the positive frequency drifting rate is in the range from 1400 MHz s-1 to 4000 MHz s-1. Obviously, the reversed-drifting SMB pairs in flare rising phase have a bit lower reversed frequencies and much longer reversed time than that in the flare decay phase. Supposing that SMB is associated with some energetic electron beams in the ambient plasma, then the reversed drifting SMBs may imply some local magnetic reconnections in small scale regions, and the crossing points may indicate the electron acceleration site where the electrons accelerated and propagated upwards and downwards, and then triggered the formation of reversed-drifting SMBs. Therefore, the reversed frequency may reflect the region where magnetic reconnections take place, and the reversed time may reflect the propagating process of energetic electrons from the acceleration site to its emission source region.
2.3.2 Abundant SMBs in a long-duration X7.1 flare on 2005-01-20
E13 is another SMB abundant long-duration flare. GOES soft X-ray observation show that it starts at 06:36 UT, reaches to maximum at 07:01 UT, and ends at 07:26 UT on 2005-01-20 with duration 50 min. It is an X7.1/2B flare, the most extremely powerful flare event occurred in the deep descending phase of solar cycle 23. It has attracted great attentions from solar and solar-terrestrial community for its strong fast halo CME, strong gamma-ray bursts with energy up to 200 MeV, the strongest solar energetic particle (SEP) flux, and the strongest microwave bursts (Grechnev, et al, 2008; Bombardieri, et al, 2008; Wang, Zhao, & Zhou, 2009). The most important is that E13 is an SMB abundant event. From the SBRS/Huairou observation at 1.10-1.34 GHz, there are about 12600 isolated SMBs distinguished. Different from E5, there is no any isolated SMBs occurred in the early rising and impulsive peak phase of the E13 flare. All SMBs are occurred after 07:10 UT, the decay phase of the flare.
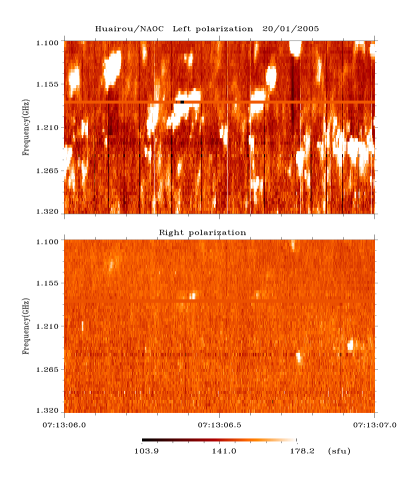
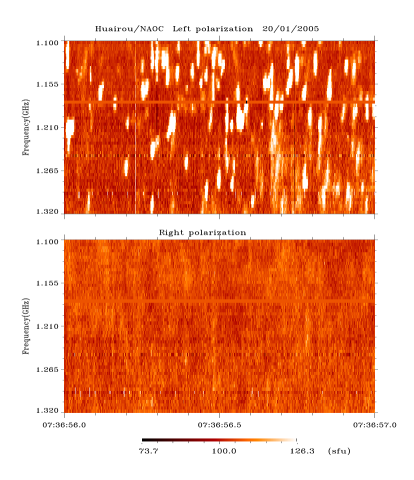
Fig.6 presents two segment spectrograms of SMBs at LCP and RCP observed by SBRS/Huairou in the decay phase and after the ending of the X7.1 flare (E13) on 2005-01-20. The left panels show a one-second segment spectrograms of SMBs during 07:13:06-07:13:07 UT in the flare decay phase. There are about 30 SMBs with strong left-handed circular polarization distributed randomly in this segment. The frequency bandwidth of SMB is in the range of 12-40 MHz, and the lifetime is about 5-40 ms with averaged value 14 ms. Some SMBs show frequency drifting, and is in the range from -2000 MHz/s to 3840 MHz/s. The underlying broadband flaring continuum emission is about 145 sfu with 6.4 sfu at LCP and 151 sfu with 6.1 sfu at RCP. The burst strength of SMBs is in the range of 38-75 sfu with averaged value 55.8 sfu. The averaged polarization degree is about 94%. The right panels of Fig.6 show another one-second segment spectrograms of SMBs during 07:36:56-07:36:57 UT after the flare ending. There are about 60 SMBs with strong LCP distributed randomly in this one-second segment. The frequency bandwidth of SMB is in the range of 16-32 MHz with averaged value 24 MHz, and the averaged lifetime is about 9 ms. Some SMBs show the frequency drifting rate from 2100 MHz/s to -3600 MHz/s. In this case, the underlying broadband flaring continuum emission is about 103 sfu with 4.7 sfu at LCP and 101 sfu with 4.1 sfu at RCP. The burst strength of SMBs is in the range of 41-105 sfu with averaged value 59.5 sfu. The averaged polarization degree is about 89%. Similar to the SMBs occurred in E5, there are also some SMBs occurred in E13 having reversed frequency drifting rates. The reversed frequency is about 1.180 GHz, and the reversed time is about 90-105 ms ahead of the corresponding SMBs.
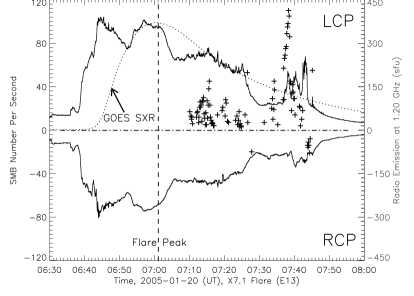
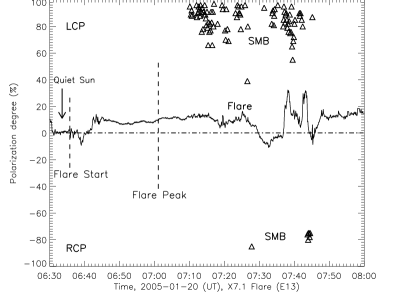
From the spectrograms during the X7.1 flare, there are about 12600 isolated SMBs recognized at frequency of 1.10-1.34 GHz. The left panel of Fig.7 presents the distribution of SMB occurrence rate in the flare and comparisons with GOES solar X-ray emission, the underlying microwave emission intensity at LCP and RCP. Here, we find that all SMBs are occurred during 07:10-07:45 UT, after or far away the maxima of GOES solar X-ray emission, underlying microwave emission intensity at LCP and RCP. The SMB distribution is very crowded together, and some of the SMB occurrence rate () exceed 100, which is much higher than that occurred in the above M8.6 flare event. The right panel of Fig.7 presents a comparison of polarization degrees between the quiet Sun (before 06:36 UT), underlying flare broadband continuum emission (during 06:36-07:26 UT), and SMBs. Here, we can also find that the polarization degree of the quiet Sun emission is very close to 0, the underlying flare broadband continuum emission is weakly left-handed circular polarization with , while most SMB are strongly left left-handed circular polarization with . We can also find that a few SMB have strongly right-handed circular polarization during 07:27 and 07:45 UT, far way from the flare maximum. Here, once again, we find that SMBs have obviously different polarization degree from the quiet Sun and the underlying flaring broadband continuum microwave emission. The range of SMB frequency bandwidth is 8-28 MHz, and the lifetime is in 5-18 ms. There are also part of SMBs which can be detected with obviously frequency drifting rates, and the value is in the range of 1400-8800 MHz/s.
Table 2 lists the averaged burst strength, lifetime, frequency bandwidth, and the frequency drifting rate of SMBs associated to the X7.1 flare event.
2.3.3 Sporadic SMBs in some flares
Besides the above two SMB abundant flares, there are additional 4 flares having sporadic SMBs, including E1 (X1.2 flare, duration of 40 min), E10 (M6.7 flare, duration of 57 min), E11 (X1.3 flare, duration of 37 min), and E12 (C4.8 flare, duration of 15 min) in active region NOAA10720. Table 1 and Table 2 list the main parameters of these events.
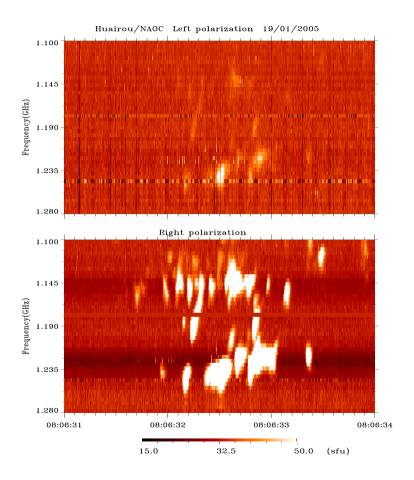
The left panels of Fig.8 present a 3.0 s segments of spectrogram of a group of SMBs with LCP and RCP occurred in the early rising phase of an X1.3 flare during 08:06:31 - 08:06:34 UT on 2005-01-19 (E11), which shows that SMBs are strongly right-handed circular polarization with averaged . There are totally 92 SMBs associated with the X1.3 flare, most of them have frequency drifting rates in range from -205 MHz/s to -3200 MHz/s with averaged value -736.3 MHz/s, no positive frequency drifting rate. The burst strength is in the range of 29-72 sfu with averaged value 40.1 sfu. The lifetime is in the range of 20-76 ms, the averaged lifetime is 49.7 ms, and the averaged frequency bandwidth is 24.8 MHz.
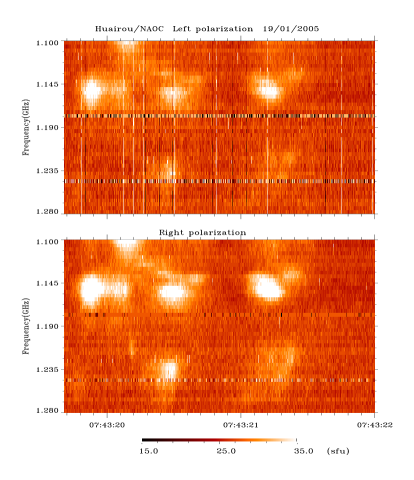
The right panels show a 2.3 s segment spectrogram of a few isolated SMBs occurred during 07:43:19.7-07:43:22.0 UT in the decay phase of another long-duration M6.7 flare (E10) on 2005-01-19. There are totally 45 isolated SMBs associated with the flare. Some of them have frequency drifting rates in the range from -61.3 MHz/s to -253.7 MHz/s. Here, SMBs are weakly right polarization with , the averaged lifetime is 221.1 ms, the averaged burst strength sfu, and the averaged frequency bandwidth is 41.7 MHz which is much wider than that occurred in the SMB abundant long-duration flares.
Actually, Table 2 indicates that in the 4 flare events with sporadic SMBs, the SMB lifetime is much longer, the frequency bandwidths are wider, the frequency drifting rates are much slower, and the SMB burst strengths are a bit smaller than that in the long-duration flares with a large amount of SMBs.
2.3.4 Brief summary
The above analysis shows that there are 6 flares in active region NOAA10720 having isolated SMBs at frequency of 1.10-1.34 GHz, some of them are abundant with SMBs, while others only have sporadic SMBs.
(1) Among the 6 flare events, there are 3 events having SMBs in their decay phase, and they are just the long-duration flares. This fact implies that long-duration flares tend to produce more SMBs in the decay phase.
(2) Most SMBs, especially the SMBs occurred abundantly in the decay phase of long-duration flares, have strongly circular polarization which is extremely different from the background emission ( and ), very short timescale (5-15ms), and narrow frequency band (around 0.8-2.0%).
(3) In the long-duration flares, some SMBs are occurred in the deep decay phase far away from the flare maxima, even after the flare ending, and they still have similar burst strength and strong polarization. Some of SMBs have reversed frequency drifting rates, the reversed frequency is about 1.15-1.19 GHz, and the reversed time is about 20-80 ms ahead of the corresponding SMBs.
(4) There is no obvious correlation of the burst strength, lifetime, bandwidth, frequency drifting rates, polarizations degrees between SMBs and background emission ( and ). This fact implies that SMBs are independent bursts overlapping on the underlying background emission.
3 Physical Discussions
From the relative frequency bandwidth of SMBs we may make an estimation of the upper limited spatial scales of the source region: . Here, is the scale length of emission frequency around the source region. The highly circular polarization of SMBs indicate that the emission mechanism is possibly the fundamental plasma emission, and the emission frequency can be expressed: . is the electron plasma density. Then . Here, is the scale length of plasma density () which depends on the plasma thermal temperature (). Supposing that thermal temperature around the source region is about 1 MK, km, and the source region is near the lower part of corona. Then the upper limited spatial width of SMB source regions can be obtained. The eighth column of Table 2 presents the estimated upper limited width of SMB source regions, which is in the range of 160-700 km. This result is consistent with the VLBI imaging observations which shows the diameter of spike source region about 50 km at 1663 MHz (Tapping, et al, 1983). Furthermore, the lower limit of the SMB’s emission brightness temperature () can be deduced (Smerd, 1950; Tan et al, 2009):
| (1) |
Here, units of and are in sfu and Hz, respectively. The last column of Table 2 lists the estimated lower limited brightness temperature of SMBs, which is in range of - 1.92 K. As a comparison, the image observation indicates that the length of active region AR10720 is about 200 arcseconds at 17 GHz (obtained from Nobeyama Radio Heliograph), we may suppose that the source region of the flaring radio emission will be larger than 200 arcseconds. As a upper limit, the emission brightness temperature of the flare radio emission at 1.20 GHz is about K, which is several orders lower than that of SMBs. The emission brightness temperature of the quiet Sun can be also estimated as K, which is two orders lower than that of the flaring broadband emissions.
The very high brightness temperatures of SMBs indicate that the emission mechanism should be some coherent emissions, which may reflect the presence of non-thermal energetic electrons in the source region. Considering that they occur not only in the flare rising and impulsive phases, but also in the flare decay phase and even far away from the impulsive phase, possibly they reflect the existence of similar small scale nonthermal energy releasing in the flare decay phase.
The most frequently mentioned coherent mechanism is ECME which is supposed to be the formation mechanism of solar radio spike bursts by many people (Fleishman, et al, 2003, etc). However, ECME occurs only when the following conditions are satisfied (Melrose & Dulk, 1982):
| (2) |
and
| (3) |
Here, is the emission frequency, is the harmonic number, is the Lorentz factor of the energetic electrons, and are the parallel components of the wave number and electron velocity. The most favorable regime to produce ECME is the loss-cone instabilities occurred near the footpoint of flare loops. If the mechanism is ECME, then from Equ.(3), the magnetic field strength in the SMB source region should be 430 Gs.
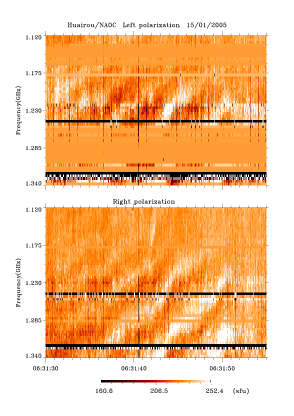
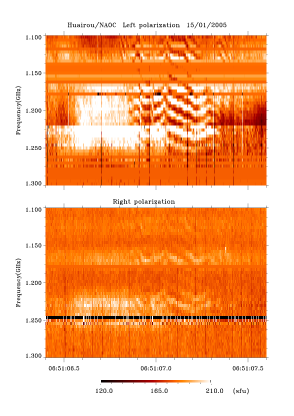
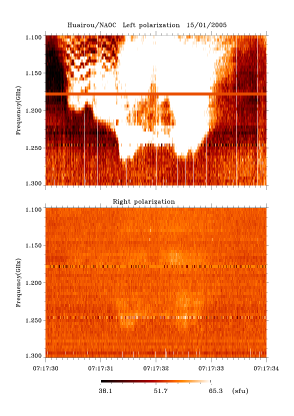
So far, we have no direct measurement of magnetic field in solar corona. Microwave zebra patterns (ZP) may be an useful tool to provide information of magnetic field associated to the microwave source regions (Tan et al. 2012). It is fortunate that there are several ZPs accompanying with SMBs in E5 flare. Fig.9 presents three segments of ZPs which occurred before the flare peak (06:31:30-06:31:55 UT, left), in the flare decay phase (06:51:06.4-06:61:07.6 UT, middle), and near the end of the flare (07:17:30-07:17:34 UT, right), respectively. The left one is a long-duration ZP, which frequency range is in 1.136-1.340 GHz (central frequency is about 1.24 GHz), lasts for about 25 s, and shows moderate RCP with polarization degree about 48%. The frequency separation between the adjacent zebra stripes is in the range of 78-88 MHz, the average value is 84 MHz. The middle panel shows an ZP at frequency range 1.10-1.25 GHz (central frequency about 1.18 GHz), strong LCP with polarization degree of about 71.3%, the frequency separation between the adjacent zebra stripes is in the range of 16-20 MHz with averaged value 18 MHz. The right panel shows an ZP at frequency range 1.10-1.20 GHz (central frequency about 1.15 GHz), strong LCP with polarization degree very close to 100%. The frequency separation between the adjacent zebra stripes is in the range of 12-16 MHz, the average value is about 14 MHz. Fig.9 appears that the central frequency of ZPs have an obvious decreasing from the early to late in the flare. At the same time, the polarization of ZPs have a change from RCP to LCP, which is approximately different from that of SMBs. Using the similar method in Tan et al. (2012), the estimated magnetic field strengths is about 126.8-143.0 Gs, 26-32.5 Gs, and 19.5-26.0 Gs, respectively in the source region, which is much weaker than the requirement of Equ.(3).
Actually, it is possible that the source region of SMBs may be different from ZPs. However, the linear force-free magnetic extrapolation indicates that it is very difficult to be more than 400 Gs in the lower corona region above the active region 10720 (Cheng, et al, 2011). Both results of the above estimation indicate that ECME seems difficult to be the mechanism of SMB formation.
The another kind of coherent mechanism is plasma emission, which is generated from the coupling of two excited plasma waves at frequency of with weak polarization, or the coupling of an excited plasma wave and a low-frequency electrostatic wave at frequency of about with strong polarization (Zheleznyakov & Zlotnik 1975, Chernov et al. 2003). The plasma waves are excited by fast electrons in relatively weak magnetic fields:
| (4) |
and
| (5) |
Here, is the velocity of fast electrons, is the velocity of the thermal electrons in background. Equ.(4) indicates that energetic electrons are necessary, and fast electron beam plays a dominant role in plasma emission processes. It is Langmuir wave that can resonantly interact with electrons of and remove free energy. The recently only accepted form which can produce high levels of Langmuir waves is the bump-in-the-tail instability, or say two-streaming instability. There is only one widely accepted means of creating bump-in-the-tail distribution: having fast electrons outpace slow ones so that, at some distance from the acceleration region, fast electrons arrive first, trigger a Langmuir wave, resonantly interact with the ambient electrons, and transfer the free energy into emission. When the Langmuir wave reaches to some place where Equ.(5) does not agree, it will quench. The very short lifetime of SMB requires that the source region must be highly inhomogeneous filled with great numbers of small scale structures. Similar to the regime of microwave quasi-periodic pulsation with millisecond bursts (Tan & Tan, 2012), here we may also adopt the same model to interpret the formation of SMBs. We may suppose the post-flaring loops are current-carrying plasma loops, where the resistive tearing mode instability can be triggered, and causes the formation of many small scale magnetic islands along each rational surface in the plasma loops. Each X-point between the adjacent magnetic islands will be a small reconnection site and will produce secondary acceleration on the ambient electrons, similar to the regime in current sheet (Shen, Lin & Murphy, 2011). These accelerated electrons impact the adjacent plasmas around the small X-point, trigger the Langmuir turbulence and plasma waves, and produce microwave bursts by plasma emission mechanism. Such microwave bursts are just SMBs. As there are many magnetic X-points in the current-carrying plasma loops, each X-point will be a small reconnection site, and the region around each X-point will be a source of an SMB. As a result, SMBs can arise in huge clusters. However, as we are lack of imaging observations, it is a big challenge to set up a more self-consistent structure of the SMB source region.
The above analysis indicates that non-thermal energy releasing and highly inhomogeneity in source region are necessary for the formation of SMBs in the frame of plasma emissions.
As the frequency of plasma emission depends on the plasma density , when the fast electrons move in the inhomogeneous ambient plasma, the frequency will drift: . Here, . is the harmonics, is the fundamental emission, is the second harmonic emission. Then the velocity of fast electrons can be estimated:
| (6) |
Then, from the frequency drifting rates of SMBs, we may estimate the velocity of the fast electrons. For example in the long-duration flare E5, the frequency drifting rates are in the range of 1200-9600 MHz s-1, and the corresponding velocities of fast electrons are in range of 0.07-0.53c, and the kinetic energy is keV. Here, c is speed of the light. In another long-duration flare E13, the frequency drifting rates are in the range of 1400-8800 MHz s-1, the corresponding velocities of fast electrons are in range of 0.08-0.49c, and the kinetic energy is keV. When , the exciter moves from tenuous plasma region to dense plasma region, such as the downward motion in corona; when , the exciter moves from dense plasma region to the tenuous plasma region, such as the upward motion in corona. The reversed-drifting SMB pairs may track the position of acceleration region. From the reversed time we may estimate the distance between the acceleration region and the SMB source region: . Supposing , and ms, then is about 400-38000 km. This agrees with the theoretical requirement that Langmuir wave can be triggered in place at some distance from the acceleration region. And these facts are consistent with a similar recent result from EUV and hard X-ray observations (Liu, Chen, & Petrosian, 2013).
However, in flares with only sporadic SMBs (E1, E10, E11, and E12), the frequency drifting rates of some SMBs are slow as 60 - 900 MHz s-1, the above method presents the velocities are only in the range of 0.003-0.05 c. Considering their relatively longer lifetimes, wider frequency bandwidth, moderate circular polarizations, and occurred mainly in the early rising phase of mid- or short-duration flares, they are possibly associated with some small scale plasma jets. However, this is just a guess for lack of corresponding imaging observations.
4 Conclusions
In the previous work (Benz, 1986, etc.), since most of SMBs (mainly indicated spike bursts) appear during the primary energy release in solar flares, they are regarded as fragmented into about ten thousands more or less single elementary flare bursts. And at least part of the flaring energy is carried by fast electrons released in these elementary flare bursts. However, this work presents a comprehensive analysis on a series of solar flares occurred in active region NOAA 10720 during 2005 Jan 15-20, and indicates that long-duration flares can produce abundant independent isolated SMBs in the flare decay phase as well as in flare rising phase, some of them are occurred even in the deep decay phase far away after the flare peak, and even after the flare ending. These SMBs have strongly circular polarization which is extremely different from the background emission ( and ), very short timescale (around 5-15 ms), and narrow frequency band (around 0.8-2.0%). Possibly, they are independent bursts overlapping on the underlying background broadband continuum emission. The inferred brightness temperature is at least - 1.92 K, and the obviously different polarizations of SMBs from the background emission (the quiet Sun and flare emission) indicates that each SMB should be individual independent strong coherent emission burst which is related to some non-thermal energy releasing and production of energetic particles. These facts imply the existence of energetic particles and the strong nonthermal energy releasing processes with small scales in the decay phase of long-duration flares. It is meaningful to the prediction of space weather events.
As for the formation of SMB, because the magnetic field strength deduced from ZPs and nonlinear force-free field extrapolation around the source region is too weak, ECME seems difficult to be the formation mechanism of SMBs, while the plasma emission mechanism may become the favorable candidate for the formation of SMBs at fundamental Langmuir frequencies, although it also has some unresolved problems, such as the pattern of highly inhomogeneity in source regions. From the plasma mechanism, we may deduce the velocities and kinetic energy of fast electrons associated with SMBs. Using the observations of reversed drifting SMBs we may track region of the electron acceleration and estimate the distance between the acceleration region and the SMB source regions, etc.
As energetic electrons coming from solar flares may create severe impacts to the environment of solar-terrestrial space. The activity of nonthermal processes and energetic electrons in the decay phases of long-duration flares indicate that it is also important to pay close attention to the impact of post-flare activities of long-duration flares on the space weather events. The study of SMBs may reveal some new principles of the energetic non-thermal processes associated with solar flares, such as particles accelerations, the detailed structure of source region, and the mechanism of energy conversions, etc.
Because of the instrument limitations, this work just presents the behaviors of SMBs in a relatively small frequency range (1.10-1.34 GHz). Fig.6 and other spectrograms show that it is most possible to exceed the frequency range of 1.10-1.34 GHz. It is necessary to extend the observational frequency to below 1.10 GHz and above 1.34 GHz greatly with superhigh cadence and high frequency resolutions. Additionally, the imaging observations at the corresponding frequencies are also most important for its ability to provide directly the locations, geometrical structures, and magnetic fields in the source region (Yan, et al, 2009). These will help us to set up a much more self-consistent theoretical model of solar SMBs.
References
- Battaglia (2009) Battaglia, M., Benz, A.O., 2009, AA, 499, L33
- Benz (1985) Benz, A.O.: 1985, Solar Phys., 96, 357.
- Benz (1986) Benz, A.O.: 1986, Solar Phys., 104, 99.
- Benz (1991) Benz, A.O., Gudel, M., & Isliker, H., et al.: 1991, Solar Phys., 133, 385.
- Benz (2002) Benz, A.O., Saint-Hilaire, P., & Vilmer, N: 2002, AA, 383, 678.
- Bombardieri (2008) Bombardieri, D.J., Duldig, M.L., Humble, J.E., & Michael, K.J.: 2008, ApJ, 682, 1315
- Cheng (2010) Cheng, X., Ding, M.D., & Guo, Y., et al.: 2010, ApJ, 716, L68
- Cheng (2011) Cheng, X., Zhang, J., Ding, M.D., Guo, Y., & Su, J.T.: 2011, ApJ, 732, 87
- Chernov (2003) Chernov, G. P., Yan, Y.H., & Fu, Q.J., 2003, AA, 406, 1071
- Csillaghy & Benz (1993) Csillaghy, A., & Benz, A.O.: 1993, AA, 274, 487.
- Dabrowski (2011) Dabrowski, B.P., Rudawy, P., & Karlicky, M.: 2011, Solar Phys., 273, 377
- Dulk (1985) Dulk, G. A.: 1985, Ann. Rev. Astron. Astrophys., 23, 169
- Fleishman (2003) Fleishman, G.D., Gary, D.E., & Nita, G.M.,: 2003, ApJ, 593, 571
- Fu (1995) Fu, Q.J., Qin, Z.H., Ji, H.R., & et al: 1995, Solar Phys., 160, 97
- Fu (2004) Fu, Q.J., Ji, H.R., Qin, Z.H. & et al.: 2004, Solar Phys., 222, 167
- Grechnev (2008) Grechnev, V.V., Kurt, V.G., Chertok, I.M. & et al.: 2008, Solar Phys., 252, 149
- Gudel & Benz (1990) Gudel, M., & Benz, A.O.: 1990, AA, 231, 202.
- Huang (2005) Huang, G.L., & Nakajima, H.: 2005, Astrophys. Space Sci, 295, 423
- Huang (2012) Huang, J., & Tan, B.L.: 2012, ApJ, 745, 186
- Jiricka et al (1993) Jiricka, K., Karlicky, M., Kepka, O., & Tlamicha, A.: 1993, Solar Phys. 147, 203.
- Karishan (2003) Karishan, V., Fernandes F.C.R., Cecatto J.R., & Sawant, H.S., 2003, Solar Phys., 215, 147
- Liu (2013) Liu, W., Chen, Q.R., & Petrosian, V.: 2013, ApJ. 767, 168L.
- Malville (1967) Malville, J.M., Aller, H.D., & Jensen, C.J.: 1967, ApJ. 147, 711.
- Melrose (1982) Melrose, D.B., & Dulk, G.A.: 1982, ApJ, 259, 844
- Messmer (2000) Messmer, P., & Benz, A.O.: 2000, AA, 354, 287.
- Rozhansky (2008) Rozhansky, I.V., Fleishman, G.D., & Huang, G.L.: 2008, ApJ. 681, 1688.
- Smerd (1950) Smerd, S.F.: 1950, Aust. J. Sci. Res. A, 3, 34.
- Sawant (2001) Sawant, H.S., Subramanian, K.R., Faria, C., et al: 2001, Solar Phys., 200, 167.
- Shen (2011) Shen, C.C., Lin, J., & Murphy, N.A.: 2011, ApJ, 737, 14
- Tan (2012) Tan, B.L., & Tan, C.M.: 2012, ApJ, 749, 28
- Tan et al (2012) Tan, B.L., Yan, Y.H., & Tan, C.M., et al.: 2012, ApJ, 744, 166
- Tan et al (2009) Tan, B.L., Yan, Y.H., & Tan, C.M., et al.: 2009, Sci. China Ser. A, 52, 1765
- Tpping (1983) Tapping, K.F., Kuijpers, J., & Kaastra, J.S., et al.: 1983, AA, 122, 177
- Tarnstrom (1972) Tarnstrom, G.L., & Philip, K.W.: 1972, AA, 16, 21
- Wang (2009) Wang, J.X., Zhao, M., & Zhou, G.P.: 2009, ApJ, 690, 862
- Wang (2008) Wang, S.J., Yan, Y.H., & Liu, Y.Y., et al.: 2008, Solar Phys. 253, 133.
- Yan et al (2002) Yan, Y.H., Tan, C.M., & Xu, L., et al.: 2002, Sci. Chin. A Suppl., 45, 89.
- Yan et al (2009) Yan, Y.H., Zhang, J., & Wang, W., et al.: 2009, Earth. Moon. Planet 104, 97.
- Zhao (2006) Zhao, M., & Wang, J.X.: 2006, IAU Symposium 233, 41.
- Zheleznyakov (1975) Zheleznyakov, V.V., & Zlotnik, E.YA.: 1975, Solar Phys. 44, 461.