Twenty-Five Sub-Arcsecond Binaries Discovered By Lunar Occultations ∗ 00footnotetext: ∗Based on observations made with ESO telescopes at Paranal Observatory
Abstract
We report on 25 sub-arcsecond binaries, detected for the first time by means of lunar occultations in the near-infrared as part of a long-term program using the ISAAC instrument at the ESO Very Large Telescope. The primaries have magnitudes in the range K=3.8 to 10.4, and the companions in the range K=6.4 to 12.1. The magnitude differences have a median value of 2.8, with the largest being 5.4. The projected separations are in the range 6 to 748 milliarcseconds and with a median of 18 milliarcseconds, or about 3 times less than the diffraction limit of the telescope. Among our binary detections are a pre-main sequence star and an enigmatic Mira-like variable previously suspected to have a companion. Additionally, we quote an accurate first-time near-IR detection of a previously known wider binary.
We discuss our findings on an individual basis as far as made possible by the available literature, and we examine them from a statistical point of view. We derive a typical frequency of binarity among field stars of %, in the resolution and sensitivity range afforded by the technique ( to , and K mag, respectively). This is in line with previous results by the same technique but we point out interesting differences that we can trace up to sensitivity, time sampling, and average distance of the targets. Finally, we discuss the prospects for further follow-up studies.
1 Introduction
Lunar occultations (LOs) can efficiently yield high angular resolution observations from the analysis of the diffraction light curves generated when background sources are covered by the lunar limb. The technique has been employed to measure hundreds of stellar angular diameters, binary stars, and sources with extended circumstellar emission (see CHARM2 catalog, Richichi et al., 2005). In the past few years, a program to observe LOs in the near-infrared at the ESO Very Large Telescope (VLT) has been very successful both in quantity, with over a thousand events recorded, and in quality with a combination of angular resolution far exceeding the diffraction limit of a single telescope () and a sensitivity significantly better than that currently achieved by long-baseline interferometry (K mag). The drawbacks are that LOs are fixed-time events, yielding mainly a one-dimensional scan of the source, and that the source cannot be chosen at will. Details on the LOs program at the VLT can be found in Richichi et al. (2012b), and references therein.
Here, we report on 25 sources discovered to be binary with projected separations below one arcsecond, and in fact mostly below the 57 milliarcseconds (mas) diffraction limit of the telescope at the given wavelength. We also report on one previously known system. In Sect. 2 we describe the observational procedure, the sample composition, and the data analysis. In Sect. 3 we report the individual results, and provide some context from previous bibliography when available. Some considerations on the statistics of binary detections from our VLT LO program and on the prospects of follow-up of selected systems are given in Sect. 4.
2 Observations and data analysis
The observations were carried out between April 2010 and October 2011, using the 8.2-m UT3 Melipal telescope of the VLT and the ISAAC instrument operated in burst mode. Most of the observations were carried out in service mode, based on a strategy of profiting from short slots that might become available depending on the atmospheric conditions and execution status of other service programs. Consequently, the targets were inherently random. A few observations were parts of isolated nights dedicated to LO observations in visitor mode, and in this case the sources were selected on the basis of their colors and brightness in very extincted regions of the Galactic Bulge. The sources observed in service mode have the field ”Our ID” in Table 1 beginning with P85 to P88, which are the ESO Periods under consideration. The sources without this prefix were observed in visitor mode.
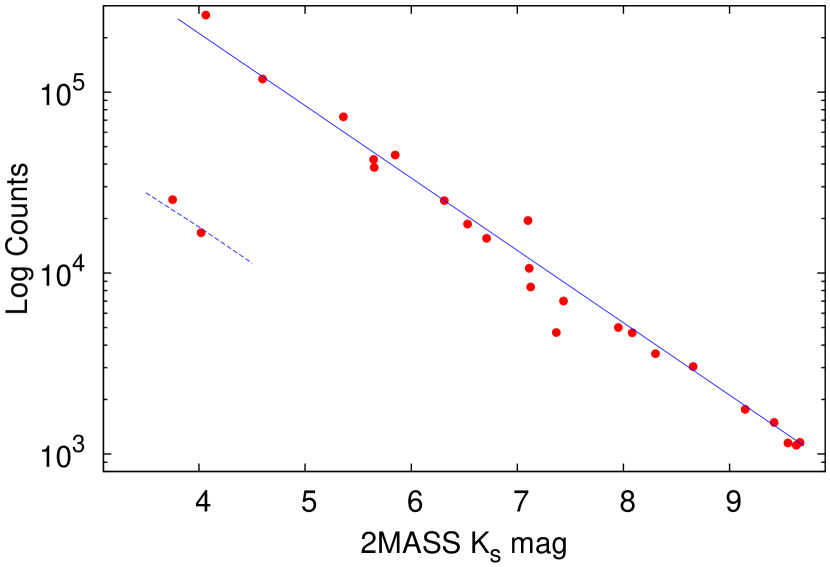
Table 1 provides a list of the observations and of the characteristics of the sources, ordered by time. A sequential number is included, for ease of cross-reference. Our predictions were generated from the 2MASS Catalogue, and so is the listed near-infrared photometry. We did not attempt to derive proper K-band photometry from our light curves, due to the lack of calibration sources. However we notice that in some cases differences between our counts and the 2MASS magnitudes of up to a factor 2 are present, pointing to possible variability (Fig. 1). Further identifications in Table 1, as well as visual photometry and spectral types, are extracted from the Simbad database.
Each observation consisted of 7500 or 5000 frames (in service or visitor runs, respectively) in a 32x32-pixel () sub-window, with a time sampling of 3.2 ms. This was also the effective integration time. A broad-band Ks filter was employed for all events, except in the case of the brighter sources Stars 4 and 22, for which a narrow-band filter centered at 2.07 m was employed to avoid possible non-linearities. The events were disappearances, with lunar phases ranging from 38% to 96% (median 66%). Airmass ranged from 1.1 to 2.0, while seeing ranged from to (median ). The LO light curves are generated in vacuum at the lunar limb and the diffraction fringes span a range of few 0.1 s, so that the technique is in any case largely insensitive to atmospheric perturbations.
The data cubes were converted to light curves by extracting the signal at each frame within a mask tailored to the seeing and image quality. The light curves were then analyzed using both a model-dependent (Richichi et al., 1996) and a model-independent method (CAL, Richichi 1989). This latter is well suited to derive brightness profiles in the case of faint binaries, from which the initial values of the model can be inferred. The least-squares fits are driven by changes in normalized , with a noise model defined for each light curve from the data before and after the occultation. More details on the instrumentation and the method can be found in Richichi et al. (2011) and references therein. It should be noted that only restricted portions of the light curves around the main disappearance, corresponding to angular extensions of , were considered. In general, companions with projected separations larger than this would not appear in our list.
| Seq | Our ID | 2MASS ID | Simbad ID | Date | UT | B | V | J | H | K | Sp. |
|---|---|---|---|---|---|---|---|---|---|---|---|
| 1 | P85-06 | 07283985+2151062 | BD+22 1693 | 21-Apr-10 | 00:03:25 | 9.52 | 9.12 | 8.50 | 8.36 | 8.30 | F2 |
| 2 | P85-23 | 19224512-2046033 | BD-21 5366 | 21-Aug-10 | 05:39:03 | 11.18 | 10.07 | 8.09 | 7.59 | 7.44 | |
| 3 | P85-26 | 19240606-2103008 | BD-21 5373 | 21-Aug-10 | 05:59:25 | 11.63 | 10.28 | 6.73 | 5.93 | 5.65 | |
| 4 | s033 | 18115684-2330488 | AKARI-IRC-V1 | 16-Sep-10 | 03:08:18 | 16.50 | 15.60R | 5.70 | 4.51 | 4.02 | |
| 5 | P86-02 | 22275268-0418586 | HD 212913 | 15-Nov-10 | 00:52:55 | 10.61 | 8.92 | 5.42 | 4.28 | 4.07 | M… |
| 6 | P86-06 | 22282898-0417248 | 15-Nov-10 | 01:33:46 | 10.32 | 9.76 | 9.63 | ||||
| 7 | P86-13 | 22304733-0348326 | HD 213344 | 15-Nov-10 | 03:24:31 | 10.82 | 9.75 | 7.77 | 7.23 | 7.11 | K0 |
| 8 | P86-21 | 23551978+0532182 | TYC 593-1067-1 | 17-Nov-10 | 00:35:44 | 10.44 | 9.92 | 8.94 | 8.74 | 8.66 | |
| 9 | P86-27 | 23581573+0612341 | TYC 593-1360-1 | 17-Nov-10 | 03:37:07 | 10.85 | 9.88 | 8.44 | 8.04 | 7.95 | |
| 10 | P86-31 | 23592250+0614580 | TYC 593-1337-1 | 17-Nov-10 | 04:20:09 | 11.62 | 11.11 | 9.98 | 9.72 | 9.66 | |
| 11 | P87-014 | 09463209+0913340 | 13-Apr-11 | 23:11:43 | 10.21 | 9.67 | 9.55 | ||||
| 12 | P87-026 | 10220366+0515554 | TYC 252-1217-1 | 11-May-11 | 23:03:59 | 12.03 | 11.33 | 9.86 | 9.48 | 9.42 | |
| 13 | P87-041 | 10070867+0628201 | TYC 250-82-1 | 07-Jun-11 | 22:55:04 | 11.23 | 10.55 | 9.53 | 9.27 | 9.15 | |
| 14 | vmj-023 | 17350423-2319491 | 13-Jul-11 | 04:49:05 | 9.75 | 8.60 | 8.08 | ||||
| 15 | vmj-056 | 17395562-2303408 | HD 160257 | 13-Jul-11 | 07:26:09 | 9.18 | 8.58 | 7.47 | 7.20 | 7.13 | G2V |
| 16 | vma-049 | 18142147-2207047 | IRAS 18113-2208 | 10-Aug-11 | 03:14:03 | 7.48 | 6.20 | 5.65 | |||
| 17 | vma-055 | 18151114-2213294 | 10-Aug-11 | 03:33:19 | 7.80 | 6.55 | 5.85 | ||||
| 18 | vma-062 | 18154557-2220045 | 10-Aug-11 | 03:57:43 | 8.45 | 7.32 | 6.71 | ||||
| 19 | vma-083 | 18172695-2147313 | 10-Aug-11 | 05:27:34 | 9.25 | 8.05 | 7.37 | ||||
| 20 | P88-003 | 17370333-2239165 | HD 159700 | 02-Oct-11 | 23:33:40 | 11.28 | 9.67 | 5.81 | 5.04 | 4.60 | K7 |
| 21 | P88-008 | 17371972-2215045 | IRAS 17343-2213 | 03-Oct-11 | 00:02:24 | 8.89 | 7.86 | 7.10 | |||
| 22 | P88-021 | 17401076-2208280 | IRAS 17371-2207 | 03-Oct-11 | 01:30:13 | 12.16 | 10.67 | 5.32 | 4.11 | 3.75 | |
| 23 | P88-046 | 18395035-2052114 | BD-20 5222 | 04-Oct-11 | 02:02:01 | 11.00 | 9.79 | 7.30 | 6.70 | 6.53 | |
| 24 | P88-050 | 18402840-2040072 | KO Sgr | 04-Oct-11 | 02:31:16 | 12.70 | 14.50 | 6.84 | 5.91 | 5.36 | |
| 25 | P88-052 | 18403433-2034059 | IRAS 18375-2036 | 04-Oct-11 | 02:45:15 | 7.89 | 6.85 | 6.31 |
3 Results
Table 2 lists our results, following closely the format already used in previous papers. The same sequential number used in Table 1 is included, followed by the 2MASS identification. The next two columns are the observed rate of the event and its deviation from the predicted value. The difference is due to the local limb slope , from which the actual observed position angle PA and contact angle CA are derived. We then list the binary fit results, namely the signal-to-noise ratio (SNR) of the light curve, the separation and brightness ratio, and the two individual magnitudes based on the total magnitude listed in the 2MASS. As mentioned in Sect. 2, for Stars 4 and 22 narrow-band filters were used but we do not expect significant effects on K1, K2.
| Seq | 2MASS | V (m/ms) | V/Vt–1 | () | PA() | CA() | SNR | Sep. (mas) | Br. Ratio | K1 | K2 |
|---|---|---|---|---|---|---|---|---|---|---|---|
| 1 | 07283985+2151062 | 0.6326 | -12.0% | -26 | 94 | -23 | 26.5 | 190.29 0.06 | 2.335 0.004 | 8.69 | 9.61 |
| 2 | 19224512-2046033 | 0.4199 | -8.5% | -4 | 7 | -58 | 64.2 | 55.5 0.4 | 7.98 0.02 | 7.56 | 9.82 |
| 3 | 19240606-2103008 | 0.4715 | -12.2% | -6 | 107 | 43 | 91.6 | 8.4 0.2 | 12.06 0.04 | 5.74 | 8.44 |
| 4 | 18115684-2330488 | 0.6350 | -5.8% | -5 | 33 | -38 | 70.3 | 8.8 0.3 | 18.9 0.2 | 4.07 | 7.27 |
| 5 | 22275268-0418586 | 0.4576 | -7.9% | -6 | 83 | 33 | 116.8 | 6.29 0.05 | 7.53 0.01 | 4.20 | 6.39 |
| 6 | 22282898-0417248 | 0.2254 | -21.5% | -6 | 110 | 58 | 10.4 | 6.9 2.6 | 4.5 0.1 | 9.85 | 11.48 |
| 7 | 22304733-0348326 | 0.6890 | 10.9% | 9 | 283 | 46 | 47.7 | 42.5 0.4 | 29.2 0.3 | 7.15 | 10.81 |
| 8 | 23551978+0532182 | 0.5415 | -7.0% | -10 | 58 | 8 | 39.4 | 15.3 0.7 | 12.7 0.2 | 8.74 | 11.50 |
| 9 | 23581573+0612341 | 0.6639 | 0.4% | 1 | 47 | -10 | 46.1 | 19.6 1.0 | 45.1 1.6 | 7.97 | 12.11 |
| 10 | 23592250+0614580 | 0.6767 | -4.2% | -9 | 62 | 2 | 2.5 | 40.1 0.3 | 1.03 0.01 | 10.40 | 10.43 |
| 11 | 09463209+0913340 | 0.4553 | -22.3% | -16 | 141 | 20 | 7.5 | 47.9 0.2 | 1.50 0.01 | 10.11 | 10.54 |
| 12 | 10220366+0515554 | 0.6121 | -3.2% | -4 | 146 | 20 | 9.0 | 29.4 3.5 | 2.34 0.02 | 9.81 | 10.73 |
| 13 | 10070867+0628201 | 0.4769 | 5.3% | 3 | 179 | 53 | 10.3 | 371.7 4.1 | 1.447 0.007 | 9.72 | 10.12 |
| 14 | 17350423-2319491 | 0.3648 | -0.3% | 0 | 137 | 58 | 31.6 | 8.3 0.8 | 9.7 0.1 | 8.19 | 10.66 |
| 15 | 17395562-2303408 | 0.6512 | 26.4% | 12 | 324 | 67 | 29.3 | 41.96 0.07 | 1.137 0.003 | 7.81 | 7.95 |
| 16 | 18142147-2207047 | 0.5564 | 0.1% | 0 | 222 | -32 | 202.4 | 32.4 0.3 | 144.4 1.6 | 5.65 | 11.05 |
| 17 | 18151114-2213294 | 0.6585 | -1.7% | -7 | 71 | -3 | 209.2 | 15.1 0.2 | 100.1 1.3 | 5.86 | 10.86 |
| 18 | 18154557-2220045 | 0.3918 | -28.0% | -17 | 95 | 22 | 72.9 | 9.9 0.4 | 24.7 0.3 | 6.75 | 10.24 |
| 19 | 18172695-2147313 | 0.4303 | 9.8% | 3 | 194 | -58 | 22.5 | 27.8 0.9 | 12.2 0.1 | 7.45 | 10.17 |
| 20 | 17370333-2239165 | 0.3548 | -33.8% | -20 | 98 | 19 | 99.8 | 8.8 0.1 | 25.60 0.09 | 4.64 | 8.16 |
| 21 | 17371972-2215045 | 0.4863 | 10.0% | 5 | 31 | -47 | 124.9 | 7.30 0.07 | 18.9 0.1 | 7.16 | 10.35 |
| 22 | 17401076-2208280 | 0.6415 | -1.0% | -1 | 36 | -40 | 135.5 | 6.2 0.3 | 36.5 0.5 | 3.78 | 7.69 |
| 23 | 18395035-2052114 | 0.7922 | 0.4% | 1 | 262 | 12 | 109.3 | 748.4 0.2 | 23.13 0.04 | 6.58 | 9.99 |
| 24 | 18402840-2040072 | 0.7780 | -2.1% | -3 | 227 | -23 | 217.6 | 18.1 0.2 | 78.3 0.6 | 5.37 | 10.11 |
| 25 | 18403433-2034059 | 0.5391 | -15.4% | -9 | 19 | -52 | 111.9 | 8.1 0.3 | 18.5 0.1 | 6.37 | 9.54 |
Many of our sources are in the direction of the Galactic Bulge, having 17h RA 19h and Dec . They have generally very red colors; however a color-color diagram shows that these are mostly consistent with significant amounts of interstellar extinction (Fig. 2), with a possible notable exception to be discussed later. In line with this extinction, many of our sources have relatively faint optical counterparts, or none. Few of them have been studied in detail previously, and spectral information is correspondingly scarce. In the reminder of this section we discuss individual cases in the context of available literature, when possible.
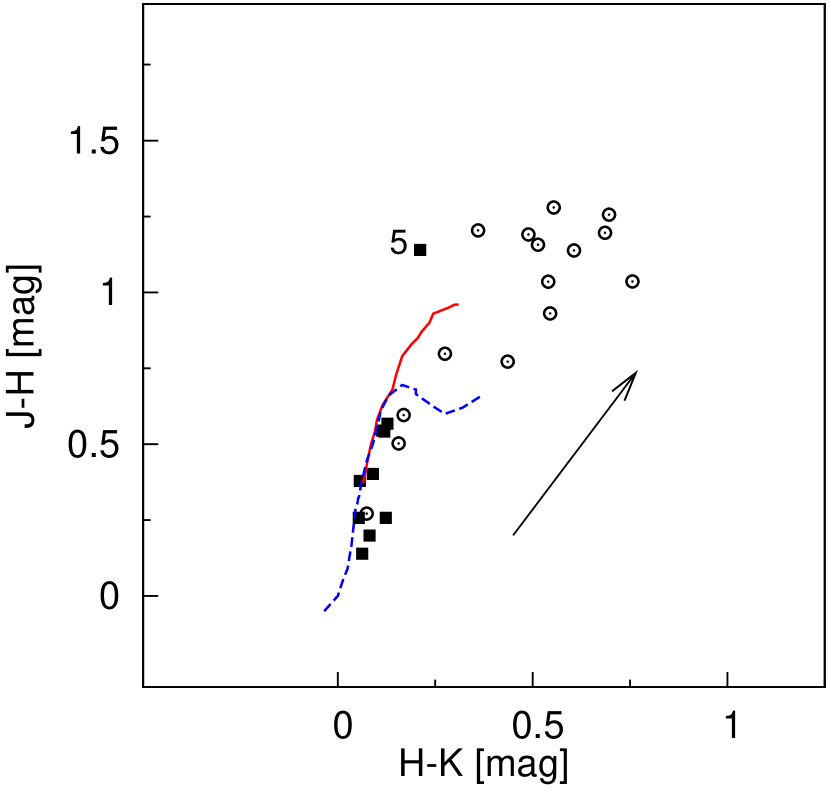
Star 5: 22275268-0418586 (catalog ) is HD 212913 (catalog ) and IRAS 22252-0434 (catalog ), for which no literature exists except a generic late M spectral type. The Tycho-2 (Høg et al., 2000) parallax values seem to place this star at 300 pc, thus hinting at a giant star. The star is not in the Bulge and is below the galactic disk, yet its location in Fig. 2 is peculiar and indicative of substantial reddening. We attempted fits to our light curve with a binary, a resolved diameter, and a diameter plus companion models. The first one gave the best normalized and is the one we adopt in our results.
Star 12: 10220366+0515554 (catalog ) was included in Tycho-2 as TYC 252-1217-1 (catalog ). However, no binarity was detected, including in the subsequent dedicated re-analysis of the Tycho Double Star Catalogue (Fabricius et al., 2002). No literature references were found for this source.
Star 13: 10070867+0628201 (catalog ) is TYC 250-82-1 (catalog ). In spite of the relatively large measured projected separation, no binarity was detected in Tycho 2. No literature references are present for this source.

Star 15: 17395562-2303408 (catalog ) is HD 160257 (catalog ), a bright, nearby, G2V-type star. It was classified as a pre-main sequence star by Torres et al. (2006), on the basis of X-Ray emission and high resolution spectra. We find it to to be binary with a rather large projected separation (see Fig. 3). It was observed by Hipparcos as HIP 86455 (catalog ), but no binarity was found. As for the recent case of new binaries in the Pleiades (Richichi et al., 2012a), this shows the potential of LO to further extend the statistics of binarity among young stars in the context of multiple star formation mechanisms.
Star 16: 18142147-2207047 (catalog ) is the infrared source IRAS 18113-2208 (catalog ). No literature references were found for this source. It is also the binary with the largest magnitude difference in our sample, K=5.4 mag against a dynamic range of 5.8 mag.
Star 21: 17371972-2215045 (catalog ) is the infrared source IRAS 17343-2213 (catalog ), also measured by the AKARI satellite. There are no bibliographical references. It is one of the reddest sources in our sample, having J-K=1.8 mag from 2MASS. Our recorded flux shows an increase of 80% above the 2MASS Ks magnitude (cfr. Fig. 1), pointing to possible variability. The detection of the 3.2 mag fainter companion with 7 mas projected separation is shown in Fig. 4. In the lower panel of the figure, note that the CAL algorithm preserves the integrated flux ratios, not the peaks in the brightness profile.

Star 23: 18395035-2052114 (catalog ) is the star with the largest projected separation in our list, , however it does not seem to have been detected before in spite of being relatively bright. The 1:23 brightness ratio in the K-band, and possibly more at visual wavelengths, could be one reason. Concerning projection effects of a nearby field star, we have investigated images from DSS, HST and 2MASS without evidence of other stars within the ISAAC subwindow.
Star 24: KO Sgr (catalog ), also identified as IRAS 18375-2042 (catalog ), was found to have a regular period of 312 days by Hoffleit (1960) and thus tentatively classified as a Mira-type star. The same author, however, noted the peculiarity of rather steep increases in luminosity, and the relatively short-lived maxima. She suggested the possibility of a companion in a cataclysmic system, or just a visual association. In this scenario, the light at minimum would come mostly from the secondary. The photographic magnitude difference between minima and maxima is about 3.1 mag. Using the Hoffleit photometric period, our observation would have occurred at phase 0.8 or just before the onset of the outburst-like maximum. Uncertainties are possible due to the 100 cycles intervened since Hoffleit’s first determination, but are not easy to estimate. Data in the AAVSO database are also not very complete. Under the above assumptions, the K=4.7 mag would point to a primary much redder than the secondary, consistent with the scenario outlined in Hoffleit (1960).
We also recorded a LO light curve of 08550318+1346301 (catalog ) = BD+14 1995 (catalog ) on April 13, 2011 (star P87-010 in our database), detecting a well-separated companion with mas projected separation along PA=. The 2MASS-based magnitudes of the two components are K=9.04 and K=10.31. This is listed as the wide double WDS J08551+1347 (catalog ) (Mason et al., 2001), without orbital parameters and with a separation of . Given the wide nature of this binary, we did not include it in our tables and figures, and we mention our results only as a complement to the previous observations.
4 Discussion and Conclusions
Richichi et al. (2012b) list the sources observed in the same program and found to be unresolved, covering also the period under consideration here. From the first to the last night considered in Table 1, a total of 403 LO light curves were observed at the VLT with ISAAC, therefore our serendipitous binary detection fraction is (26/403) %. Restricting ourselves to the purely random service mode observations, the number is (19/231) %. We note that the visitor mode targets were in crowded and extincted regions in, and consequently mostly deep into, the Galactic Bulge, with a median K=6.4 mag. By contrast, the service mode targets were randomly scattered and with median K=8.0 mag. One possible reason for the higher incidence of binaries among the service mode targets is that they are statistically closer to us, therefore providing a better spatial scale for the same angular resolution.
In a previous work based on a comparable volume of LO observed also in the near-IR in subarray fast mode from Calar Alto (Richichi et al., 2006), it was found that the serendipitous binary detection frequency was significantly smaller than the present one, %. The difference can be justified in principle with the lower sensitivity (limiting K mag then, and mag here) and the slower time sampling ( ms then, against 3.2 ms here). However, both cases appear to have an inferior yield of binary stars than observations by a fast photometer: e.g., Richichi et al. (1996) using the TIRGO 1.5 m telescope found (26/157) % binary detection frequency. The explanation in this case is that the targets were brighter, being selected prior to the availability of the 2MASS catalog, with average K mag. Hence, the sources were generally significantly closer to us than in the present study.
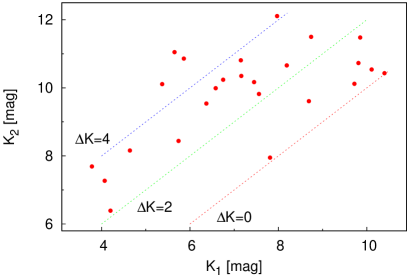
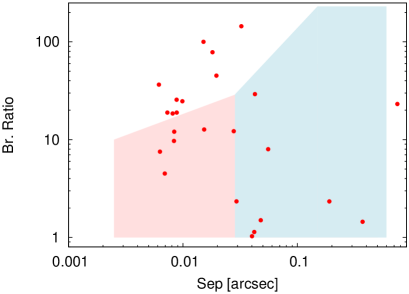
The flux ratios of the binaries in our list range from K=0.0 to 5.4 mag, with a median of 2.8 mag. From Fig. 5 it can be seen that half of the sample falls in the range 24 mag. As for the separations, LO can measure only projected values, and the median for our sample is 18 mas. Considering a random projection correction of 2/, about half of our binaries would remain inaccessible to techniques with less than resolution. This corresponds, e.g., to the K-band diffraction limit of a 12 m telescope. Long-baseline interferometry at some of the largest facilities can provide the necessary angular resolution, but it suffers from a sensitivity which is significantly more limited than for LO and in general from a reduced dynamic range. We outline schematically the situation in Fig. 6. From the figure, it can be estimated that only about 2/3 of the sources in our list might be effectively followed up by independent methods.
In conclusion, we find from the present work as well as from previous similar research that a routine program of random LO with an IR detector operated in subarray mode at an 8 m-class telescope with time resolution of order 3 ms can detect companions to stars in the general field down to a sensitivity K mag, with separations as small as a few milliarcseconds (at least 10 times better than the diffraction limit of the telescope). The expected detection frequency can range from % in distant regions such as deep in the Galactic Bulge, to % in areas closer to the solar neighbourhood.
Most of these binaries or multiples turn out to be new detections, with limited cross-identifications, spectral determinations and previous literature. Due to the small separations and high brightness ratios, only up to % of these LO-detected binaries can be followed up by other more flexible methods such as adaptive optics and interferometry. A significant fraction of such new binary detections will remain isolated until significantly larger telescopes or more sensitive interferometers become available.
References
- Bessell & Brett (1988) Bessell, M. S., & Brett, J. M. 1988, PASP, 100, 1134
- Fabricius et al. (2002) Fabricius, C., Høg, E., Makarov, V. V., et al. 2002, A&A, 384, 180
- Hoffleit (1960) Hoffleit, D. 1960, AJ, 65, 100
- Høg et al. (2000) Høg, E., Fabricius, C., Makarov, V. V., et al. 2000, A&A, 357, 367
- Mason et al. (2001) Mason, B. D., Wycoff, G. L., Hartkopf, W. I., Douglass, G. G., & Worley, C. E. 2001, AJ, 122, 3466
- Richichi (1989) Richichi, A. 1989, A&A, 226, 366
- Richichi et al. (1996) Richichi, A., Baffa, C., Calamai, G., & Lisi, F. 1996, AJ, 112, 2786
- Richichi et al. (2005) Richichi, A., Percheron, I., & Khristoforova, M. 2005, A&A, 431, 773
- Richichi et al. (2006) Richichi, A., Fors, O., Merino, M., et al. 2006, A&A, 445, 1081
- Richichi et al. (2011) Richichi, A., Chen, W. P., Fors, O., & Wang, P. F. 2011, A&A, 532, A101
- Richichi et al. (2012a) Richichi, A., Chen, W. P., Cusano, F., et al. 2012a, A&A, 541, A96
- Richichi et al. (2012b) Richichi, A., Cusano, F., Fors, O., Moerchen, M. 2012b, ApJS, 203, 33
- Rieke et al. (1985) Rieke, G. H., & Lebofsky, M. J. 1985, ApJ, 288, 618
- Torres et al. (2006) Torres, C. A. O., Quast, G. R., da Silva, L., et al. 2006, A&A, 460, 695