Intergalactic magnetic fields in Stephan’s Quintet
Abstract
We present results of the VLA radio continuum total power and polarised intensity observations of Stephan’s Quintet at 1.43 and 4.86 GHz along with complementary 4.85 and 8.35 GHz Effelsberg observations. Our study shows a large envelope of radio emission encompassing all the member galaxies and hence a large volume of intergalactic matter. Infall of the galaxy NGC 7318B produces a ridge of intergalactic, polarised emission, for which the magnetic field strength was estimated as G, with an ordered component of G. The energy density of the field within the ridge area is of the same order as estimates of the thermal component, implying a significant role of the magnetic field in the dynamics of the intergalactic matter. We also report that the tidal dwarf galaxy candidate SQ-B possesses a strong and highly anisotropic magnetic field with the total strength being equal to G and an ordered component reaching G, which is comparable to that found in normal-sized galaxies.
keywords:
galaxies: magnetic fields – galaxies: groups: individual: HGC 92, Stephan’s Quintet – galaxies: interactions – intergalactic medium – radio continuum: galaxies – polarisation1 Introduction
Intergalactic magnetic fields are among the least studied phenomena related to galaxy groups. Only a limited sample of such objects has yet been studied at radio wavelengths. All these studies (e.g. Xu et al. 2003, Giacintucci et al. 2012) focused on the total power (TP) emission, not taking the polarised intensity (PI) into account.
Detection of intergalactic polarised emission is an important issue. Polarisation is caused by magnetic fields showing some degree of ordering. This may mean either genuinely unidirectional fields (called ”regular”, no reversals of its lines) or by squeezed/stretched random fields, having a preferred direction of fluctuations but frequent reversals. The latter are called ”anisotropic” fields. The existence of a unidirectional field suggests that it originated in galaxies hosting large-scale dynamos. Such a magnetic field is recognised by non-zero Faraday rotation measures (RM), while a lack of measurable RM indicates the generation of a twisted magnetic field, possibly compressed by intergalactic shocks (Chyży et al., 2000). The discrimination is possible by determining the RM via multifrequency polarisation observations or by using the RM synthesis method (Brentjens & de Bruyn, 2005). Moreover, the polarised emission provides an extremely sensitive tool to reveal possible gas compression and shearing flows that cause the magnetic field to be aligned along the compression front and/or perpendicular to the velocity gradients (Urbanik 2005, Weżgowiec et al. 2012).
Stephan’s Quintet (located approximately 85 Mpc from the Milky Way, Hickson et al. 1992) is one of several galaxy groups that possibly host intergalactic magnetic fields, with magnificent dust tails emerging from NGC 7319. Additionally, it contains a radio ridge produced by the interactions with infalling NGC 7318B galaxy (Xu et al., 2003), as well as a large-scale Hi tail overlapping the interloper galaxy NGC 7320 (Williams, Yun & Verdes-Montenegro, 2002).
Since its discovery in 1877, Stephan’s Quintet, named after its discoverer Èdouard Jean-Marie Stephan, has been subject to extensive, multiwavelength studies, much more detailed than for any other compact group. Denoted HCG 92 (Hickson, 1982), the group is known to exhibit numerous interaction-related phenomena, such as changes in galaxies’ morphology, starburst activity (Xu et al. 2003), gas outflows visible in various regimes (Williams et al. 2002, Xu et al. 2003, Natale et al. 2012, Guillard et al. 2012), and possible shock compression (Appleton et al. 2006, O’Sullivan et al. 2009). The group is also clearly visible in radio continuum (Williams et al., 2002) and a careful study of the New VLA Sky Survey (NVSS) data shows some hints for polarised emission at 1.4 GHz (Condon et al., 1998).
Several radio continuum studies of the Quintet and its member galaxies have been performed since 1972 (Arp 1972, Allen & Hartsuiker 1972). The most recent ones are the high-resolution study of the active galactic nuclei in NGC 7319 (Aoki et al., 1999) and that of the extended emission at 1.43 and 4.86 GHz (Xu et al., 2003). The authors of the latter study presented images of the TP emission, made using the Very Large Array (VLA) interferometer in its B and C configurations. These images show a large-scale radio emitting ridge between NGC 7318B and NGC 7319 at both wavelengths, coincident with a UV emitting region and X-ray features (presented by Trinchieri et al. 2003, 2005 and O’Sullivan et al. 2009). Their high–resolution configurations of the VLA caused a substantial flux loss, and most of the extended emission was not detected. Moreover, the weak polarised emission (marginally visible in the NVSS map) remained undetected.
The distribution of the magnetic field (together with the X-ray morphology) of the Quintet has recently been simulated by Geng et al. (2012). Both models adapted by these authors (one from Renaud, Appleton & Xu 2010, the other from Hwang et al. 2012) suggest a collisional origin of the shock region and a significant magnetic field between NGC 7319 and NGC 7318B.
In this paper we present observations of Stephan’s Quintet made using the VLA D-array, sensitive to the extended emission with a special attention paid to polarisation. The observations were performed at two different frequencies: 1.43 and 4.86 GHz. Additionally, we made single-dish observations using the 100m Effelsberg radiotelescope at 4.85 and 8.35 GHz.
2 Observations and data reduction
2.1 Interferometric observations
The 4.86 GHz data were obtained in August 2008 using the Very Large Array (VLA) of the National Radio Astronomy Observatory (NRAO)111NRAO is a facility of National Science Foundation operated under cooperative agreement by Associated Universities, Inc. in the D-array configuration. The total on-source time (TOS) was 21.5 hours. The 1.43 GHz data were also acquired using the D-array, with TOS of 4 hours; moreover, we have been granted 3.5 hours in dynamic time allocation mode (CD- and D-array), obtained between February and April 2007. In both cases the bandwidth was 250 MHz, centred at 4835 and 4885 MHz in C-band, and 1385 and 1465 in L-band.
The data were reduced using the Astronomical Image Processing System (AIPS) and calibrated using 3C 48 at 1.43 and 3C 286 at 4.86 GHz as the flux and polarisation position angle calibrators. The nearby point source 2236+284 was used as a phase and instrumental polarisation calibrator. For the 4.86 GHz data, we made a set of Stokes I, Q, and U maps using Briggs weighting (robust parameter = 3), yielding a beamsize of arcsec. These maps were later convolved to a circular beam of 20 arcsec. We also produced a uniformly weighted map of Stokes I channel, with a beam of 6.8 arcsec. The lower resolution set was used to produce distributions of diffuse TP and PI emission, while the uniformly weighted map shows details of the TP emission. At 1.43 GHz maps in all Stokes parameters were convolved to a common beam of 42 arcsec. Finally, the U and Q maps at both frequencies were combined to yield the distributions of polarised intensity (PI) and polarisation angle.
2.2 Single dish observations
Single-dish mapping of the Quintet was done using the 100m radiotelescope at Effelsberg222Based on observations with the 100m telescope of the MPIfR (Max-Planck-Institut für Radioastronomie) at Effelsberg. Observations were performed at 8.35 GHz, using a single-beam receiver installed in the secondary focus of the telescope. The bandwidth was 1.1 GHz and the final resolution (after some convolution) is 85 arcsec. In order to produce the final map, 27 coverages were obtained, each of size arcmin, scanned alternatively along R.A. and Dec. The scanning velocity was 30 arcsec and the grid spacing was 30 arcsec. All coverages were combined in the Fourier domain to reduce the scanning effects (Emerson & Gräve, 1988), for the Stokes parameters I, Q, and U separately. Again, we obtained maps of the polarised intensity and polarisation angle from our combined U and Q data. The flux density scale was established using the source 3C 286, according to the flux values given by Baars et al. (1977). Additional GHz mapping has also been performed in order to provide the zero-spacing information that is missing in the interferometric data. These complementary single-dish observations yielded no larger integrated total flux, indicating that there were no flux losses in the interferometric data, so that no merging was performed.
As the uncertainties of the flux values based on the r.m.s. noise levels have turned out to be small compared to the uncertainties of the calibration, we assume a 5 per cent error for each integrated flux value for the radio maps. The noise levels obtained for all radio maps are presented in Table 1.
| Freq. | (TP) | (Stokes | (PI) | beam | telescope/ | |
|---|---|---|---|---|---|---|
| Q and U) | size | config. | ||||
| [GHz] | [] | [] | [] | [arcsec] | ||
| 8.35 | 100 | 48 | 54 | 71 | 85 | Effelsberg |
| 4.86 | 6 | 6 | 6 | 6 | 20 | D-array |
| 1.43 | 110 | 22 | 24 | 32 | 42 | CD&D-array |
2.3 The X-ray map
To further characterise the magnetic field in the ridge (which is considered to be formed by shock compression, O’Sullivan et al. 2009), a map of emission in the X-ray regime has been created using archival data from CHANDRA (Program no. 7924, PI: Vrtilek 2006). The data were taken from the Project Archive and then reprocessed using CIAO software ver. 4.3. The data were collected in the VFAINT mode, applicable for tracing the weak extended emission. The set was cleaned for bad events; the total exposure time is 93.2 ks. We have created an image in the soft X-ray regime (0.4–3 keV), later smoothed using the csmooth tool.
3 Results
In this paper we use the term “apparent polarisation B–vectors”, defined as the observed polarisation E–vectors direction rotated by , uncorrected for the Faraday rotation, except for the maps in Sect. 4.
3.1 Total power emission at 4.86 GHz
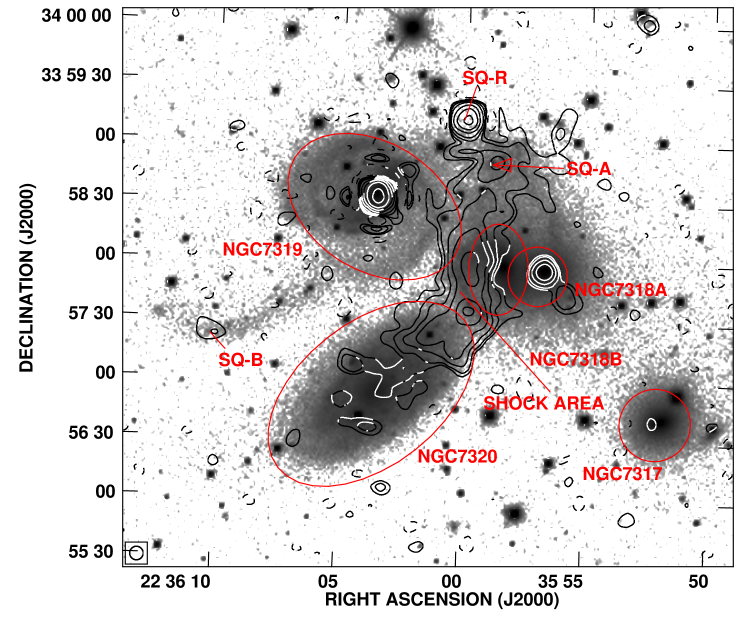
The total power (TP) maps of HCG 92 at 4.86 GHz are shown in Fig. 1 and Fig. 2. The high resolution map (HPBW of 6.8 arcsec) shows two bright point sources and some extended emission.
The most important structure in this study is the intergalactic emission ridge located between the galaxies forming the group, near and . In the observations by Xu et al. (2003), the structure of the ridge is similar to one presented in Fig. 1. Integrating the flux within the same boundaries, we have obtained mJy, very similar to their value of mJy.
The brightest source in the map (located at , ) is the core of the Seyfert type 2 galaxy NGC 7319. The core is barely resolved and its flux of mJy agrees with the value given by Aoki et al. (1999).
The mJy peak at , is the core of NGC 7318A. The flux is higher than presented by Xu ( mJy) which may indicate the presence of an extended structure or variability.
In the northern part of the group, a strong point source near , can be seen. The peak represents an unresolved double radio source, denoted SQ-R by Xu et al. (2003), most probably unrelated to the group. Our 4.86 GHz total flux of mJy remains in very good agreement with the value of mJy obtained by Xu et al. (2003).
South of SQ-R, a weak peak near and represents the SQ-A starburst region. Its flux of mJy is in excellent agreement with mJy obtained by Xu et al. (2003).
More extended emission can be seen in the lower resolution map (Fig. 2). The second starburst region, SQ-B (which is likely a part of the tidal arm – a remnant of the past interactions with NGC 7320C), located at , has an integrated flux of mJy, which is similar to the value given by Xu ( mJy). Comparison with our uniformly weighted map (Fig. 1) shows the presence of the extended, diffuse emission in that region.
In the southern part of the group, the diffuse emission terminates near the outskirts of the interloper galaxy NGC 7320. The Hi emission studies by Williams et al. (2002) show that the southern part of the group is connected to an Hi tail, extending eastwards from the group and containing the SQ-B starburst region. Unfortunately, our map does not allow a reliable discrimination whether or how the radio emission is connected to the interloper galaxy (this issue is discussed in Sect. 4.1.4).
The envelope of diffuse emission has an extension towards the western edge, which has no counterpart in the optical regime. The extension is located near , . The lower resolution map shows another extension – towards the eastern part of the group, overlapping the spiral arm of NGC 7319.
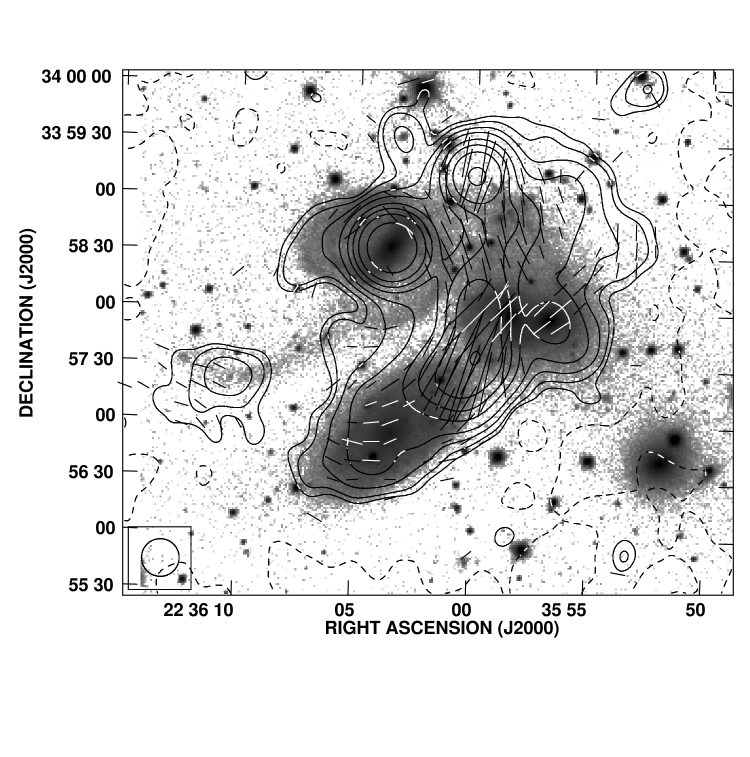
3.2 Distribution of the polarised intensity at 4.86 GHz
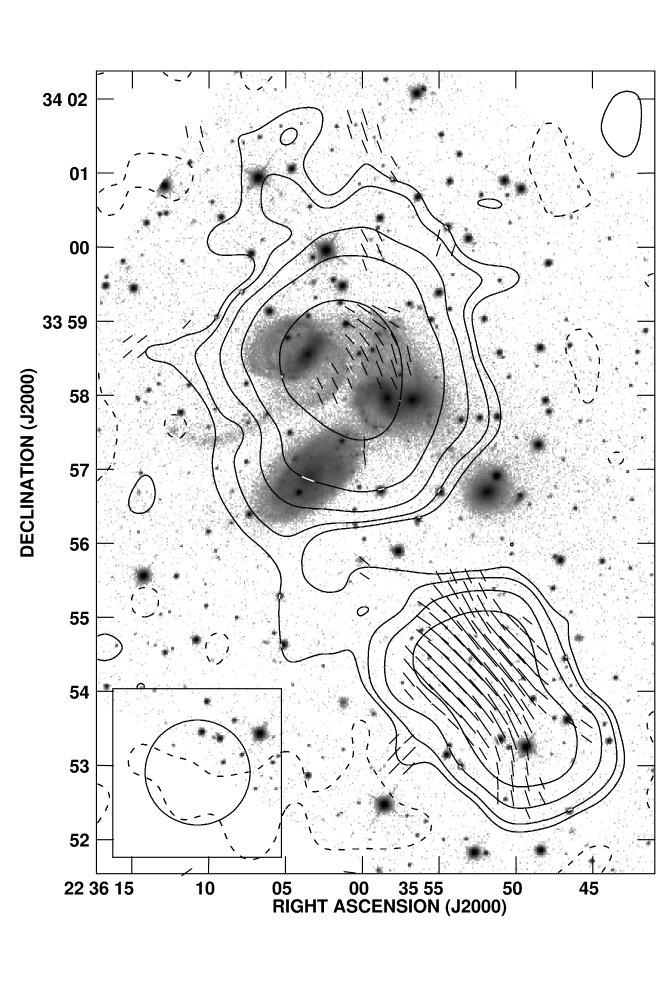
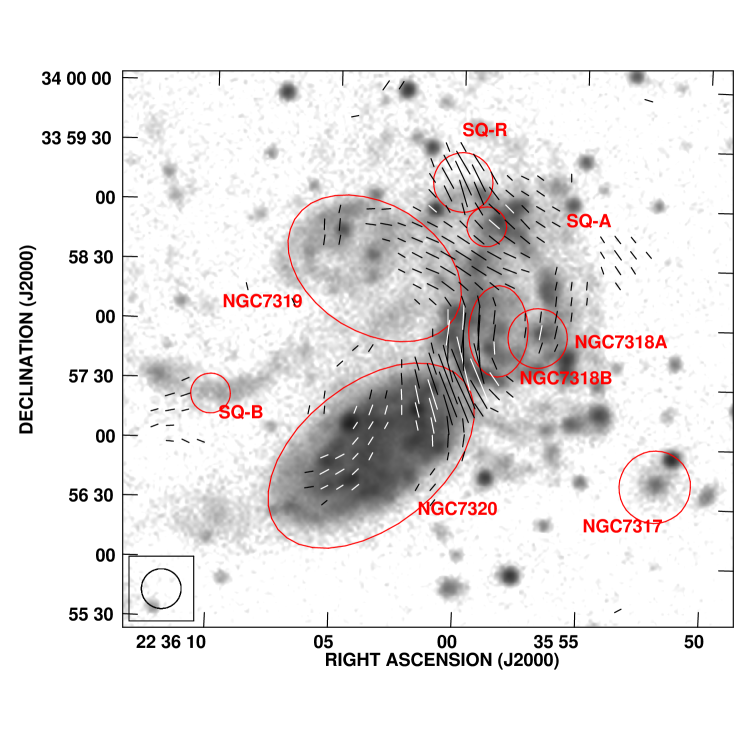
Figure 3 shows contours of the polarised intensity (PI) distribution overlaid on a greyscale optical image with the apparent B–vectors proportional to the polarisation degree. The most prominent structure is the emission ridge with a mean polarisation degree around 4–5 per cent. The ridge is a part of an extended structure, filling also a large volume between NGC 7318A and NGC 7319 as well as the SQ-R source. The polarisation degree of the latter is approximately 3 per cent.
Whereas the core of NGC 7319 and the galaxy itself seem to be unpolarised, the core of NGC 7318A is present in the PI distribution map, with a polarisation degree of approximately 6 per cent (averaged over the central area). The 4.86 GHz PI distribution shows also a large pool of polarised emission north from the ridge. The western extension of the TP envelope is also visible in our PI map.
East of the group, a spot of polarised emission spatially coincident with SQ-B can be seen. The polarisation fraction of this source reaches 33 per cent.
3.3 Total power and polarised emission at 1.43 GHz
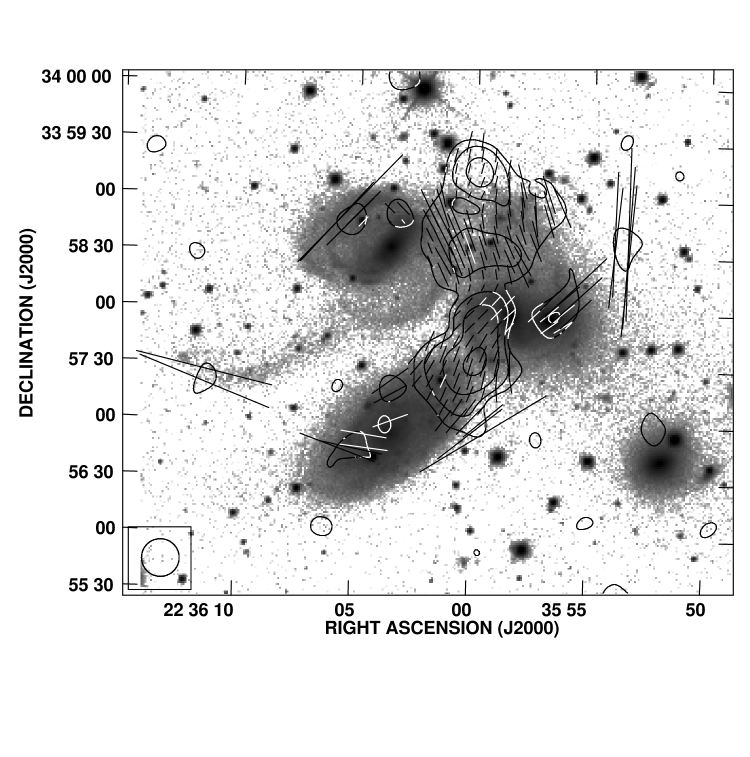
The TP map of HCG 92 at 1.43 GHz with superimposed apparent polarisation B–vectors is shown in Fig. 4. The resolution is considerably lower and this enables to trace the emission further out. Two point sources can be easily distinguished from the surrounding emission, namely the core of NGC 7319 and SQ-R. The flux of the first one, estimated by a Gaussian fit centred on the galactic core, is mJy and is therefore slightly higher than 28.5 mJy given by Aoki et al. (1999) and by Xu et al. (2003).
Polarised emission from the ridge has not been detected at this frequency. Instead, weak emission is present in the tidal tail of NGC 7319. However, due to large depolarisation (Sect. 4.2), we were unable to produce sufficiently reliable maps of the polarised intensity.
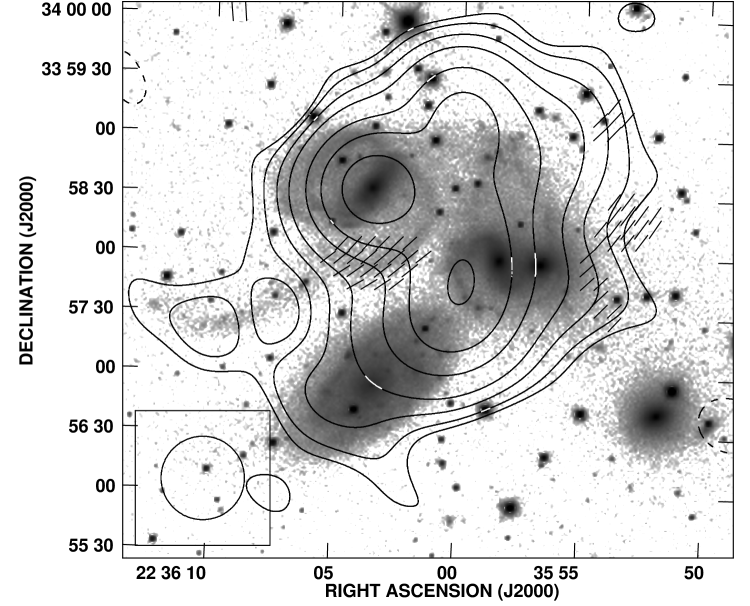
3.4 Total power and polarised emission at 8.35 GHz
The TP emission distribution at 8.35 GHz is shown in Fig. 5. Despite the lower (compared to the VLA) resolution, one can easily notice that the total emission contours correspond fairly well to the ones seen at 1.43 and 4.86 GHz. The polarised emission exceeds the 3 r.m.s. level only at distinct regions in the group area, like between NGC 7319 and NGC 7318A.
The strong and polarised background source J223552+335425 located south of Stephan Quintet was used to determine the foreground rotation measure (RM). The best fit to the polarisation angles of this source at all three frequencies (1.43, 4.86, and 8.35 GHz) yields a RM of 182 rad m-2, which agrees well with the values measured in the vicinity of the group (Taylor, Stil & Sunstrum, 2009). With a value of 182 rad m-2 the polarisation angle is rotated more than 360° at 1.43, 40° at 4.86, and not more than 14° at 8.35 GHz.
4 Discussion
4.1 Spectral index
In order to calculate the spectral index distribution, we added to our 1.43 GHz observations the datasets obtained by Xu et al. (2003) in VLA B-configuration at the same frequency, taken from the NRAO archive. Combination of all available data at 1.43 GHz yields maps with similar resolution as at 4.86 GHz. Maps at both frequencies were convolved with a Gaussian function to obtain a final circular beam with a HPBW of 20 arcsec (small enough to distinguish point-source emission from the extended one). An additional map, with a beam of 42 arcsec, has been made in order to provide information about the regions of weak, diffuse emission, not visible in the high resolution map. The spectral index distribution is shown in Fig. 6. Throughout the paper we are using the definition of the spectral index .
| Emission | ||
|---|---|---|
| Total | 1.1 0.2 | 1.1 0.2 |
| Point | 0.8 0.2 | 0.6 0.2 |
| Diffuse | 1.2 0.2 | 1.7 0.2 |
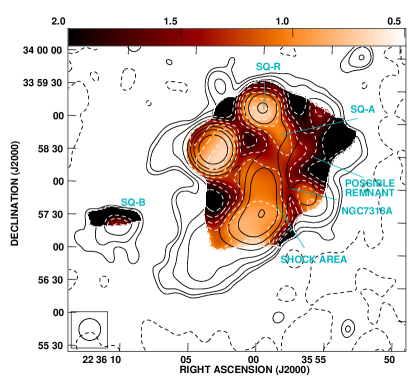
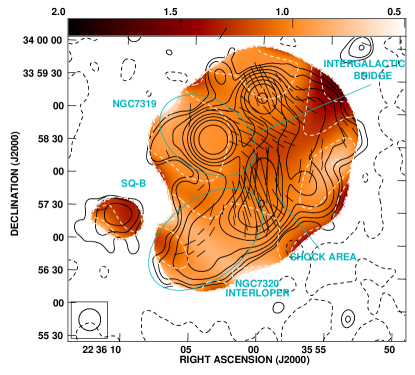
Left panel: High resolution (20 arcsec) map; Right panel: Low resolution (42 arcsec) map with B–vectors of the magnetic field at 4.86 GHz corrected for the foreground Faraday rotation. In both panels the radio emission contour levels are (r.m.s. noise level). The spectral index contour levels are . A polarisation vector (in the right panel) of 1 arcsec corresponds to a polarised intensity of . The clip limit for the vectors is (2.5 PI noise level).
4.1.1 Point sources
The spectral index of the core of NGC 7319 – approximately – is, within the errors, consistent with the value given by Xu et al. (2003). The lower resolution map allows to compute the spectral index also in the area of the spiral arm, where , so a value reasonable for galactic synchrotron emission.
The resolution of 20 arcsec is high enough to measure the spectral index for the background source SQ-R. The value of agrees very well with given by Xu et al. (2003).
The core of NGC 7318A is surrounded by steep-spectrum emission. The spectral index derived for the region close to the peak of the emission is , being substantially higher than the value given by Xu (), possibly indicating the presence of a diffuse, steep-spectrum component in our 1.43 GHz map.
4.1.2 Star Formation Regions
SQ-B region is marginally visible in the high resolution map, but it can be clearly seen in the lower resolution image. The spectral index of this region is approximately ; a value somewhat higher than measured by Xu et al. (2003) – – but still within the measurement uncertainties. Our low resolution TP map shows more extended diffuse emission. As the beam is about three times larger than in the study cited, the integrated flux value represents now not only the point source, but has also a contribution from the diffuse structure around. A diffuse, steep-spectrum emission ( = 1.4) contribution of about 50 per cent in our larger beam map would explain the difference.
The area of the flatter spectrum within the intergalactic emission, which is spatially correlated with the SQ-A region, can be distinguished from the surrounding emission only in the high resolution map. The value obtained for the region () is somewhat higher than given by Xu (), but as in case of SQ–B, within the given uncertainties. This again may be due to a contamination of extended, steep spectrum emission, like in the case of SQ-B.
4.1.3 Intra-group emission
The emission ridge is clearly visible both in high and low resolution maps. The spectrum steepens from approximately near the southern boundaries to – in the central part. The mean spectral index of this region is equal to and is consistent within the errors to the value obtained by Xu ().
The 20 arcsec resolution is sufficient to separate the point sources from the diffuse emission, allowing to determine the spectral index. The values vary from in the central part to in the outskirts, and are typical for an ageing population of synchrotron electrons.
The western extension coincides with a region that shows a significantly steeper spectrum with a mean index of . Such steep spectrum indicates that this region can be a remnant of a past interaction within the group, as it shows effects of spectral ageing. The PI distribution map (Fig. 3) shows a high degree of polarisation of that region, approximately 40 per cent.
The mean spectral index of the whole diffuse emission of the group has been determined by calculating the total flux of the radio envelope in each of the three frequencies (taking into account only those regions that are visible over the 3 r.m.s. level) and then subtracting the flux of all point sources (taken from Aoki et al. 1999 and Xu et al. 2003). The obtained values are given in Table 2. The table shows a steepening of the diffuse emission spectrum with increasing frequency. This is a phenomenon typical for ageing particles in the intergalactic medium (as mentioned above, the steepening occurs due to electron energy losses, see e.g. Pacholczyk 1973). Any significant thermal component would manifest a substantial flattening of the spectrum between higher frequencies, which is not the case here.
4.1.4 Hi tail or an interloper galaxy?
The low resolution map (Fig. 6, right panel) was made to visualise the spectral index of the diffuse emission regions, which have a surface brightness too low to be visible in the high resolution map. One of them is the southern extension, where the Hi tail overlaps the galaxy NGC 7320 (Williams et al., 2002). The measured of approximately is a relatively flat spectrum (similar to NGC 7318A and NGC 7319), suggesting that the emission is related rather to the star–forming interloper galaxy than to an intergalactic structure. The polarised fraction of this region reaches 13 per cent, as mentioned in Sect. 3.2. Fig. 8 demonstrates the alignment of the vectors in the southern tail of the group. The vectors form an arc bending in the eastern direction, matching the Hi tail. The arc itself is connected to the vectors overlapping the shock area. However, as the inclination of NGC 7320 is approximately , this may only be a projection of the magnetic field lines of the foreground galaxy.
NGC 7320 is an example of a late-type, slowly rotating, low-mass system (Paturel et al. 2003), similar to the galaxies described by Chyży et al. (2007). Such galaxies are characterised by a relatively flat spectral index (). If such radiation is overlapping the one from the Hi tail, a combination of the two components (assuming that 30 % of the flux comes from interloper galaxy) would explain the observed value of the spectral index.
4.2 Faraday Depolarisation
As the PI distribution map at 1.43 GHz shows very weak polarised emission (see Sect. 3.3), we decided to estimate the depolarisation level between 1.43 and 4.86 GHz. We use the term “depolarisation” defined as , where refers to the polarisation degree at a given frequency. As both maps were made with the same beamsize, such a definition makes this parameter independent of beam depolarisation. The mean depolarisation of the radio–emitting envelope between 1.43 and 4.86 GHz is equal to 0.84. In contrast, the background source J223552+335425 shows depolarisation of only 40 per cent.
The exact values can be affected by differences in the bandwidth depolarisation at both frequencies, but this effect cannot affect the variation of with position in the map. These values indicate that the depolarisation caused by the foreground Faraday dispersion is not likely to explain the high degradation of the polarised emission estimated for the Quintet. The alternative explanation is that the depolarisation in the group is caused either by Faraday rotation inside Stephan’s Quintet or by internal Faraday dispersion. The first possibility is that the intergalactic space in the Quintet hosts a substantial unidirectional, dynamo–type magnetic field. However, the present data do not allow to disregard the scenario of depolarisation via Faraday dispersion. Moreover, there is a possibility that the depolarisation estimate for the background source is influenced by its internal depolarisation. Furthermore, the foreground depolarisation distribution might be patchy. The RM Synthesis method (as described by Brentjens & de Bruyn 2005) will probably be able to distinguish between those two mechanisms, but it needs much better frequency coverage and higher resolution than offered by the existing data.
4.3 Magnetic field strengths in the Quintet
The strength of the magnetic field and its energy density were calculated from the 4.86 GHz data, assuming energy equipartition between the cosmic rays and the magnetic field, following the formulae presented in Beck & Krause (2005). The chosen values of the parameters (total pathlenght , proton–to–electron energy density ratio , spectral index , 4.86 GHz flux , and the polarisation degree ) for each of the regions are presented in Table 3. The same table contains also calculated total and ordered field strength as well as the magnetic field energy density in each case.
| Region | D[kpc] | [mJy] | [] | [G] | [G] | [] | ||
|---|---|---|---|---|---|---|---|---|
| Ridge | 12.5 2.5 | 100 50 | 1.1 0.15 | 10.6 0.6 | 5 | |||
| SQ-A | 6 3 | 100 | 1.1 0.1 | 0.32 0.02 | —— | ———— | ||
| SQ-B | 6 3 | 100 | 1.2 0.2 | 0.16 0.01 | 33 | |||
| Group | 32 6 | 100 | 1.2 0.2 | 4.6 0.6 | 2 |
4.3.1 Magnetic field in the ridge
The pathlength through the ridge was estimated to be 10–15 kpc (based on the size of the shock region from the high resolution radio map and assuming cylindrical symmetry). The flux and spectral index were taken from our VLA data. As the spectrum is relatively steep, the thermal fraction contribution is negligible. The problem arises with the value of the coefficient. Its value depends on the strength of a shock and for strong shocks (compression ratio ) reaches 40–100. Assuming , the total magnetic field strength in the ridge is G with an ordered component of G. It is, however, not certain if the shock in the Quintet is a strong or a weak one, as weak shocks would also be able to produce the observed X-ray properties of the group (see O’Sullivan et al. 2009, Sect. 5.3, for a detailed discussion). In that case, the value would be much higher (even by several orders of magnitude). For relatively weak shocks (), the magnetic field strength would increase more than three times.
The total magnetic energy density of the shock area was estimated as . The thermal energy of the shock area was estimated from the X-ray data using the temperature of 0.6 keV and gas density of cm-3 taken from O’Sullivan et al. (2009), yielding value of . This means that the magnetic field plays an important role in the dynamics of the intergalactic medium (IGM) – contrary to the statement by Xu et al. (2003). Its contribution to the total energy, comparable to the thermal component, proves that it is necessary to take the magnetic field into account while performing simulations of the intra-group medium.
4.3.2 Magnetic field in the tidal dwarf galaxy
Stephan’s Quintet is known to be a host group for at least 13 TDG candidates, located in the tidal tail connected to NGC 7319 (Hunsberger et al., 1996). One of them is the star formation region SQ-B. For SQ-B we calculated the properties of the magnetic field under the assumption that the ratio is equal to 100, as we do not expect the field to be produced by secondary electrons or shocks (see Beck & Krause 2005 for details). The total pathlength through the emitting volume was chosen to be equal to kpc. The flux and spectral index were taken from our VLA data. As the spectrum is relatively steep (), the thermal fraction contribution is negligible.
The magnetic field of the TDG candidate is relatively strong (G), similar to the ones found in normal-sized spiral galaxies, for which the median value is G (Niklas, 1995). The ordered component (reaching G) is also significant, as polarisation degree is substantial (33 per cent).
The strength of the magnetic field and its anisotropy suggest an in situ amplification of the field in the TDG candidate. The presence of the star formation and the shearing flow of re-accreting of plasma debris left by the passage of NGC 7320C can efficiently amplify the magnetic field even if we assume a low mass and slow rotation of a dwarf galaxy (Siejkowski et al., 2010). Given that the debris plasma is likely to have already been magnetised, the amplification process could result in values as high as in normal galaxies.
The second starburst region, SQ-A, lies inside an extended polarised region. Hence, it cannot be distinguished from the surrounding emission. The total magnetic field strength of this region was estimated as G. This translates into a magnetic field energy density of .
4.3.3 Mean magnetic field in the group area
In order to estimate the mean magnetic field in the group area, we have subtracted the point sources (from Aoki et al. 1999) and the ridge area, and then clipped the resulting map at the level of approximately to obtain the integrated flux of the group. The pathlength was adopted as equal to the separation between the galaxies originally forming the Quintet (NGC 7317, NGC 7318A, and NGC 7319), was adopted as 100. The spectral index was taken from our VLA data. As the spectrum is relatively steep, we decided to neglect the thermal flux contribution. We estimated the strength of total magnetic field to be G with an ordered component of G, indicating an energy density of . The magnetic field in the intergalactic space is of similar strength as in the star forming regions SQ-A and SQ-B.
4.3.4 Shock compression as a possible origin of the magnetic field in the ridge
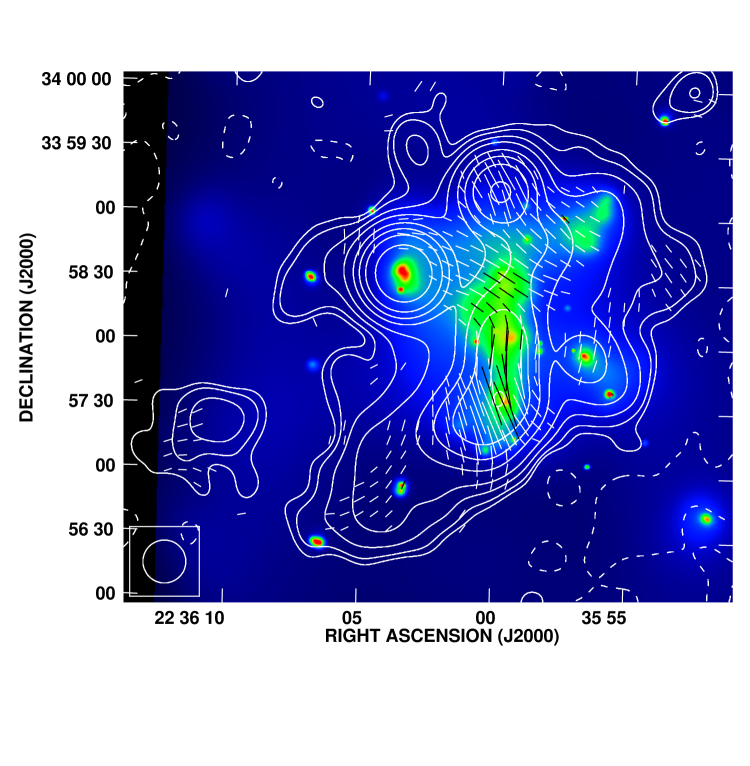
The emission ridge has been studied extensively in different regimes of the electromagnetic spectrum (see references in Sect. 1). Three mechanisms explaining the observed properties of the ridge have been described and then tested for the Quintet. Proposed were the accretion of the primordial gas (Osmond & Ponman 2004, O’Sullivan et al. 2009), heating of the medium by high-mass X-ray binaries and Supernovae (O’Sullivan et al., 2009), and shock heating (Appleton et al. 2006, O’Sullivan et al. 2009). The last of them was suggested as the most probable one, providing the most accurate explanation of the observed energy and temperature distributions of the X-ray emitting medium, as well as explaining phenomena seen in other regimes of the electromagnetic spectrum. The study of the magnetic field can provide arguments for or against the shock scenario, as propagation of the shock waves through the magnetised plasma should result in changing the orientation of the magnetic field; in particular, the magnetic field can thus be squeezed, resulting in higher polarisation degree (Urbanik, 2005). As the emission ridge is expected to be formed by the means of shocking the IGM due to high-speed infall of NGC 7318B to the group, there should be a polarised structure between the galaxies mentioned above. In Fig. 7, the TP emission contours and B–vectors of the polarised intensity, corrected for the foreground Faraday rotation, from our 4.86 GHz observations have been overlaid upon the CHANDRA image presenting the X-ray emission. The area of the shock agrees well with the polarised radio ridge, with the maximum located near the southern end of the X-ray ridge, indicating an increased polarisation degree of the IGM in that region. As the shock is clearly visible in the UV data, we have superimposed the GALEX near UV image of the Quintet with the polarisation B–vectors (corrected for the foreground RM) at 4.86 GHz (Fig. 8). The orientation of the vectors (parallel to the shock) strongly supports the idea of an enhancement of the anisotropy due to shock-driven compression.
4.3.5 Magnetic field as a tracer of the previous interactions
Fig. 3 shows an extended area of enhanced polarisation degree between the radio ridge and NGC 7319 (near , ). The polarised fraction is significant, ranging from approximately 6 per cent near the ridge up to 13 per cent in the outskirts of the western spiral arm of NGC 7319. The magnetic field, represented by the B–vectors (corrected for the foreground Faraday rotation of 182 rad m-2, as seen in Fig. 8) seems to connect NGC 7319 with the pair NGC 7318A/B. The low resolution map of the spectral index (Fig. 6, right panel) shows that varies from approximately to , with mean value of .
NGC 7319 is known to be perturbed by the previous interactions. It is usually suggested that they were due to a hypothetical passage of NGC 7320C (Shostak, Allen & Sullivan 1984, Moles, Sulentic & Marquéz 1997, Moles, Marquéz & Sulentic 1998) that caused stripping of the material through the tidal tail containing SQ-B. On the other hand, NGC 7318A (as well as NGC 7317) is considered as non-interacting member of the group.
The diffuse emission with a steep spectrum and a high degree of polarisation is likely to originate in the material stripped from NGC 7319, as this galaxy shows hardly any signs of the emission neither in Hi (Shostak et al. 1984, Williams et al. 2002), H (Arp 1972, Moles et al. 1997), nor in CO (Yun et al., 1997). An active role of NGC 7318A in the previous interactions was first proposed by Shostak et al. (1984) and later supported by Xu et al. (2005), who proposed that the ”UV Loop” structure connected to NGC 7319 might be a ”counter-tidal” tail formed during an encounter.
5 Conclusions
We observed Stephan’s Quintet group of galaxies using the VLA at 1.43 and 4.86 GHz and the Effelsberg 100m radio telescope at 4.85 and 8.35 GHz. We obtained maps of total power emission and polarised intensity. These maps were analysed together with the archive X-ray and UV data in order to explore the properties of the magnetic field in the group. We conclude:
-
–
The group has a large radio envelope, visible at 1.43, 4.86, and 8.35 GHz. The envelope encompasses all the member galaxies.
-
–
There is a narrow, S–shaped region of the radio emission between the member galaxies. It extends from the background source at , towards the shock region and diminishes near the northwestern edge of the foreground galaxy NGC 7320.
-
–
The mean polarisation degree of the shock region is 5 per cent. The magnetic field strength obtained within this region is equal to G, with an ordered component of G. The energy density of is comparable to the thermal one, indicating the dynamical importance of the magnetic field in the physics of the intra-group medium.
-
–
The radio emission from the aforementioned envelope is polarised, with a mean polarisation degree of 2 per cent. The strength of the mean magnetic field within its boundaries is equal to G, with an ordered component of G. The average magnetic field energy density is .
-
–
The depolarisation of the emission from the Quintet calculated from the 1.43 and 4.86 GHz data exceeds 80 per cent. This is more than two times higher than the depolarisation of the neighbouring background source. Such a difference suggests depolarisation of the emission from the group either by intrinsic (within the emitting region) Faraday rotation or internal Faraday dispersion. In the first case, it would indicate the presence of a regular magnetic field.
-
–
The intergalactic emission has a rather steep spectrum, with a mean spectral index of between 1.43 and 4.86 GHz and between 4.86 and 8.35 GHz. The steepness of the spectrum indicates that the intergalactic emission may be dominated by an ageing population of electrons and that the thermal component does not play a significant role.
-
–
There is a region of a steep-spectrum (), highly (40 per cent) polarised emission on the northwestern edge of the radio envelope. This region might be a remnant of the past interactions among the group members.
-
–
In the southern part of the group the emission forms an extension overlapping the Hi tail (detected by Williams et al. 2002). Although the orientation of the B–vectors seems to follow the Hi tail, the spectral index of the emission () indicates that it emerges not only from within the group, but also from the interloper galaxy NGC 7320. Moreover, the high inclination of NGC 7320 may result in projecting its magnetic field so that the B–vectors form an arc-like structure.
-
–
The radio emission from the starburst region SQ-B is substantially polarised (33 per cent), indicating presence of the magnetic field with a total strength of G and an ordered component reaching G. As this structure is supposed to be an example of a tidal dwarf galaxy, the detected field is likely intrinsic to the dwarf, amplified by the flow of re-accreting of stripped, magnetised plasma from the neighbour galaxy NGC 7319 during the passage of NGC 7320C.
acknowledgements
We would like to thank an anonymous referee for helpful comments and suggestions. We thank Kerstin Weis (RUB) and Marita Krause (MPIfR Bonn) for valuable comments. This research has been supported by the scientific grant from the National Science Centre (NCN), DEC. no. 2011/03/B/ST9/01859. DJB and RB acknowledge support by the DFG SFB 591 ‘Universal Behaviour of non-equilibrium plasmas’ and DFG FOR 1254, ‘Magnetisation of Interstellar and Intergalactic Media‘. This research has made us of the NASA/IPAC Extragalactic Database (NED) which is operated by the Jet Propulsion Laboratory, California Institute of Technology, under contract with the National Aeronautics and Space Administration. This research has made use of NASA’s Astrophysics Data System. Funding for the SDSS and SDSS-II has been provided by the Alfred P. Sloan Foundation, the Participating Institutions, the National Science Foundation, the U.S. Department of Energy, the National Aeronautics and Space Administration, the Japanese Monbukagakusho, the Max Planck Society, and the Higher Education Funding Council for England. The SDSS Web Site is http://www.sdss.org/. This research has made use of data obtained from the Chandra Data Archive and software provided by the Chandra X-ray Center (CXC) in the application packages CIAO, ChIPS, and Sherpa. We acknowledge usage of the Galaxy EVolution EXplorer (GALEX).
References
- Allen & Hartsuiker (1972) Allen R. J., Hartsuiker J. W., 1972, Nature, 239, 5371, 324
- Appleton et al. (2006) Appleton P. N. et al., 2006, ApJ, 639, L51
- Aoki et al. (1999) Aoki K., Kosugi G., Wilson A. S., Yoshida M., 1999, ApJ, 521, 565
- Arp (1972) Arp H., 1972, ApJ, 174, L111
- Baars et al. (1977) Baars J. W. M., Genzel R., Pauliny–Toth I. I. K., Witzel A., 1977, A&A, 61, 99
- Beck & Krause (2005) Beck R., Krause M., 2005, AN, 326, 414
- Brentjens & de Bruyn (2005) Brentjens M. A., de Bruyn A. G., 2005, A&A, 441, 1217
- Condon et al. (1998) Condon J. J., Cotton W. D., Greisen E. W., Yin Q. F., Perley R. A., Taylor G. B., Broderick J. J, 1998, ApJ, 115, 1693
- Chyży et al. (2000) Chyży K. T., Beck R., Kohle S., Klein U., Urbanik M., 2000, A&A, 355, 128
- Chyży et al. (2007) Chyży K. T., Bomans D. J, Krause M., Beck R., Soida M., Urbanik M., 2006, A&A, 462, 933
- Emerson & Gräve (1988) Emerson D. T., Gräve R., 1988, A&A, 190, 353
- Geng et al. (2012) Geng A., Beck A. M., Dolag K., Bürzle F., Beck M. C., Kotarba H., Nielaba P., 2012, MNRAS, 426, 3160
- Giacintucci et al. (2012) Giacintucci S. et al., 2011, ApJ, 732, 95
- Guillard et al. (2012) Guillard P. et al., 2012, ApJ, 749, 158
- Hickson (1982) Hickson P., 1982, ApJ, 255, 382
- Hickson et al. (1992) Hickson, P.; Mendes de Oliveira, C.; Huchra, J. P.; Palumbo, G. G., 1992, ApJ, 299, 353
- Hunsberger et al. (1996) Hunsberger, S. D.; Charlton, J. C.; Zaritsky, D. 1996, ApJ, 462, 50
- Hwang et al. (2012) Hwang J–S., Struck C., Renaud F., Appleton P. N., 2012, MNRAS, 419, 2, 1780
- Moles et al. (1997) Moles M., Marquéz I., Sulentic J. W., 1997, ApJ, 485L, 69
- Moles et al. (1998) Moles M., Sulentic J. W., Marquéz I., 1998, A&A, 334, 473
- Natale et al. (2012) Natale G. et al., 2012, ApJ, 725, 1, 955
- Niklas (1995) Niklas S., 1995, PhD thesis, University of Bonn
- O’Sullivan et al. (2009) O’Sullivan E., Giacintucci S., Vrtilek J. M., Raychaudhury S., David L. P., 2009. ApJ, 701, 1560
- Osmond & Ponman (2004) Osmond J. P. F., Ponman T. J, 2004, MNRAS, 350, 1511
- Pacholczyk (1973) Pacholczyk A. G., Radio Astrophysics. Freeman, San Francisco, 1970; Mir, Moscow, 1973
- Paturel et al. (2003) Paturel G., Petit C., Prugniel P., Theureau G., Rousseau J., Brouty M., Dubois P., Cambrésy L., 2003, A&A, 412, 45
- Renaud et al. (2010) Renaud F., Appleton P. N., Xu C. K., 2010, ApJ, 724, 80
- Shostak et al. (1984) Shostak G. S., Allen R. J., Sullivan W. T. III, 1984, A&A, 139, 15
- Siejkowski et al. (2010) Siejkowski H., Soida M., Otmianowska-Mazur K., Hanasz M., Bomans D. J., 2010, A&A, 510, 97
- Taylor et al. (2009) Taylor A. R., Stil J. M., Sunstrum C., 2009, ApJ, 702, 1230
- Trinchieri et al. (2003) Trinchieri G., Sulentic J., Pietsch W., Breitschwerdt D., 2003, A&A, 401, 73
- Trinchieri et al. (2005) Trinchieri G., Sulentic J., Pietsch W., Breitschwerdt D., 2005, A&A, 444, 697
- Urbanik (2005) Urbanik, M. 2005 in: Proceedings of Magnetized Plasma in Galaxy Evolution Conference, 201
- Vrtilek (2006) Vrtilek J., 2006, cxo.prop, 2239
- Weżgowiec et al. (2012) Weżgowiec M., Urbanik M., Beck R. Chyży K. T., Soida M, 2012, A&A, 545, A69
- Williams et al. (2002) Williams B. A., Yun M. S., Verdes-Montenegro L., 2002, AJ, 123, 2417
- Xu et al. (2003) Xu C. K., Lu N., Condon J. J., Dopita M., Tuffs R. J., 2003, ApJ, 595, 665
- Xu et al. (2005) Xu, C. K. et al., 2005, ApJ, 619, L95
- Yun et al. (1997) Yun M. S., Verdes–Montenegro L., del Olmo A., Perea J., 1997, ApJ, 475, L21