X-ray and Radio Observations of the Cygni Supernova Remnant G78.2+2.1
Abstract
We analyse ROSAT and Chandra ACIS X-ray observations and HI absorption spectra of the Cygni supernova remnant (G78.2+2.1, DR4). The ROSAT All-Sky-Survey image shows G78.2+2.1 has an adjacent limb-brightened shell north of it. A new ROSAT mosaic shows details of the X-ray emission over the entire face of G78.2+2.1. We also create Chandra mosaics which cover much of the northern rim and central regions of G78.2+2.1. HI absorption spectra result in association of G78.2+2.1 with the Cygni nebula, with distance 1.7 to 2.6 kpc. Chandra spectra for G78.2+2.1 give an X-ray temperature of 0.6-1.2 keV (90 % error), and that a Sedov model has age of 6800-10000 yr. A compact power-law X-ray source in G78.2+2.1 is consistent with the same distance as G78.2+2.1. The northern X-ray shell is identified with a B3 star at distance of 980 pc and is proposed as a stellar wind bubble.
keywords:
supernova remnants:individual (G78.2+2.1)1 Introduction
G78.2+2.1 (or DR4) is a nearby shell-type supernova remnant (SNR) with a radio diameter of 60 arcmin (Higgs, Landecker, & Roger, 1977). G78.2+2.1 has been of particular interest recently because of its possible association with unidentified -ray sources in the Galactic plane. If it is associated, then the question of whether the -rays are produced by a young pulsar or by high-energy particles accelerated by the supernova shock can be addressed.
At a Galactic longitude of 78∘, G78.2+2.1 is located in the Cygnus X region of the Galactic plane, about 2.5 degrees from the center of Cygnus X. Cygnus X is about 6 degrees in diameter and is one of the most nearby massive star forming regions within our Galaxy (for a review e.g. see Knödlseder, 2004). The most massive stars in Cygnus X reside at its center in the Cyg OB2 association, which is at a distance of 1.3-1.5 kpc as determined recently by VLBI parallax measurements (Rygl et al., 2012). The age of Cyg OB2 is 3-4 Myr, with total Lyman continuum luminosity of ph/s and total mechanical luminosity of a few erg/s (Kn¨odlseder, et al. 2002) The Cyg OB2 association injects enough kinetic energy, that a superbubble shell should have been created with radius of 60pc and velocity 20 km/s (Lozinskaya et al., 2002). X-rays from the superbubble interior were detected by Cash et. al (1980), but other evidence is confusing. A recent study of molecular gas, using the CO line, across a significant area (2 degrees by 4 degrees) of Cygnus X was carried out by Gottschalk et al.(2012). In summary, their findings are: i) there are three layers of gas across the region, at radial velocities of 0 to 8 km/s (layer 1), -10 to 0 km/s (layer 2) and above 8 km/s (layer 3). ii) Layer 1 shows extensive HI self-absorption, is nearest to us and is associated with cold gas and dust in the Great Cygnus Rift, located at a distance of 500-800 pc (Schneider et al. 2006). HI absorption profiles indicate that layer 3, associated with W75N and DR17, is in front of layer 2, associated with DR21, G82.6+0.4 and IRAS 23350+4126. iii) The fact that layer 3 is redshifted with respect to the expected radial velocity of Cyg OB2 and layer 2 is blueshifted is not consistent with the picture of an expanding shell of molecular gas around OB2. An important implication of this study is that radial velocities do not fit in with a simple circular rotation model for the Galaxy in the Cygnus X region.
The SNR G78.2+2.1 has been observed several times at radio, optical and X-ray wavelengths. In radio, several spectral index studies have been carried out, with one of the most comprehensive by Zhang et al. (1997). Optical and X-ray observations were reported by Lozinskaya et al. (2000). They searched for but did not find an optical shell associated with G78.2+2.1. The ROSAT X-ray image was found to have a shell structure similar to the radio image. The ASCA X-ray spectra were analysed to find temperatures of 1.40.1 keV for an equilibrium ionization plasma model and 2.80.4 keV for a non-equilibrium ionization plasma model. Uchiyama et al. (2002) also analysed ASCA X-ray observations of G78.2+2.1 and showed images in 3 energy bands: 0.7-1 keV, 1-3 keV and 4-7 keV. The two lower energy band images show an irregular shell structure for G78.2+2.1 and the high energy band shows two compact bright spots, labelled C1 and C2. The compact spots are not coincident with the EGRET -ray sources 2EG J2020+4026 or 3EG J2020+4017. Their ASCA spectral analysis shows that the diffuse emission (their regions R1, R2 and R3) is well fit with an 0.5-0.8 keV thermal plasma, and that their regions C1 and C2 have an additional power-law components with spectral indices .
Mavromatakis (2003) imaged the G78.2+2.1 region in H+[NII], [SII] and [OIII] filters, noting that the region is dominated by emission from several HII regions. Long-slit spectra at one position detected shock-heated gas (with [SII]/H 0.6), with estimated shock velocity below 100 km/s and pre-shock density 20 cm-3. The H/H ratio was 10 for this region, equivalent to a column density of 61021cm-2. Bykov et al. (2004) report a bright hard X-ray (25-40 keV) clump which is nearly coincident with the ASCA C2 source, with a flux of 1.710-11erg cm-2s-1. Ladouceur & Pineault (2008) use the Canadian Galactic Plane Survey continuum data for G78.2+2.1 to better delineate the extent of the SNR and the spatial spectral index variations, finding an spatially-averaged spectral index of 0.750.3, steeper than previous studies. They also associate HI structures in two different velocity ranges with the SNR.
Trepl et al. (2010) investigate the 3.77 Hz -ray pulsar PSR J2021+4026, which is located 7.8 arcmin from the center of G78.2+2.1. It has a spin-down age of 77 kyr and is associated with an XMM/Newton X-ray source 2XMMJ202131.0+402645 and Chandra X-ray source S21. S21 has the best determined position of ((J2000)=, (J2000)=) with a position error of . The X-ray spectrum is best fit by a blackbody, although bremmstrahlung and MEKAL models cannot be ruled out. It also has quite uncertain X-ray column density and thus distance: 2(+5,-2) or 6(+6,-4)1021cm-2, respectively for black-body and bremsstrahlung emission models, and higher values of 10(+8,-5) or 16(+6,-3)1021cm-2 for power-law and MEKAL models. Thus the association with the SNR G78.2+2.1 is uncertain. Wienstein et al. (2011) report a TeV source in the direction of G78.2+2.1, labelled VER J2019+407. It was a 7.5 sigma detection (26834 net counts), enough to get a position but not a spectrum: ((J2000)=, (J2000)=) with 7′ radius 95% confidence error circle.
In this paper, our focus is to understand the physical properties of G78.2+2.1. We carry out a comprehensive analysis of X-ray observations from ROSAT and Chandra observations, to delineate the X-ray structure of G78.2+2.1 and to sort out the conflicting results of previous X-ray spectral studies on G78.2+2.1. Also, we obtain new HI absorption spectra by analysis of the HI line and 1420 MHz continuum observations from the Canadian Galactic Plane Survey (CGPS, English et al. 1998, Taylor et al. 2003). Section 2 describes the observations and data analysis, section 3 presents the analysis and results, and section 4 presents conclusions.
2 Observations and Data Analysis
2.1 X-ray Data
The ROSAT all-sky survey (RASS) covers all of G78.2+2.1 and its surroundings. We found that ROSAT PSPC pointed observations covered all of G78.2+2.1 but not its surroundings, and that Chandra observations covered only part of G78.2+2.1. Thus we obtained all three sets of data for analysis. The archival X-ray observations from ROSAT and Chandra for the G78.2+2.1 region were obtained from NASA’s HEASARC website. Data (images, photon event lists and associated files) which covered any part of G78.2+2.1 or its nearby surroundings were obtained.
The list of the ROSAT pointed observations, with pointing centers and net exposure times, is given in Table 1. The ROSAT data were processed using the ftools and HEASOFT software packages, available at the HEASARC website. ROSAT Guest Observer Facility analysis procedures were used (OGIP Memo 94-010). The following ftools were used to make the ROSAT mosaic: xselect (to limit the range of pha channels used in each image), fimconcat (to make a blank image), fimgmerge (to add in the individual counts images) (a separate image was made for the counts map and for the exposure map), farith (to create a count-rate map from counts and exposure maps), and fgauss (to smooth the count-rate map). To make an image using only the central high resolution parts of each PSPC image, we used xselect on the individual counts and exposure images before merging.
The list of Chandra observations is given in Table 2. The standard archive ACIS good time intervals were used as no significant flares were seen in the data. The Chandra data were processed and spectra extracted using the CIAO and Chandra threads from the Chandra Science Center (http://cxc.harvard.edu). The Chandra individual soft and hard band images were created using the CIAO (Version 4.4) package, and combined using the ftools software package. CIAO version 4.4 and CALDB version 4.4.8 were used. Similar to the methods for creating the ROSAT mosaics, a combined counts image and a combined exposure image were created, then divided to obtain the count-rate map, and then Gaussian smoothing was applied.
2.2 Radio Data
Radio observations in 1420 MHz continuum and the HI spectral line were made as part of the Canadian Galactic Plane Survey (CGPS, English et al., 1998, Taylor et al., 2003). We extracted the 1420 MHz image of G78.2+2.1 from the survey data. We used the HI line data together with the continuum data to determine HI absorption spectra for G78.2+2.1. Since it is an extended source rather than a point source, the standard formula for HI absorption spectra does not apply. The background region has to be chosen to be near the continuum peak, in order to minimize the difference in the Galactic HI distribution along the lines-of-sight to source and background regions (Leahy & Tian, 2008, and Tian & Leahy, 2008; see Leahy & Tian, 2010 for a review). Because the brightest continuum emission and adjacent background emission were separated by a curved boundary, instead of boxes for source and background we used regions defined by TB. We used the software program ’meanlev’ in the DRAO export package which allows one to extract spectra for source and background regions defined by user specified TB levels.
3 Results
3.1 HI Absorption Spectra
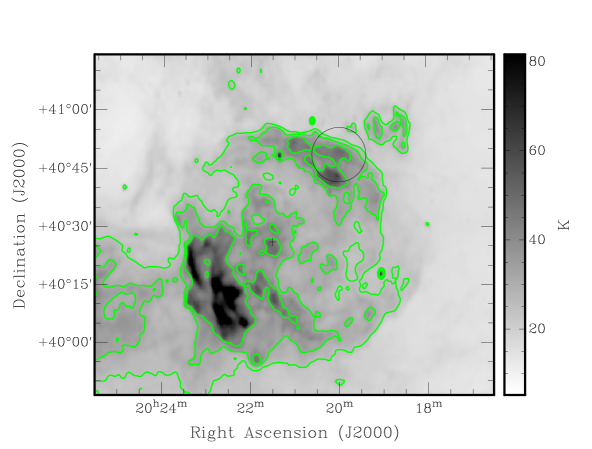
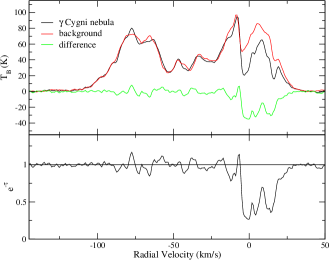
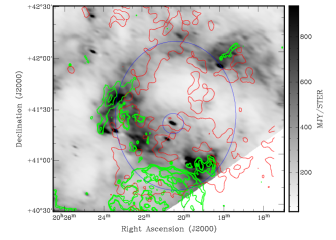
We describe the radio image and absorption spectra first, because we use the image to locate the extent of the supernova remnant on the X-ray images. Fig.1 shows the 1420 MHz continuum image in the area around G78.2+2.1, in Galactic coordinates (Ladoucer and Pineault, 2008, published a similar image). The image shows the shell-like radio morphology, with brightest filaments at the bottom (low b), and very faint parts of the shell at upper right and at lower left. As noted previously (e.g. Higgs et al., 1977), the Cygni nebula (Drake, 1959) is located at l,b=78.18∘,+1.82∘ and is a small bright region on the face of G78.2+2.1. The Cygni nebula has a thermal radio spectrum; the other regions have a non-thermal spectrum.
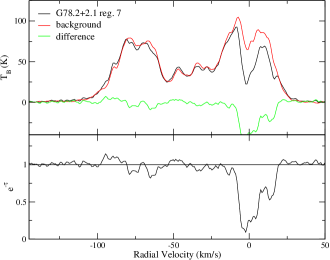
HI absorption spectra were constructed for a number (7) of different continuum emission areas across G78.2+2.1, including the Cygni nebula. The Galactic coordinates (l,b) of the centers of these regions (which are extended unless noted) are: (1)(point source) 78.51∘,+2.32∘ ; (2)(point source) 77.83∘,+2.40∘; (3) 78.29∘,+2.46∘; (4)( Cygni nebula) 78.18∘,+1.82∘; (5) 78.01∘,+1.78∘; (6) 78.37∘,+1.75∘; and (7) 78.11∘,+1.73∘. The emission spectra for all 7 regions are similar to the spectra shown in Figure 2 for region 7 of the SNR and for the Cygni nebula. Region 7 is the bright filament just below the Cygni nebula (region 4). The spectrum contains emission from HI interior to the solar circle at positive radial velocities (0 to +25 km/s) and from the outer galaxy on the far side of the solar circle in the direction of l=78.2∘ (0 to -100 km/s).
The absorption spectra for the 7 regions can be separated into two groups. One group shows absorption spectra nearly identical to that of the bright filament of region 7. It demonstrates absorption at all positive velocities and at negative velocities above -8 km/s. The other regions in this group are 3, 4 (the Cygni nebula), 5 and 6. Region 3 is the brightest diffuse emission in the upper part of G78.2+2.1 (see Fig.1 left). Because it has low continuum 1420 MHz brightness, the HI spectrum is quite noisy but shows clear absorption at velocities more positive than -10 km/s. Region 5 is of lower continuum brightness than region 4 or 7 so has more noise but otherwise is very similar to the spectrum for region 7. Region 6 is the filament at the lower left rim of G78.2+2.1 and also has an HI absorption spectrum very similar to region 7. Thus all of the diffuse emission regions in G78.2+2.1 were found to show absorption at velocities greater than -8 km/s but no absorption for velocities less than this value.
The total Galactic column density in the direction of G78.2+2.1 is cm-2 from the ’nh’ ftool, which is based on HI surveys. From an integration of the absorption spectrum of Fig. 1 (right) we find cm-2 for G78.2+2.1. This value includes the correction for optical depth (see e.g. Binney & Merrifield(1998) pp.468-473).
The two point sources make up the other group of absorption spectra. Region 1 is the point source at the upper left interior of G78.2+2.1 and region 2 is the point source at the upper right. Both clearly shows absorption at all velocities (+25km/s to -100 km/s), so are identified as extragalactic background radio sources.
3.2 X-ray Images
3.2.1 ROSAT
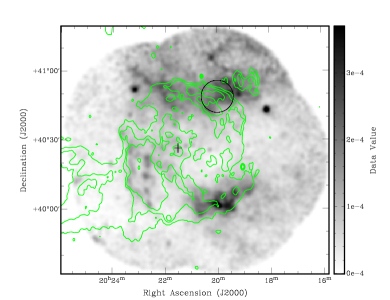
In Figure 3(a), we present the flux-corrected ROSAT all-sky image of the G78.2+2.1 region in the 0.5-2.0 keV band. This image is overlaid with the 25, 32, and 42 K 1420 MHz contours of G78.2+2.1 (see Fig. 1) and includes the region north of G78.2+2.1. From this RASS image, we can see that there is significant X-ray emission associated with the Cygni region. There is an irregular X-ray shell that coincides with radio emission of the SNR G78.2+2.1. However, there is also emission extending north of the remnant. This extra emission roughly takes the form of a second shell centered near ((J2000)=, (J2000)=). The second shell does not show any evidence of radio emission: adjacent CGPS radio mosaics were examined and show that there is no radio shell associated with the x-ray emission.
We combined the ROSAT PSPC pointed observations into a single mosaic image in two different ways. First we included the entire field of PSPC pointing in the mosaic. This results in maximum exposure time (and thus sensitivity) but because of the rapidly increasing size of the point-spread-function with off-axis angle, this also results in poor spatial resolution. Next we excluded the outer areas of each pointing to exclude the low resolution data and made a higher resolution mosaic. Because of mirror vignetting, the loss of sensitivity compared to the first mosaic is small. The mosaics were made for both soft (0.1-0.4 keV) and hard (0.5-2.0 keV) bands. The hard and soft maps were smoothed using a 2 arcmin Gaussian. The soft image shows only faint diffuse emission with no emission associated with G78.2+2.1. This can be attributed to the X-ray absorption column density of the intervening interstellar medium, which prevents any emission from G78.2+2.1 from below 0.4 keV from reaching us.
The high-resolution ROSAT PSPC 0.5-2.0 keV X-ray image is shown in Figure 3(b), overlaid with the 1420 MHz radio contours of G78.2+2.1. It reveals that the X-ray emission forms an incomplete shell within the radio shell of the SNR. The brightest X-ray emission is located at the south-west radio boundary of the SNR. In contrast, where the radio emission is brightest (in the south-east corner of G78.2+2.1, near (J2000)=, (J2000)= there are just several small spots of X-ray emission. Other prominent X-ray emission is seen inside the northern boundary of G78.2+2.1. This coincides with the second brightest area in radio emission (see Fig. 1). The X-ray and radio emission at the west boundary and in the western interior part of G78.2+2.1 are both very faint. There is clear X-ray emission beyond the northern boundary of the radio SNR. The morphology of this emission, seen in Fig. 3(b), is fully consistent with that seen in the lower resolution RASS image of Fig. 3(a), which shows the full extent of the large X-ray shell centered near ((J2000)=, (J2000)=). From Fig. 3(a) and 3(b), it is not possible to tell whether the emission along the northern boundary of G78.2+2.1 originates from the SNR itself, or from the northern shell, or from a combination of both.
| Dataset ID | RA(∘) | Dec(∘) | live-time | Observation date |
|---|---|---|---|---|
| rp400386n00 | 304.790 | 40.350 | 8479 s | 1993-12-01 |
| rp500238n00 | 305.530 | 40.180 | 8155 s | 1993-10-23 |
| rp500244n00 | 305.050 | 40.690 | 7403 s | 1993-10-22 |
| rp500245n00 | 304.940 | 40.180 | 8668 s | 1993-10-26 |
| rp500246n00 | 305.630 | 40.580 | 5329 s | 1993-10-27 |
| rp900157n00 | 305.450 | 40.370 | 3864 s | 1991-11-24 |
3.2.2 Chandra
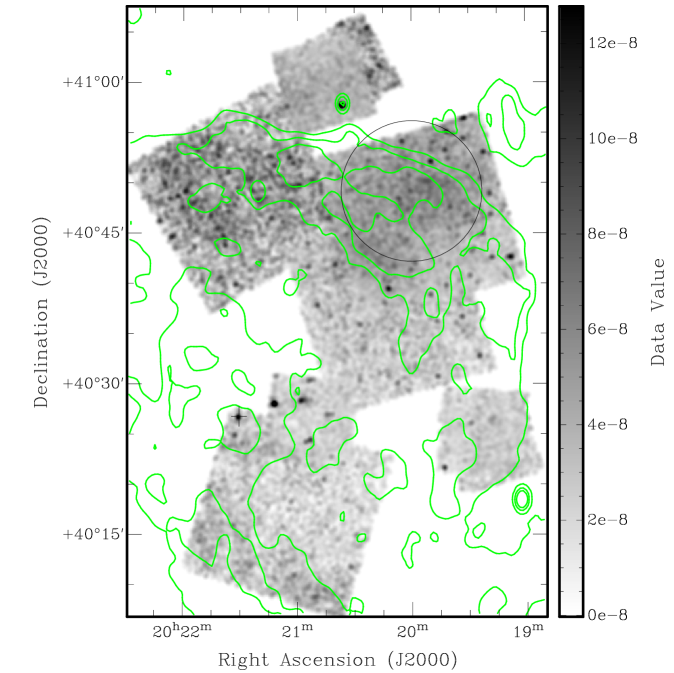
The SNR G78.2+2.1 has not been completely covered by Chandra observations, however significant parts of the north to north-west and central parts of G78.2+2.1 have been observed. Soft band (0.5-3.0 keV) and hard band (3.0-7.0 keV) image mosaics, with 4 arcsec pixels, were constructed using all of the available Chandra ACIS pointed observations of G78.2+2.1 (see Table 2). The images were smoothed with a 12 arcsec Gaussian to better show the diffuse emission. Figure 4 shows the resulting 0.5-3.0 keV Chandra image and Figure 5 shows the resulting 3.0-7.0 keV Chandra image. We included data from the I0, I1, I2, I3 and S2 ACIS chips, but we decided to not include data from the backside illuminated spectroscopy chip (S3) because of its significantly different response to X-rays. 0.5-3 keV images made which include the S3 chip show significantly higher count rate over the area of the S3 chip, and do not improve the visibility of diffuse emission in the region. The Chandra images have considerably higher sensitivity and much higher spatial resolution than the ROSAT images, or any previous X-ray images of the Cygni region. The Chandra soft image (Fig. 4) shows that much of the X-ray emission is resolved into point sources, but that there still exists significant diffuse emission in the region. Point sources were identified using both wavdetect and the Chandra XASSIST catalog to verify the detection of point sources in the area. The diffuse emission is brightest along and interior to the northern boundary of G78.2+2.1, as delineated by the radio contours. There is also significant diffuse emission in the center of G78.2+2.1 (coinciding with the brighter radio emission which is left of the =32K radio contour from ((J2000)=, (J2000)=) to ((J2000)=, (J2000)=). This diffuse emission can also be seen in the ROSAT PSPC mosaic of Fig. 3(b).
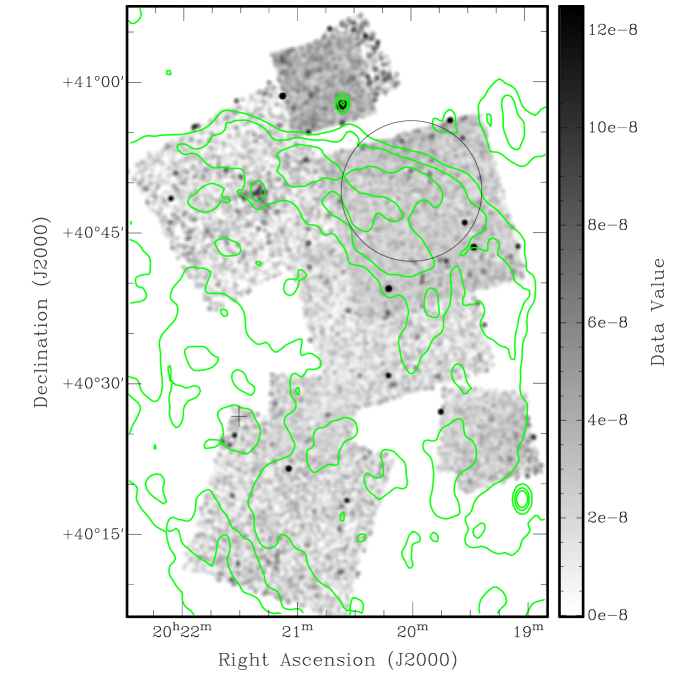
Fig. 5 shows the hard band (3-7 keV) Chandra image mosaic. This shows no diffuse emission, but does show a few small extended sources. There is an area of diffuse hard emission at ((J2000)=, (J2000)=) that coincides with the hard source C1 described by Uchiyama et al. (2002). However, with the high resolution Chandra image, we find that the hard X-ray source located in the 6’ region identified as source C2 by Uchiyama et al (2002) is a point source rather than an extended source. In the next section we consider the X-ray spectral analysis for this point sources and the diffuse emission.
| ObsID | RA(∘) | Dec(∘) | live-time | Observation date |
|---|---|---|---|---|
| 2826 | 305.050 | 40.650 | 19960 s | 2002-07-09 |
| 2827 | 305.350 | 40.810 | 9560 s | 2002-03-15 |
| 3856 | 305.071 | 40.436 | 30360 s | 2003-01-26 |
| 5533 | 305.254 | 40.297 | 14350 s | 2005-02-06 |
| 12676 | 304.970 | 40.790 | 47360 s | 2011-01-08 |
3.3 X-ray spectrum analysis
Because the Chandra ACIS instrument has significantly superior spectral and spatial resolution to ROSAT, we focus on the Chandra spectra. Several regions were selected for X-ray spectrum extraction and analysis to understand the nature of the X-ray emissions and where they originate, based on the derived column densities. Care was taken to avoid point sources for both the source and background regions. Thus each source and background region was taken as the sum of spectra from a number of small rectangular areas (typically 4 to 12 boxes) which avoided the visible point sources. Spectra were extracted using the procedure outlined in the CIAO Science threads and analysed using XSPEC. The parameter uncertainties were determined using the ’error’ function of XSPEC. The regions discussed here are: i) the center of G78.2+2.1 including the diffuse emission on the left side of the rectangular area in the lower left part of Fig. 4 (centered on (J2000)=, (J2000)=); ii) the diffuse emission outside the northern edge of G78.2+2.1 at the upper right part of Fig. 4 (centered on (J2000)=, (J2000)=); iii) the diffuse emission inside the northern edge of G78.2+2.1 at the upper right of Fig. 4 (centered on (J2000)=, (J2000)=); iv) the diffuse emission inside the northern edge of G78.2+2.1 at the upper left of Fig. 3 (centered on ((J2000)=, (J2000)=); v) the extended emission associated with the hard X-ray C1 source (centered on (J2000)=, (J2000)=, see Fig. 5); and vi) the point source emission associated with the hard X-ray C2 source (centered on (J2000)=, (J2000)=, see Fig. 5). For all these regions, adjacent low surface brightness areas were used for background subtraction.
3.3.1 Spectrum of G78.2+2.1 and the northern X-ray shell
The X-ray spectrum from the diffuse emission at the center of G78.2+2.1 was modelled in XSPEC using a non-equilibrium ionization plasma model (NEI) with a TBABS model for interstellar absorption. Solar abundance is assumed. An equilibrium ionization plasma model was found not to yield an adequate fit. The resulting best-fit temperature is 1 keV and column density is . The best-fit parameters and their 90% error ranges are given in Table 3, along with parameters for the other spectra. The column density derived from the HI absorption spectrum of G78.2+2.1 agrees, within errors, with that derived from the X-ray spectrum, confirming that the X-ray and radio emission are both from G78.2+2.1. Models of the emission from both the northern area of the remnant as well as the central region indicate that the plasma is not in ionization equilibrium.
The spectrum from the diffuse emission just outside the edge of G78.2+2.1 was fit adequately with an equilibrium ionization plasma (APEC) model with solar abundances. This spectrum has a much lower column density () than the central spectrum and somewhat lower temperature. This shows than the northern X-ray emission outside G78.2+2.1 is from hot gas much closer to us than the SNR, and is not associated with G78.2+2.1. The properties of this shell will be discussed in detail in Section 4.2.


The is some spatial overlap between G78.2+2.1 and the northern X-ray shell. The RASS image of Fig. 3a and especially the ROSAT PSPC mosaic of Fig. 3b show that the overlap along the northern boundary of G78.2+2.1 is significant. Therefore we analyse the spectra from the northern edge G78.2+2.1 by allowing two spectral components of different column densities in the spectral model. We first extract a spectrum of the diffuse emission from the whole field covered by the I0, I1, I2 and I3 ACIS chips for observation 12676. This field is the 5 arcmin by 5 arcmin rectangular region centered at ((J2000)=, (J2000)=) (see Fig. 4). The best-fit model for this data was a combination of an equilibrium ionization APEC model and non-equilibrium ionization (NEI) model. For this two component fit only, the XSPEC error command did not converge for 90% errors but did converge for 1 errors so the 1 parameter ranges were used. The best fit parameter values are given in Table 3 (row 3 for APEC component, row 4 for NEI component). In addition to fitting the total diffuse emission, we separately fit spectra for the diffuse emission from the I2 and I3 ACIS chips (the I0 and I1 emission was too faint for separate fits that were useful). The results are shown in Table 3. We find the emission from the I2 chip of observation 12676 is consistent with that of the center of G78.2+2.1 and the emission from the I3 chip is consistent with that found for the northern X-ray shell. This is consistent with our result that the entire diffuse emission (I0, I1, I2 and I3) is a mixture of emission from both the G78.2+2.1 and the northern X-ray shell. As another check on the spectral fits, a joint spectral fit for the diffuse emission of this same area was carried out using data extracted from both observations 12676 and 2826. It was found that a two-component model was needed to fit the data, similar to the case for the spectrum extracted for the diffuse emission for observation 12676.
In summary, some of the emission from the northern part of G78.2+2.1 has high column density and temperature, the same as the center of G78.2+2.1, and some of the emission is from the foreground northern X-ray shell, with low column density and temperature.
Because the Chandra observations do not cover the whole of G78.2+2.1, we do not have an estimate of the total flux of the SNR nor its total emission measure from the Chandra data. Thus we used the ROSAT pointed observations to extract a spectrum for whole area of G78.2+2.1. We find that an APEC model fits the ROSAT spectrum (/dof=0.7) with NH and kT consistent with the Chandra values. The resulting APEC norm from the ROSAT spectral fit is 0.11 with 90% error range of 0.09 to 0.18.
| NH(1022cm-2) | kT(keV) | (cm-3s) | norm(a) | /dof | |
|---|---|---|---|---|---|
| center of SNR(5533) | 0.92(0.75-1.11) | 1.05(0.59-2.73) | 0.33(0.17-1.2) | 1.3(0.0-3.5) | 1.12 (199/177) |
| northern shell (12676) | 0.30(0.19-0.39) | 0.69(0.64-0.75) | - | 0.19(1.4-2.4) | 0.98 (159/162) |
| diffuse emission (12676)(b) | 0.39(0.28-0.39) | 0.75(0.71-0.75) | - | 3.7(1.9-4.5) | |
| 1.1(0.91-1.1) | 1.2(1.0-2.0) | 3.0(2.0-3.6) | 1.5(0.96-1.7) | 1.11 (332/298) | |
| SNR diffuse emission (I2 of 12676) | 0.99(0.90-1.13) | 0.75(0.57-1.16) | 0.81(0.36-5.7) | 1.3(0.71-2.4) | 1.27 (189/149) |
| N.shell diffuse emission (I3 of 12676) | 0.23(0.13-0.30) | 0.57(0.52-0.63) | - | 1.5(1.1-1.9) | 0.91 (99/109) |
norm=
Fit of diffuse emission from all ACIS-I chips, 1 error values used.
3.3.2 Uchiyama hard sources C1 and C2
With the improvement in spatial and spectral resolution of Chandra over ASCA, we re-examine the hard sources C1 and C2 in G78.2+2.1 found by Uchiyama et al (2002). We see clear evidence that C1 is an extended source in both 0.5-3 keV and 3.0-7.0 keV Chandra images (see Figs. 4 and 5 at the C1 position of (J2000)=, (J2000)=). We extract the C1 spectrum from a circle of radius 2’ centered on C1. There is significant radio emission associated with C1. This is indicated by the 42K contour line in the 3-7 keV image. This is also verified in the 1420 MHz image (Fig. 1), where it appears as a bright compact source at l=78.52∘, b=+2.33∘, as it is not resolved in the radio image. The spectrum is analysed using a combination APEC plus power-law model, with TBABS model for interstellar absorption. As seen in Table 4, the column density is consistent with C1 being an extragalactic background source.
The C2 region is defined by Uchiyama et al (2002) is centered on ((J2000)=, (J2000)=) and 6’ in extent. From the soft and hard Chandra X-ray images, we see that the emission from the C2 region is dominated by a hard X-ray source at the center of the region, which we also designate C2. In Table 4 we show the spectral fit for the point source, which is a simultaneous fit of spectra extracted from datasets 12676 and 2826, as both include the C2 region. We also fit the spectra for C2 from 12676 and 2826 separately, with results that are consistent with the values presented in Table 4, but with larger errors. The best-fit spectrum is a powerlaw with a column density consistent with that for G78.2+2.1. However, due to the low count rate and resulting large errors on , it is not possible to say definitively whether or not C2 is associated with G78.2+2.1.
| NH(1022cm-2) | kT(keV) | norm(plasma) | photon index | norm(powerlaw) | /dof | |
|---|---|---|---|---|---|---|
| C1(2827) | 1.5(1.2-1.9) | 0.41(0.30-0.52) | 1.1(0.5-3.7) | 0.6(0.1-1.0) | 2.7(1.5-5.2) | 1.0 (31/31) |
| C2(point source)(b) | 0.69(0.025-1.3) | - | - | 1.0(0.72-1.4) | 2.3(1.0-4.2) | 1.0 (70/70) |
1 error values used.
Simultaneous fit from datasets 12676 and 2826.
4 Discussion
4.1 The SNR G78.2+2.1
4.1.1 HI and the distance to G78.2+2.1
We produce the first quantitative absorption spectra for SNR G78.1+2.1 and the Cygni nebula. Higgs et al.(1977) present an emission plus fractional absorption profile which shows similarity to our absorption spectrum. However, quantitative comparison with our results is not possible because they do not explain how their combined emission and absorption profile is calculated, nor do they give the location of their extraction regions.
The most negative velocity of absorption is -8 km/s, consistently for the different HI absorption spectra that were extracted for G78.2+2.1. To interpret this in terms of distance is not simple. As noted by Gottschalk et al.(2012), radial velocities in the Cygnus X region, of which G78.2+2.1 is part, do not follow a circular rotation model. Rather the molecular gas is in three layers (see introduction above). Since all three layers show up in absorption in the HI spectrum of G78.2+2.1, the SNR must be either in or behind the furthest of the layers, layer 2, which is at a distance of 1.5-2.5 kpc (Gottschalk et al. 2012), different from its distance inferred using a circular rotation curve model. Thus 1.5-2.5 kpc lower distance limit of layer 2 is taken as the lower limit to the distance to the SNR. We note that Gottschalk et al. (2012) show relative absorption profiles for sources in Cygnus X for a region 3-4 degrees away from G78.2+2.1. Two of the sources have measured parallax distances: 1.3 kpc for W75N and 1.5 kpc for DR21 (Rygl et al. 2012). These two sources have different maximum velocities of absorption: +3 km/s for W75N and -20 km/s for DR21 (Gottschalk et al. 2012) . Thus the absorption spectrum is not of use to obtain any better distance limit than the lower limit mentioned above.
Ladouceur & Pineault (2008) discusses HI emission in the region. Their Figs. 19, 21 and 23 shows HI emission averaged over channels for velocities of +3 to +18 km/s, +3 to +9 km/s and -19 to -11 km/s, respectively. For +3 to +18 km/s they claim that the low intensity features are absorption, but for +3 to +9 km/s they claim that the same low intensity features are caused by a shell surrounding the SNR, despite the overlapping velocity range. We believe a more consistent explanation is that all features are caused by absorption. Their Fig.24 shows the CO emission averaged from +3 to +10 km/s: we see no clear association with SNR G78.2+2.1. A sharp edge is seen to the CO emission near l=79 degrees, from b=0 to 1.5 degrees, but this is more than 1 degree south of the SNR. Ladouceur & Pineault (2008) also propose four scenarios for the location of HI of different velocities around or in front of SNR G78.2+2.1. However none of the scenarios is consistent with the recent findings of Gottschalk et al (2012), which show clear evidence for three HI layers, with the 0 to +8 km/s layer nearest to us and well in front of the Cygnus X region and the G78.2+2.1.
In section 3.1 we noted the detailed agreement between the absorption spectra for the SNR and the Cygni nebula. We conclude that they are probably physically associated and at the same distance. The distance to the Cygni nebula is 1.7 to 2.6 kpc (Baars et al., 1978). This is consistent with the lower distance limit of 1.5 kpc, derived above. Recently, Rygl et al (2012) have determined accurate distances for five massive star forming regions in the Cygnus X region. Four of the five have distances of 1.3 to 1.5 kpc, yielding the best distance yet for the Cyg OB2 association, at the center of Cygnus X. The fifth region is AFGL 2591, which at (J2000)=, (J2000)= is located much closer to G78.2+2.1 than the others. It has a distance of 3.330.11 kpc. These are similar to the distance to the Cygni nebula, but there is not yet a better distance determination to the latter.
In summary, we take the distance 1.7 to 2.6 kpc of the Cygni nebula as the probable distance for G78.2+2.1.
4.1.2 X-ray properties
The new X-ray results allow us to determine the SNR properties better than previously done. First we apply a Sedov model (e.g. Cox, 1972) to G78.2+2.1 with distance range 1.7-2.6 kpc. The SNR angular radius is 30 arcmin, so with distance kpc the SNR radius is =17pc. The shock temperature of 0.75 keV is taken from the Chandra spectra of the SNR diffuse emission, which has a 90% uncertainty range of 0.6-1.2 keV (see Table 3). This yields a shock velocity of 860 km/s (90% error 700-1100 km/s). Including a distance range of 1.7-2.6 kpc, the Sedov age is 8000 (6800,10000) yr and the parameter is 7.2 (4.4,16), with upper and lower limits in brackets. Here is the blast energy in units of 0.75erg. The norm from the ROSAT APEC spectral fit for the whole of G78.2+2.1 gives an emitting plasma density of where is the filling factor in units of 0.05. The fiducial filling factor of 0.05 is obtained using the density distribution for a Sedov remnant, e.g. as given by Heiles (1964). The norm of the ROSAT spectral fit also yields a mass of the X-ray emitting plasma of 50 M⊙. We checked, using the Chandra images which resolve point sources, that the contribution of point sources to the ROSAT norm is small (20%, so that the ROSAT norm is a good approximation to the norm of the diffuse emission from the SNR. The norm then gives an estimate for the pre-shock density, using a compression ratio of 4 for a strong shock, of . This in turn gives an explosion energy of 0.8(0.5,1.7)erg. Finally we test whether the SNR is expected to be old enough to be past the Sedov (adiabatic) phase by calculating , the time at which radiation losses cause the temperature to sag just behind the forward shock (Cox, 1972). With the above parameters we find =4.7(4.3,5.4) yr, with the radiative cooling coefficient. Thus the Sedov age is significantly below the age at which cooling sets in, and the Sedov approximation should be a good approximation.
Our X-ray spectrum analysis is consistent with the ASCA results of Uchiyama et al. (2002), who found diffuse plasma temperatures of 0.6-0.8 keV, but with the spatial resolution and spectra of the Chandra data, we can separate the emission from the SNR from that of compact sources and from that of the foreground X-ray shell. The Mavromatakis (2003) estimate of the column density of cm-2 agrees within errors with that we obtain from the HI absorption spectrum and from the Chandra spectral analysis.
For the compact sources C1 and C2, the higher resolution Chandra observations allow us to clearly separate the emission from the compact sources from the surrounding X-ray diffuse emission. C1 is an extended hard X-ray source with column density indicating that it is an extragalactic background source. C2 is a point hard X-ray source with a pure power-law spectrum and has column density consistent with the SNR G78.2+2.1, and may be associated with the SNR. The 0.5-3 keV Chandra image (Fig. 4) also shows the location of the -ray pulsar PSR J2021+4026, which like C2 has a column density consistent with that of the SNR, and the error circle of the TeV source VER J2019+407. C2 is outside the 95% error circle of VER J2019+407, so is probably not associated with it. VER J2019+407 is extended (Weinstein et al. 2011) and coincides with the rim G78.2+2.1 in diffuse radio and X-ray emission, so is likely associated with the SNR. Inconclusive evidence indicates PSR J2021+4026 may be associated with G78.2 (Trepl et al, 2010). It seems clear that further observations are needed to settle the relationship between the three sources (PSR J2021+4026, VER J2019+407 and C2) and the SNR.
4.2 The northern X-ray shell
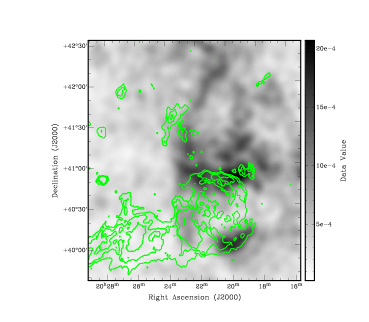
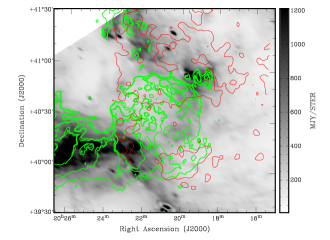
The northern X-ray shell, seen clearly in the RASS image of Fig. 3(a), was found to have a low column density from a Chandra spectrum taken near its southern edge, but outside of the SNR G78.2+2.1. We searched for counterparts to the shell and see diffuse infrared emission coincident with the shell using IRAS All-Sky-Survey images. This is shown in Fig. 7, with the left panel showing the 60 micron image around G78.2+2.1 and the right panel showing the 60 micron image around the northern shell. We also found an early type star near the shell’s center. The star is V 1685 Cyg (=HIP 100289), with coordinates: ((J2000)=, (J2000)=), or Galactic l=78.8719d,b=+02.7699d. From SIMBAD, the apparent V magnitude and B-V color are: V=10.88, B-V=0.57. The spectral type is B3 and its distance is 980 pc (Manoj et al., 2006), which is consistent with the X-ray column density. A B3 main sequence star has absolute magnitude and intrinsic color (Binney and Merrifield, 1998). The observed V and B-V, then yield an extinction estimate of (using , and a distance based on its extinction-corrected apparent magnitude of 1.0 kpc, in agreement with the published value.
To estimate the physical properties of the shell, we extract the spectrum of the entire shell using the RASS survey data. A background spectrum is extracted from an adjacent area just east of the shell. The spectrum is fit using an APEC model and yields the following parameters (with 90% errors in brackets): cm-2, kTkeV, norm=1(0.3,1.7). The norm in XSPEC is , which then yields a density of 0.11 f-1/2 cm-3, where f is the filling factor. We tested that a Sedov SNR model is inconsistent with the northern shell, because it results in an unreasonably small explosion energy.
Binney and Merrifield, 1998, give standard parameters for a B3 main sequence star: M= 7.6 M⊙, L=L⊙, R=4.8 R⊙, Teff=18700K. These can be used to estimate what the properties of a stellar wind bubble should be, where we use the stellar wind bubble model of Kwok (2007). To estimate the stellar wind power for a star with this Teff, L and M, we use the formula from Nieuwenhuijzen & de Jager (1990), with wind velocity 2 times the escape velocity. This yields a stellar wind power of erg s-1. Then the observed angular radius and distance give the bubble radius of 8.5 pc. Applying the wind bubble model then gives an age for the bubble of yr.
5 Conclusions
We carry out a new study of the supernova remnant G78.2+2.1 using Chandra and ROSAT X-ray observations and CGPS radio continuum and HI line observations. We find that HI absorption spectra of G78.2+2.1 and the Cygni nebula are nearly identical, so we associate them at the same distance of 1.7-2.6 kpc (Baars et al. 1986). This is also consistent with the lower limit of 1.5 kpc determined by absorption from gas layer 2 in the Cygnus X region (Gottschalk et al, 2012, and Rygl et al, 2012). The ROSAT All-Sky-Survey image shows a bright X-ray shell to the north of G78.2+2.1, and overlapping G78.2+2.1 on the SNR’s northern boundary. We make a new high resolution ROSAT PSPC mosaic of G78.2+2.1 showing for the first time the full extent and structure of the SNR G78.2+2.1 in X-rays. Chandra ACIS archival images of G78.2+2.1 are used to construct high-sensitivity, high resolution X-ray images in soft and hard X-ray bands. Chandra ACIS X-ray spectra of the center of G78.2+2.1 yield a column density of cm-2, in agreement with the value from the HI absorption spectrum. A Sedov model is applied to G78.2+2.1 yielding an age of 6800-10000 yr and an explosion energy of 0.5-1.7erg. A spectrum from the northern X-ray shell gives a column density of cm-2, showing that it is much closer to us than G78.2+2.1.
Two prominent hard X-ray sources C1 and C2 were identified in ASCA observations of G78.2+2.1 (Uchiyama et al. 2002). We use the Chandra ACIS observations, with their superior spatial and spectral resolution, to show that C1 is probably an extragalactic extended source, and that C2 is a point source with a power-law spectrum with the same column density as G78.2+2.1. For the northern X-ray shell, an early-type (B3 main sequence) star V1685 Cyg, at distance 980 pc, is found at the center of the shell. This star is identified as the star responsible for creating and heating the shell via its stellar wind.
6 Acknowledgements
This work supported by the Natural Sciences and Engineering Research Council of Canada. The Dominion Radio Astrophysical Observatory is operated as a national facility by the National Research Council of Canada. We thank the referees for important suggestions which lead to improvements in the paper.
References
- Baars et al. (1978) Baars, J. W. M., Dickel, H. R., & Wendker, H. J. 1978, Astron. & Astrophys., 62, 13
- Binney & Merrifield (1998) Binney, J., & Merrifield, M. 1998, Galactic Astronomy / James Binney and Michael Merrifield. Princeton, NJ : Princeton University Press, 1998. (Princeton series in astrophysics) QB857 .B522 1998
- Braun & Strom (1986) Braun, R., & Strom, R. G. 1986, Astron. & Astrophys. Suppl., 63, 345
- Bykov et al. (2004) Bykov, A. M., Krassilchtchikov, A. M., Uvarov, Y. A., et al. 2004, Astron. & Astrophys., 427, L21
- Cash et al. (1980) Cash, W., Charles, P., Bowyer, S., et al. 1980, Ap.J. Letters, 238, L71
- Cox (1972) Cox, D. P. 1972, ApJ, 178, 159
- English et al. (1998) English, J., Taylor, A. R., Irwin, J. A., et al. 1998, Publications Astronomical Society of Australia, 15, 56
- Gosachinskij (2001) Gosachinskij, I. V. 2001, Astronomy Letters, 27, 233
- Gottschalk et al. (2012) Gottschalk, M., Kothes, R., Matthews, H. E., Landecker, T. L., & Dent, W. R. F. 2012, Astron. & Astrophys., 541, A79
- Heiles (1964) Heiles, C. 1964, Ap.J., 140, 470
- Higgs et al. (1977) Higgs, L. A., Landecker, T. L., & Roger, R. S. 1977, The Astronomical Journal, 82, 718
- Knödlseder (2004) Knödlseder, J. 2004, arXiv:astro-ph/0407050
- Knödlseder et al. (2002) Knödlseder, J., Cerviño, M., Le Duigou, J.-M., et al. 2002, Astron. & Astrophys., 390, 945
- Kwok (2007) Kwok, S. 2007, Physics and Chemistry of the Interstellar Medium (University Science Books, Sausalito, Ca.)
- Ladouceur & Pineault (2008) Ladouceur, Y., & Pineault, S. 2008, Astron. & Astrophys., 490, 197
- Landecker et al. (1980) Landecker, T. L., Roger, R. S., & Higgs, L. A. 1980, Astron. & Astrophys. Suppl., 39, 133
- Leahy & Tian (2008) Leahy, D.A., Tian, W.W. 2008, Astron. & Astrophys., 480L, 25
- Leahy & Tian (2010) Leahy, D., & Tian, W. 2010, Astronomical Society of the Pacific Conference Series, 438, 365
- Lozinskaya et al. (2000) Lozinskaya, T. A., Pravdikova, V. V., & Finoguenov, A. V. 2000, Astronomy Letters, 26, 77
- Lozinskaya et al. (2002) Lozinskaya, T. A., Pravdikova, V. V., & Finoguenov, A. V. 2002, Astronomy Letters, 28, 223
- Manoj et al. (2006) Manoj, P., Bhatt, H. C., Maheswar, G., & Muneer, S. 2006, ApJ, 653, 657
- Mavromatakis (2003) Mavromatakis, F. 2003, Astron. & Astrophys., 408, 237
- Nieuwenhuijzen & de Jager (1990) Nieuwenhuijzen, H., & de Jager, C. 1990, Astron. & Astrophys., 231, 134
- Rygl et al. (2012) Rygl, K. L. J., Brunthaler, A., Sanna, A., et al. 2012, Astron. & Astrophys., 539, A79
- Schneider et al. (2006) Schneider, N., Bontemps, S., Simon, R., et al. 2006, Astron. & Astrophys., 458, 855
- Taylor et al. (2003) Taylor, A.R. et al. 2003, AJ, 125, 3145
- Tian & Leahy (2008) Tian, W.W., Leahy, D.A. 2008b, ApJ, 677, 292
- Trepl et al. (2010) Trepl, L., Hui, C. Y., Cheng, K. S., et al. 2010, Monthly Notices of the Royal Astronomical Society, 405, 1339
- Uchiyama et al. (2002) Uchiyama, Y., Takahashi, T., Aharonian, F. A., & Mattox, J. R. 2002, ApJ, 571, 866
- Weinstein, A. for the VERITAS Collaboration (2011) Weinstein, A., for the VERITAS Collaboration 2011, arXiv:1111.1034
- Zhang et al. (1997) Zhang, X., Zheng, Y., Landecker, T. L., & Higgs, L. A. 1997, Astron. & Astrophys., 324, 641