Dissociative recombination measurements of HCl+ using an ion storage ring
Abstract
We have measured dissociative recombination of with electrons using a merged beams configuration at the heavy-ion storage ring TSR located at the Max Planck Institute for Nuclear Physics in Heidelberg, Germany. We present the measured absolute merged beams recombination rate coefficient for collision energies from 0 to 4.5 eV. We have also developed a new method for deriving the cross section from the measurements. Our approach does not suffer from approximations made by previously used methods. The cross section was transformed to a plasma rate coefficient for the electron temperature range from to 5000 K. We show that the previously used DR data underestimate the plasma rate coefficient by a factor of 1.5 at K and overestimate it by a factor of 3.0 at K. We also find that the new data may partly explain existing discrepancies between observed abundances of chlorine-bearing molecules and their astrochemical models.
1 Introduction
Despite the fact that the elemental abundance of chlorine is orders of magnitude lower than that of more abundant elements such as carbon or oxygen, astrochemists have been interested in chlorine chemistry for nearly 40 years now. The evolving understanding of Cl in the interstellar medium (ISM) can be followed in a series of papers over this time (e.g., Jura 1974; Dalgarno et al. 1974; Blake et al. 1986; Federman et al. 1995; Amin 1996; Sonnentrucker et al. 2006; Neufeld & Wolfire 2009; Lis et al. 2010; De Luca et al. 2012; Neufeld et al. 2012). A surprising development in this is that, in spite of the low cosmic abundance of Cl, the latest observations indicate that the abundances of chlorine-containing molecules can be comparable to those of H2O or CH (Lis et al., 2010; Neufeld et al., 2012).
Until recently only one chlorine-bearing molecule had been observed in the ISM, namely HCl (Peng et al. 2010 and references therein). With the advent of the Herschel Space Observatory, H2Cl+ and HCl+ ions have now also been detected (Lis et al., 2010; De Luca et al., 2012). This allows for a much more detailed comparison of astrochemical models to the observations. The H2Cl+ abundances derived from these observations are over ten times greater than those of the latest models (Neufeld et al., 2012). Similarly, the observed HCl+ abundance is several times larger than predicted by models (Neufeld & Wolfire, 2009). One possible candidate for explaining these discrepancies would be an erroneous rate coefficient for dissociative recombination (DR) of HCl+ assumed in the models. For a detailed description of the Cl chemistry, see the review given by Neufeld & Wolfire (2009). To highlight the importance of HCl+ within the chlorine ISM chemistry, we discuss here a few of the key reactions in the network.
With a value of 12.97 eV the ionization potential of Cl lies slightly below that of atomic hydrogen. Thus, in the illuminated portions of interstellar clouds, photoionization of neutral atomic H does not shield neutral atomic Cl from the interstellar radiation field. As a result atomic chlorine is predominantly found in the form of Cl+. The uniqueness of chlorine astrochemistry is due to the exoergic formation of HCl+ via
| (1) |
All other elements predominantly found in interstellar clouds as singly charged atomic ions react endoergically with H2. Once HCl+ is formed it can react exoergically with H2 to create H2Cl+ via
| (2) |
Neutral HCl is then formed, in part, by DR of H2Cl+ through
| (3) |
However, HCl+ can also undergo DR via
| (4) |
This reaction reduces the abundance, slowing the formation of the H2Cl+ and HCl via Reactions 2 and 3, and thereby affecting their equilibrium abundances.
To the best of our knowledge, there have been no previous investigations into DR of HCl+ until recently (e.g., our experimental work and exploratory theoretical studies by Larson et al. 2012). Lacking reliable data, astrochemical models have used a “typical” diatomic DR rate coefficient for that of HCl+. It has been shown, however, that DR rate coefficients of diatomics can differ by large factors from alleged typical values. For example, for CF+ Novotny et al. (2005) measured a rate coefficient a factor of 4 lower than that commonly taken for the typical diatomic ion value. For this reason Neufeld et al. (2012) have identified the DR rate coefficient of HCl+ as an “urgently needed” parameter significantly affecting the uncertainty of chlorine-chemistry models.
To meet these needs, we have carried out DR measurements for HCl+. The DR pathways relevant for are described in Section 2. The experimental setup, measurement method, and data analysis are discussed in Section 3 of this paper. In Section 4 we present the resulting merged beams DR rate coefficient for , derive a DR cross section and subsequently the Maxwellian plasma DR rate coefficient. We discuss our results and their implications for astrochemistry in Section 5. A summary is given in Section 6.
2 DR pathways for HCl+
In any DR process the incident electron couples within the Frank-Condon region of the initial ionic state to form an excited neutral state (Larsson & Orel, 2008). This may autoionize back to form a molecular ion again, or it can dissociate into neutral DR products.
Depending on the nature of the excited neutral state into which the incident electron is captured, two basic types of DR can be distinguished (e.g., Larsson & Orel 2008). In direct DR this neutral state is electronically doubly excited and repulsive so that the molecule can directly dissociate. The range of electron energies accessible for the transition within the Frank-Condon region is given by the steepness of the neutral doubly excited state involved. Usually this range is large and results in broad structures in the DR cross section spectrum. Alternatively, the incident electron can be captured into a bound neutral state. Such levels have discrete total energies and give rise to sharp resonances in the energy dependence of the DR cross section as their predissociation contributes to DR. This process is called indirect DR. The dissociation in both DR types can induce multiple transitions between the electronic states.
The neutral bound levels involved in indirect DR can often be grouped into various Rydberg series. Members of a given series differ by the excitation level of the captured electron. Each such series converges as to a single bound level of the ionic core with specific rotational, vibrational, and electronic quantum numbers. In general, with increasing collision energy for a given Rydberg series, the density of the neutral states increases and then drops to zero above the series limit. DR resonances from this indirect recombination process may be experimentally unresolvable as they can overlap due to their natural widths and also due to the limited experimental energy resolution. However, what may still be experimentally distinguishable is a change in the DR cross section at the end of a neutral Rydberg series, i.e., at the electron-ion collision energy corresponding to the specific excitation of the ionic core. This change could be either an increase or decrease, depending on the specific pathways involved as well as potential quantum mechanical interferences (Larsson & Orel, 2008). The DR cross section may also drop above an ionic core excitation limit because electron impact excitation of the ion competes with DR occurring at energies above this limit.
Quantum interferences between neutral states belonging to various excitation channels may also lead to unexpected structures in the DR spectrum. More discussion can be found, for example in Larsson & Orel (2008), Wolf et al. (2011), and Waffeu Tamo et al. (2011). Lacking detailed information on these mechanisms for neutral levels lying in the electronic scattering continuum, we here use the location of the ionic excitation thresholds and of the main dissociation curves as a guide.
The basic properties of DR can be obtained from its thermochemistry. We can calculate the exothermicity for DR of in the ground state using the eV ionization energy of the hydrogen atom and the eV proton affinity of chlorine (Linstrom & Mallard, 2013). For collisions at this exothermicity results in an energy release of eV. This is less than the eV and eV energies needed to electronically excite Cl and H, respectively (Ralchenko et al., 2011). Hence, low energy DR of results in both atomic products being exclusively in their ground states. As the exothermicity is insufficient to internally excite the DR products, it goes instead into the kinetic energy released (KER), which is carried away by the products. The channels with excited Cl, excited H, or both excited become accessible only for eV, , and 2.5, respectively.
DR of multielectron systems such as is a complex process that involves a large number of resonances in the electron scattering continuum. The molecular structure of and HCl determine the behavior of the DR cross section versus electron-ion collision energy . The most likely dissociative route from potential energies near the ground state toward the H and Cl ground states is via the HCl repulsive potential curve. This curve crosses the ground state potential curve at internuclear distances somewhat smaller than the Franck-Condon region of the initial state (Bettendorff et al., 1982). Thus, low-energy DR here is most likely driven by the indirect process. In the first step the electron is captured to one of the ro-vibrationally excited neutral levels converging to an excited core. This then couples to the repulsive potential curve and predissociates. Data on molecular levels formed by optical excitation of HCl to states near (but below) the ionization threshold for forming are available from spectroscopic and theoretical studies (e.g., Bettendorff et al. 1982; Liyanage et al. 1995; Alexander et al. 1998; Romanescu & Loock 2007; Lefebvre-Brion et al. 2011; Long et al. 2013).
Based on the above discussion, structures in the energy dependence of the DR cross section may occur near excitation thresholds. For ground state , some of these limits are rotational excitations, fine structure excitation, and vibrational excitations. Another series worth mentioning may arise from electronic excitation of into the state.
Electron-induced processes that could compete with DR and thus reduce the DR signal are all endothermic. One of these is ion pair formation which can yield H++Cl- or H-+Cl+ at energies above 1.7 eV and 3.9 eV, respectively. Another electron-driven process is dissociative excitation (DE) forming H + Cl+ or H+ + Cl. This reaction is endothermic by eV and eV, respectively.
3 Experimental
3.1 Setup
Measurements were carried out at the TSR heavy ion storage ring of the Max Planck Institute for Nuclear Physics in Heidelberg, Germany (Habs et al., 1989). With a base pressure of mbar, TSR is ideally suited to simulate the two-body collision regime important for interstellar gas-phase chemistry. Details on various aspects of the merged beams technique as used at the TSR and the recent developments of the photocathode electron beam and the fragment imaging technique have been described by Amitay et al. (1996), Krantz et al. (2009), and Novotný et al. (2010). Here we discuss only those aspects specific to this study.
ions were produced in a cold-cathode Penning ion source from a mixture of H2 and HCl parent gases. Ions were extracted from the source and brought to a kinetic energy of 2.4 MeV using a Pelletron-type accelerator. The magnetically mass-filtered beam of was then selected for and injected into the TSR where it was stored for s.
The stored ion beam was merged for m with a nearly monoenergetic electron beam. This beam, which we refer to as the Target, is generated by a photocathode operated at temperatures of around 100 K (Orlov et al., 2004, 2005, 2009), thereby enabling us to perform electron-ion collision studies with high energy resolution (Sprenger et al., 2004). After ion injection at time and continuing until s, the electron beam was velocity matched to the ions. During this time elastic collisions of the ions with the low energy spread (i.e., cold) electron beam transferred energy from the circulating ions to the single-pass electrons. This mechanism of electron cooling of the ions, also known as phase-space cooling (Poth, 1990), results in reducing the ion beam velocity spread and a reduced ion beam diameter.
The ion beam energy of 2.4 MeV was limited by the highest available magnetic field strength available for deflecting the stored ions along the orbit within TSR. Velocity matching the electrons with the 36 amu ions resulted in an electron beam energy as low as 36.9 eV. Under these conditions, obtaining a phase-space cooled ion beam requires an electron beam of both high density and low temperature. This was accomplished by utilizing the cryogenically cooled photocathode electron source in the Target which provided an electron density of cm-3 and a low energy spread as we discuss below. The cooling capability of the Target for high-mass ions was demonstrated earlier for a beam of 31 amu CF+ ions (Krantz et al. 2009). In the present measurement, in spite of the low electron energy and high ion mass, an ion beam diameter as low as 0.5 mm was obtained. The second electron beam device of the TSR, referred to as the Cooler (Steck et al., 1990), proved to have insufficient cooling force to cool such heavy, slow molecular beams within the available storage time. Therefore the Cooler was not used for the results presented here.
After cooling, the Target electron beam was used as the interaction medium to measure DR for a range of electron-ion center of mass collision energies by varying the laboratory energy of the electron beam. Neutral DR products generated in the Target were not deflected by the first dipole magnet downstream of its position in the TSR and continued ballistically until they hit a detector. Data were collected with this detector from s to s as described in Section 3.3.
The energy spread of the photocathode-generated electron beam is parametrized by effective temperatures and , perpendicular and parallel to the bulk electron beam velocity, respectively. The magnetic field guiding the electrons was higher at the photocathode, as compared to the interaction zone, by a factor of for most of the measurements. This expansion of the magnetic field leads to a lowering of the perpendicular electron temperature (Danared, 1993; Orlov et al., 2005). By fitting dielectronic recombination resonances (Lestinsky et al., 2008) and from fragment imaging spectra obtained at similar values of (Stützel, 2011), we deduce for the present measurement effective temperatures of meV and eV, where is the Boltzmann constant. Here and throughout all uncertainties are quoted at an estimated statistical confidence level. Some of the data were also acquired with an expansion factor of , for which a reduced transverse electron temperature of meV is estimated, while is expected to remain unchanged (e.g., Danared 1993). The relevant temperatures and enter the data analysis as described in Section 3.4.
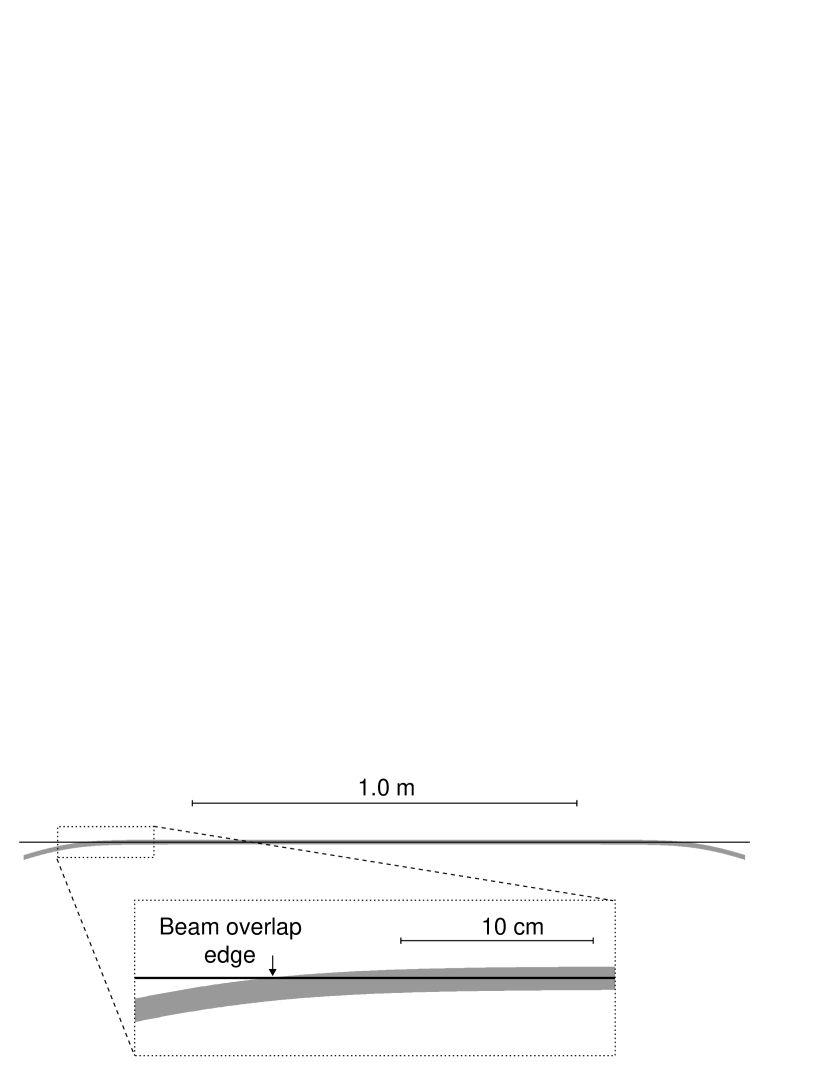
The interaction geometry is determined by the shapes of the overlapping electron and ion beams. The electron beam geometry is determined by the magnetic fields in the Target (Sprenger, 2003). The electron beam can be treated as a cylindrical body, bent at the ends, with a diameter given by the product of the cathode size and the square root of the expansion factor . This yields mm and 17.8 mm for and 40, respectively. The cooled ion beam diameter is typically less than 0.5 mm. The electron and ion beam geometries are shown in Figure 1 and are discussed in more detail in Appendix A.
The fact that the electron beam is significantly wider than the ion beam enabled the complete spatial overlap of the ion beam by the electrons in the interaction region. We optimized the alignment of the beams by minimizing the time needed for phase-space cooling of the beam (Hochadel et al., 1994). Better alignment gives a better overlap, thereby reducing the required cooling time. Observationally, we monitored the necessary cooling time and beam size either using a beam profile monitor (Hochadel et al., 1994) or by examining the center-of-mass for DR events as projected on the MCP-imaging detector (Amitay et al., 1996; Krantz et al., 2009).
The bulk electron beam energy in the laboratory frame, , is needed to calculate the center of mass electron-ion collision energies during the measurement. We determine from the measured cathode voltage by correcting it for the space charge of the electron beam (Kilgus et al., 1992). This correction requires knowing the electron density profile, which we measured with the method described in Sprenger et al. (2004). The electron density is expected to be homogeneous along the beam axis.
3.2 HCl+ internal excitation
The ions produced in the discharge are expected initially to possess electronic, vibrational, rotational, and fine-structure excitation. We estimate that much of this internal excitation radiatively relaxes during the s of electron cooling. Electronically, the only known metastable state below the dissociation limit is the A which lies eV above the X ground state. Measured and calculated radiative lifetimes for A transitions are shorter than s (Pradhan et al. 1991 and references therein). The known radiative lifetimes for vibrational relaxation of the X electronic ground state span from ms for to ms for (Pradhan et al., 1991). Higher vibrational levels are expected to decay even faster. Thus we expect the stored ions to cascade quickly to their ground electronic and vibrational levels.
We predict that the rotational lifetimes are sufficiently short so that during the initial phase most of the rotations will have radiatively relaxed and come into equilibrium with the K black-body radiation of the vacuum chamber. We have calculated the rotational radiative lifetimes of X for levels ranging from to . In actuality, we could truncate the calculations at , as the higher levels decay so rapidly that they do not affect the precision of the model. Our approach uses a method similar to that of Amitay et al. (1994). The static dipole moment for was taken from Cheng et al. (2007). The dominant emission lines are expected to be . Restricting ourselves to these transitions, we have built a relaxation model using the spontaneous radiative decay lifetimes along with stimulated emission and absorption by the 300 K black-body radiation. For the initial rotational excitation we have taken a Boltzmann distribution at a temperature of 8000 K. This is approximately the excitation temperature derived for CF+ produced in the same ion source (Novotný et al., 2009). After the initial 16 s of ion storage, the predicted average excitation energy exceeds the 300 K equilibrium by only 10%. The excitation energy averaged over the ion population during the s measurement window exceeds room temperature excitation by only 3%. This predicted level of excitation might be slightly overestimated due to the omission of spin-orbit coupling which may provide extra decay pathways. We have also not accounted for the possible additional acceleration of the rotational cooling from super-elastic ion collisions with electrons (e.g., Shafir et al. 2009).
The one excitation which is unlikely to relax during ion storage is the fine structure splitting of the X which amounts to meV (Sheasley & Mathews, 1973). We are unaware of any published lifetime estimates for this transition. However, for a rough estimate we can use the radiative lifetime of the fine-structure excited level in the isoelectronic atomic system Ar+ with an energy of meV. That lifetime is calculated to be 23.7 s (Fischer & Tachiev, 2013). Since the radiative decay rate of this magnetic dipole transition scales as the third power of the transition frequency, then leaving aside the details of the transition matrix element, we expect that the lifetime of the corresponding level in the molecular state will be longer by almost an order of magnitude. Hence, the X radiative lifetime is expected to significantly exceed the ion storage time here.
3.3 Measurement procedure
Data acquisition began after the 16 s period of injection and cooling were completed. During data acquisition the Target beam energy was stepped repeatedly between cooling, measurement, reference, and off (all defined below). The time durations were 35, 25, 25, and 25 ms, respectively. An additional 5 ms delay before each step was added to allow the power supplies to reach the desired voltage. This cycle was repeated 130 times for a total of s.
For the first step, cooling, the electrons were velocity matched to the ions at an electron energy of eV in the laboratory frame. These interleaved cooling steps ensured a constant phase-space spread of the ions during the data taking.
In the second step, measurement, the electron beam energy was detuned, giving a mean energy of in the laboratory frame. The nominal center of mass collision energy can then readily be calculated from the mean electron and ion velocities in the laboratory frame. This yields what we call the detuning energy
| (5) |
The detector count rate in this step was used to determine the merged beams rate coefficient versus . The detuning energy was changed for each new ion injection.
The third step, reference, was included as a cross check and for normalization. The energy in this step was set to a constant value of eV. The resulting signal was used to monitor the ion beam intensity.
In the last step, off, the electron beam was not admitted into the interaction region. The resulting background signal was due solely to ion interactions with the residual gas inside TSR.
DR events were measured using a cm2 Si surface-barrier detector located m downstream of the Target. Fragments from a given dissociation event arrived at the detector with only a few nanosecond difference in flight times. This is shorter than the detector time resolution and so only one pulse was counted for each dissociation event, independent of the number of products reaching the detector. The high exothermicity of DR results in relative fragment kinetic energies of up to eV. This can cause a large displacement between the fragments when reaching the detector. The resulting positions of some of the H fragments exceeded the size of the detector. The heavier Cl fragments, however, were confined to a narrow cone and 100% of the DR-generated Cl struck the detector. We verified this using an MCP-imaging technique (e.g., Amitay et al. 1996). Thus, to achieve essentially 100% DR event counting efficiency, we derive our signal from the count of detector events independent of the number of fragments detected in each of them.
The detector count rate consisted of both DR and background events. The dominant source of this background were collisions of the ions with the residual gas. We have corrected for these events by taking the count rate at measurement and subtracting the count rate acquired with the electron beam off. Our approach does not account for potential background due to non-dissociative recombination, but this is expected to be negligible at the energies studied (Krauss & Julienne, 1973; Dalgarno & Black, 1976; Larsson & Orel, 2008). Additional background due to electron-driven DE forming was not an issue as the measured collision energies were all significantly below the DE threshold of 5.3 eV.
The measured relative merged beams DR rate coefficient is determined by normalizing the recorded DR signal by the electron density and ion number (e.g., Amitay et al. 1996). The electron beam density is well detemined by the measured beam current, energy, and geometry (Sprenger et al., 2004). However, the maximum stored ion current of A was too low to be determined directly using a DC current transformer. Instead we used a measurement of the relative ion beam intensity by taking the detector signals from the reference and off steps as proxies of the relative ion beam intensity. This allows us to normalize our measured data to obtain a relative merged beams DR rate coefficient versus . The whole curve was then scaled using an absolute measurement of the merged beams DR rate coefficient at matched electron and ion velocities (i.e., eV). Here we used an independent method based on precise ion beam storage life time measurements with and without the electron beam present in the interaction zone (Novotný et al., 2012). This method requires using the length of the beam interaction region, which was determined from the known beam geometries to be m.
In the past, researchers have corrected the merged beams DR rate coefficient for the effects from the merging and demerging of the electron beam with the stored ions (Lampert et al., 1996). Below we introduce a new data analysis method which avoids the necessity of this correction.
3.4 Generating a Plasma DR Recombination Rate Coefficient
Using storage ring results one can generate a DR rate coefficient suitable for a plasma with a Maxwell-Boltzmann collision energy distribution. This involves deconvolving the measured DR data to remove the effects of the experimental electron velocity spread and the beam overlap geometry. Mowat et al. (1995) and Lampert et al. (1996) have presented approximate methods for addressing these two issues. The resulting cross section can then be convolved with a Maxwell-Boltzmann distribution to generate a plasma rate coefficient suitable for astrochemical modelling. Here we have developed a more precise method for deriving the cross section which avoids making the approximations used by Mowat et al. and Lampert et al.
3.4.1 Measured Merged Beams DR Rate Coefficient
Experimentally we have measured a merged beams DR rate coefficient which is given by
| (6) |
Here is the DR cross section; and are the center of mass electron-ion energy and the relative velocity, respectively; and is the center of mass energy spread taking into account both the electron beam energy spread and the experimental geometry. The relationship between the collision energy and velocity is given by , where is the reduced mass of the collision system. The large mass difference between the electron and ion allows us to set . The term is a function of the detuning energy; the electron energy spread, which is given by the effective temperatures and ; and the overlap geometry between the beams, symbolically represented as .
For parallel ion and electron beams the velocity spread can be described by a “flattened” Maxwellian distribution in the center of mass frame. This velocity distribution is discussed in more detail by Andersen et al. (1989) and Poth (1990), while the corresponding energy distribution function is described by Schippers et al. (2004). Note, that a pre-factor of is missing from equation (1) given in Schippers et al.
In the merging and de-merging regions of the Target, the energy distribution is additionally distorted due to the beams no longer running co-linearly. Lampert et al. (1996) discusses the corresponding increase of collision energies, assuming that . We are not aware, however, of an analytical representation of which accounts for the effects of both the velocity spread and the full overlap geometry. To address this issue, we have developed a numerical method for describing such an energy distribution which we discuss below.
3.4.2 Limitations of Previous Methods for Extracting a DR Cross Section
The traditional methods for deconvolving the cross section from the merged beams rate coefficient first correct the measured data for the overlap geometry effects using, for example, the method of Lampert et al. (1996). The corrected data are then treated as if the beams are parallel with an energy distribution , giving
| (7) |
The analytic form of is given by Schippers et al. (2004) and the characteristic experimental energy spread in corresponds to (Müller, 1999)
| (8) |
For high energies, where , the relative width decreases to a small value. In that case, can often be approximated by a delta function . Equation (7) then collapses to , and the cross section simplifies to
| (9) |
The situation is not so simple for . This regime is particularly critical for obtaining an accurate plasma rate coefficient at the low temperatures relevant to the cold ISM. At these low detuning energies the cross section can be approximately derived using a method introduced by Mowat et al. (1995). Their technique makes use of the fact that typically in ion storage ring experiments. They go on to neglect the longitudinal energy spread by setting . This makes and the shape of independent of and one can then deconvolve using Fourier analysis.
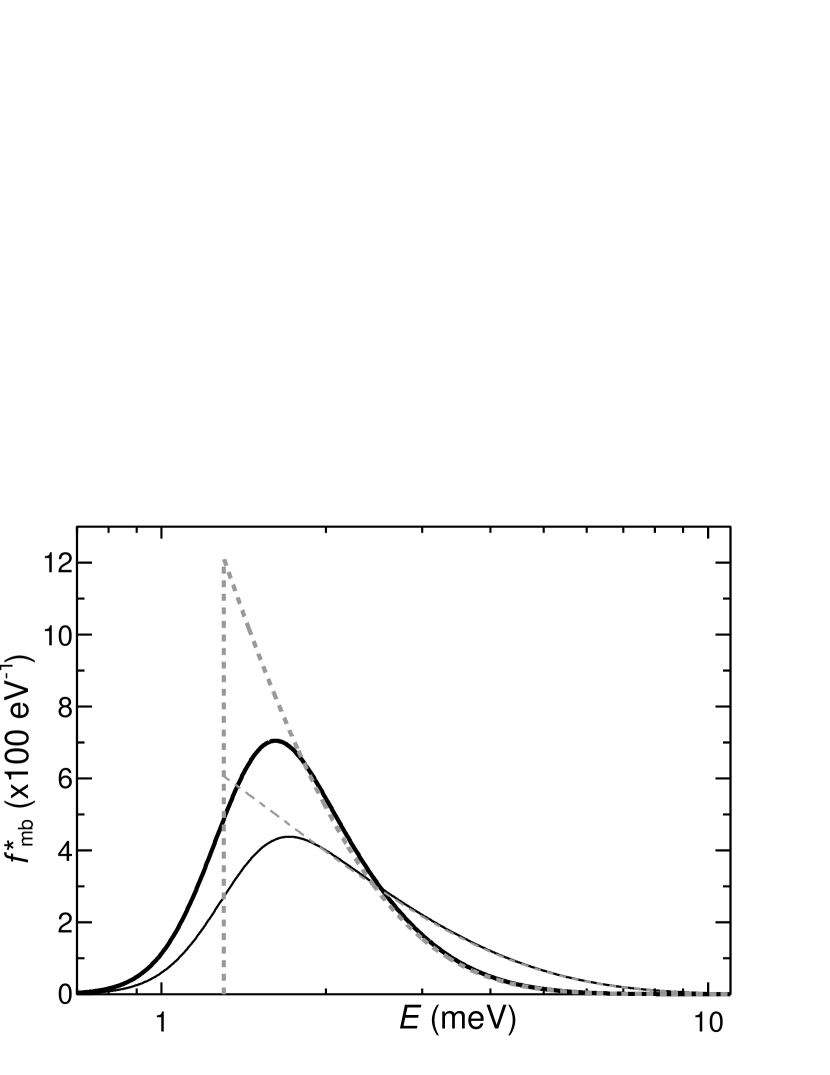
There are, however, a number of issues which the Mowat et al. approach raises. Their method ignores the fraction of electron-ion collision energies lying below . This can be seen in Figure 2 which shows the energy distribution function using two sets of Target electron temperatures. As a representative detuning energy we have chosen meV, which corresponds to a typical particle energy at molecular cloud temperatures of K. In Figure 2, we also plot for the two Target values of but with . These energy distributions clearly differ from those using a realistic eV. In there is no collision energy population below . For eV and an assumed value of meV (0.825 meV), about 5% (10%) of the distribution is shifted to below . This fraction increases for decreasing or with increasing , further reducing the validity of setting in order to extract cross sections. Additionally, the potential errors in this method may increase if the cross section at low energies is highly structured or increases rapidly with decreasing energy. By using an energy distribution function which does not accurately represent the experimental conditions, the deconvolutions can accordingly under- or over-estimate the cross section at a given value of .
3.4.3 New Method for Extracting a DR Cross Section
The approach we use here is to create an empirical model cross section spectrum and, following equation (6), convolve it with to generate a model experimental rate coefficient . We represent using a histogram-shaped function with an energy binning comparable to the energy resolution at as given by equation (8) with . The amplitudes within each bin are treated as free fitting parameters and adjusted iteratively to minimize the between the model and the measured . The combined effects of the electron beam energy spread and the overlap geometry are treated using a Monte Carlo simulation of for the integration of equation (6). In some cases (especially when the bin size becomes smaller than the energy resolution) the resulting can fluctuate significantly from one to the next bin due to numerical instabilities. The corresponding uncertainties, however, essentially cancel out when integrating the cross section to generate a plasma rate coefficient as described below. This method accounts for both the electron energy spread and the beam overlap geometry. Thus our deconvolution method does not require the measured merged beams rate coefficient be corrected for the overlap geometry, nor is it based on the assumption that . In contrast to the traditional methods we thereby largely avoid the uncertainties introduced by those assumptions. Technical details of our method are discussed at length in Appendix A.
3.4.4 Derived Plasma DR Rate Coefficient
Using the extracted as a representation of , we can generate a rate coefficient for a plasma with a thermal Maxwell-Boltzmann distribution . The resulting rate coefficient as a function of the plasma temperature is given by
| (10) |
The analytical form of is well known and numerical integration of equation (10) is straightforward.
3.5 Uncertainties in the measured merged beams DR rate coefficient
The dominant uncertainty in the measured merged beams DR rate coefficient derives from the ion beam storage life time measurements used to put the experimental results on an absolute scale. This error amounts to 11%. Additional minor sources of error arise from the electron density evaluation () and the uncertainty on the electron beam geometry within the Target (). The total systematic uncertainty for the absolute scaling is then 12%.
The statistical uncertainty of each data point is given by the counting statistics for the number of signal and background counts. At collision energies meV this error amounts to %. At higher energies this error increases as the signal and background become comparable. The statistical error is % at eV and grows up to % at eV.
4 Results
4.1 Merged Beams Recombination Rate Coefficient
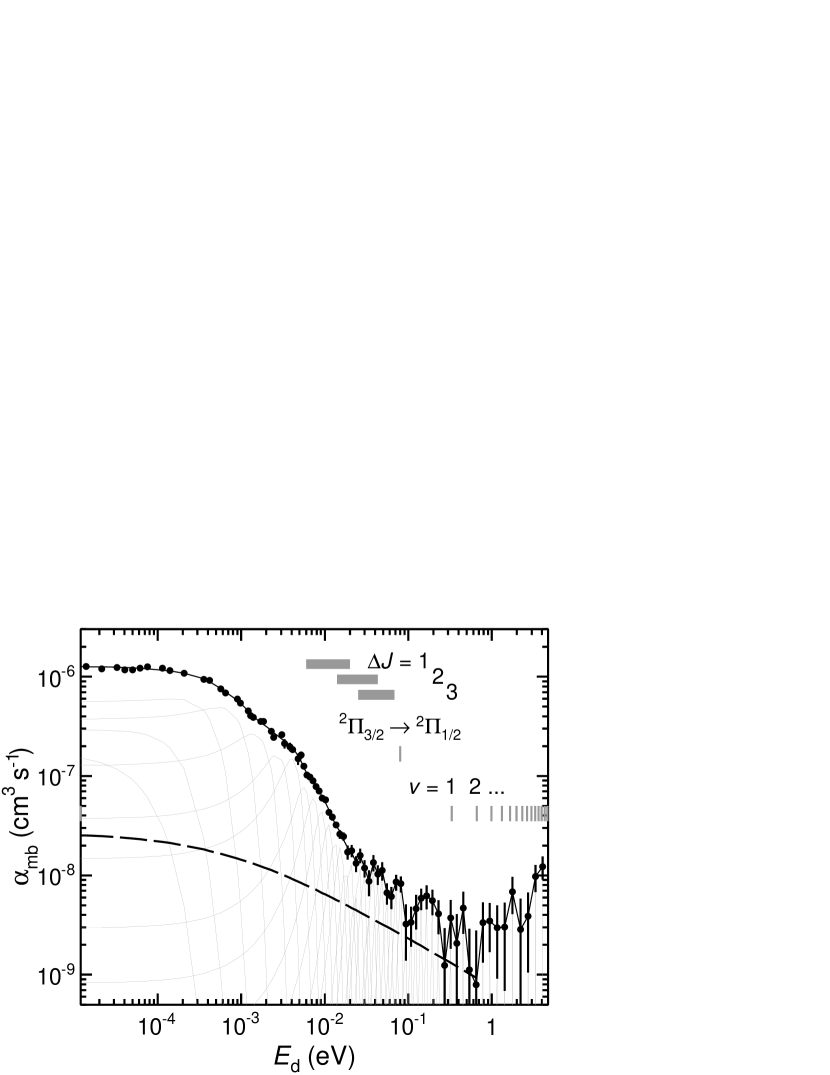
Figure 3 presents our merged beams rate coefficient for DR of . The error bars show the 1 counting statistics. The detuning energy ranges from eV to 4.5 eV. The data were acquired with and cover the storage times of s.
Although our model for the rotational relaxation of HCl+ discussed in Section 3.1 indicates that most of the ions are in the thermal equilibrium with the black body radiation of the TSR chamber, a small amount of rotational relaxation may still occur during the measurement period. To test for any effect of this cooling we split the acquired data into two sets covering the storage times of s and s and analyzed these data sets independently. DR rate coefficients typically depend on the rotational excitation of the parent ions (Larsson & Orel, 2008). Hence any significant change in rotational population should be observable in the DR rate coefficient spectra. However, to within their statistical uncertainties, the resulting two data sets for were equal at all values of . This strongly suggests that the rotational excitation of the ions reached equilibrium with the black body radiation of the vacuum chamber during the initial electron cooling phase.
A possible source of concern in storage ring merged beams experiments is that the low energy can potentially be distorted if the ion beam energy is dragged by the detuned electron beam. The derivation of through equation (5) rests on the assumption of a constant mean ion beam velocity which is matched to the mean electron beam velocity at cooling. This assumption breaks down if during the measurement step the ion beam is dragged towards the detuned electron beam velocity by dynamical friction forces of the same type as those causing electron cooling (Poth, 1990). The actual collision energy is then smaller than that deduced from equation (5). Since low energy DR for HCl+ increases with decreasing energy this will enhance the measured signal at higher energies over what one would expect if there were no dragging. This will appear in the data as a broadening of close to 0 eV. In order to exclude such an experimental artifact we have performed a series of tests described below. Based on these studies, we believe the ion beam dragging is not an issue in our experiment and that the low energy shape in is due solely to DR.
The stability of the ion beam energy was tested by varying the duration of the various steps in the data cycle. The standard data cycle was chosen to optimize the duty factor and cooling as well as reduce dragging effects. All of the tests in this paragraph further improved cooling and reduced any potential dragging effects, but at the expense of significantly decreasing the measurement duty factor. The cooling step was lengthened by a factor of to provide additional cooling and improve the ion beam stability. The measurement step was shortened from 25 ms to 10 ms to reduce any dragging effects. Additionally we varied the energy difference between the reference step and the cooling step. If cooling were insufficient this would help to further minimize the dragging of the ion beam energy when at reference. To within the statistical accuracy of the measurement, all of these tests produced an that agreed with the data obtained under standard measurement conditions. Thus dragging of the ion beam energy does not appear to contribute to the observed low energy rate coefficient.
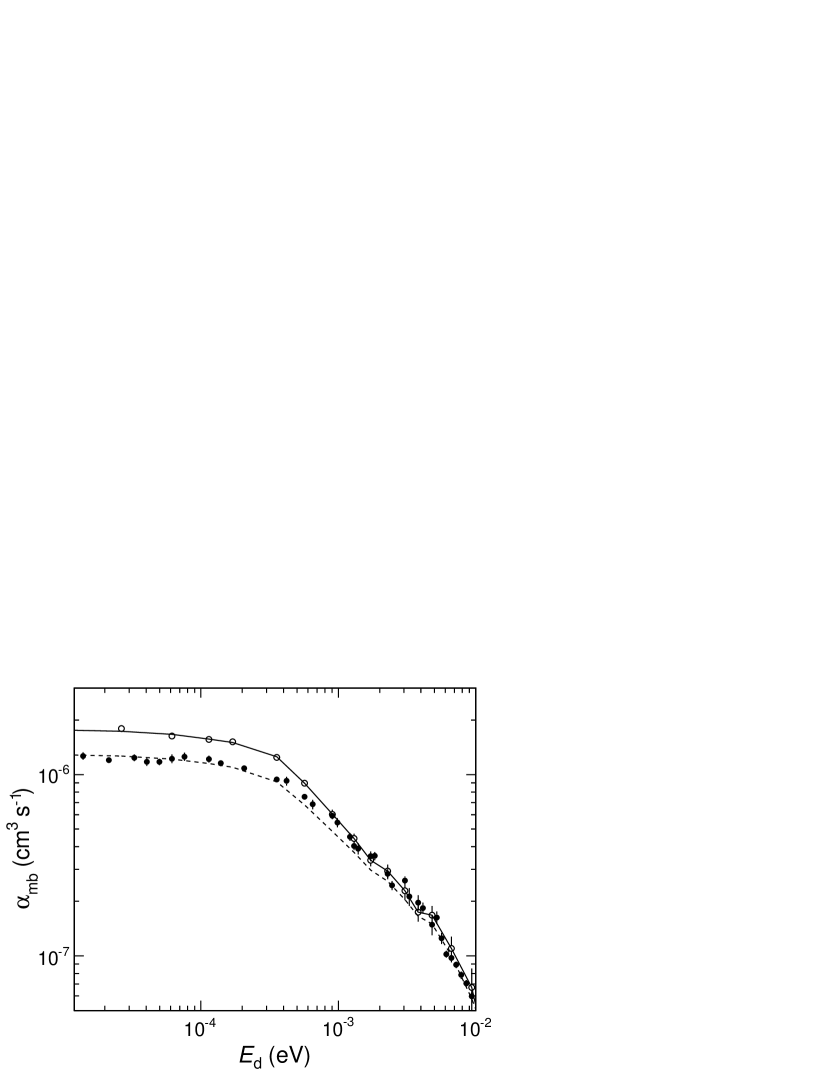
To further test the DR origin of the low energy data, we have measured the behavior of for two different energy spreads. As one reduces the width of the collisional energy distribution this results, after averaging over the electron energy distribution, in a higher amplitude for at eV. Dragging, on the other hand, modifies only the width of the low energy DR spectrum but not the peak amplitude. Here we narrowed the experimental energy spread by increasing the adiabatic expansion factor of the magnetic guiding field in the Target electron gun from to . The tranverse temperature is expected to scale as . Figure 4 presents both the and results. The higher expansion data do indeed show an additionally increased amplitude of the rate coefficient at meV. The half width half maximum of the data below meV also narrowed by %. This strongly suggests that the observed low energy rate coefficient is caused by the DR process and not by beam dragging artifacts.
Still, the higher amplitudes in the low energy data do not fully exclude a combination of dragging effects mixed with DR. Thus, as an additional quantitative test we have converted the measured to a model of the rate coefficient expected at the lower expansion factor . A real DR resonance, as opposed to a dragging effect, should appear similar in both the converted and the measured . To generate we deconvolved the data using the corresponding energy distribution and the fitting procedure described in Section 3.4.3. We then reconvolved the extracted cross section with to obtain the model of experimental rate coefficient .
Figure 4 compares the measured rate coefficient and the converted . The measured and the corresponding model are also displayed. We find satisfying agreement between and . The small differences remaining are attributed, in part, to uncertainties in the scaling used to derive for from that at . To first order we expect to scale as , but there may be small nonlinear terms which we have ignored. These may introduce uncertainties in the used which could carry over into the extracted cross section and finally into . Additionally, we did not measure at energies of meV. So, above this point we have used the data. This may produce small discrepancies at energies meV.
4.2 Recombination Cross Section
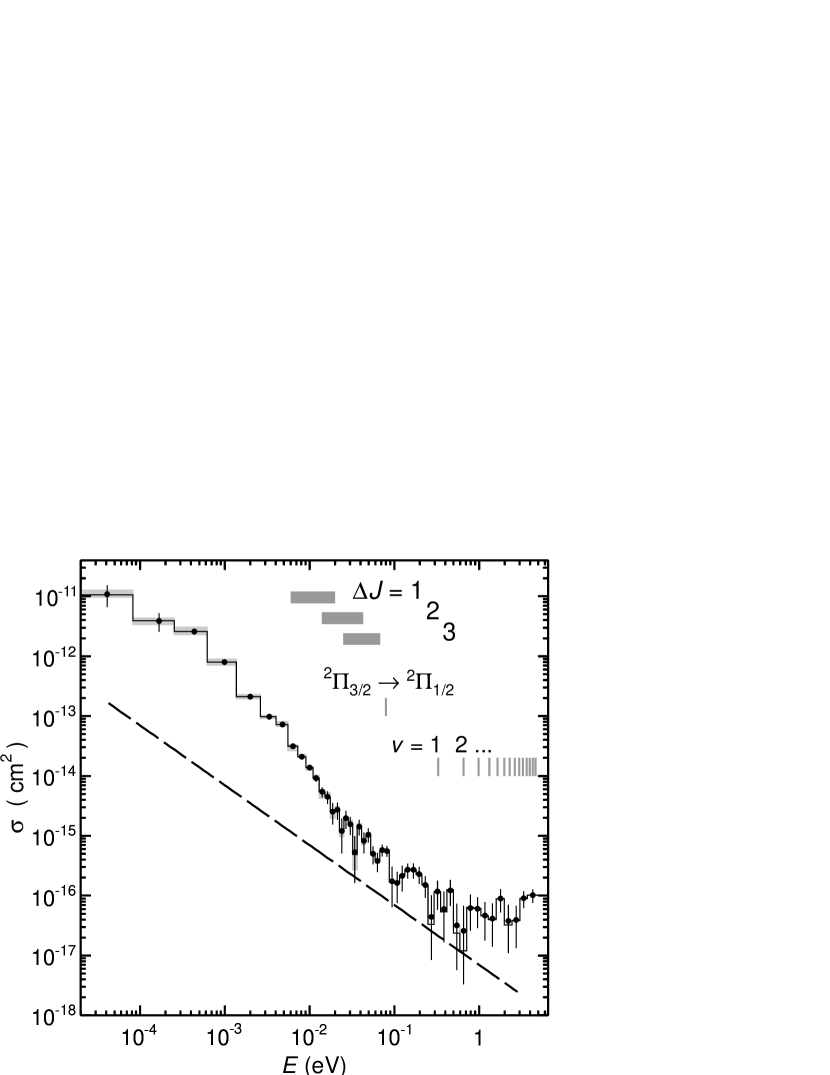
We have converted the experimental DR rate coefficient to a cross section using a procedure introduced in Section 3.4.3 and described in detail in Appendix A. The resulting is plotted in Figure 5 for the energy range eV. The lower edge of the first energy bin is set to and is not displayed on the logarithmic energy scale of the plot.
Deriving the cross section involves fitting with a sum of model rate coefficients, each convolved using a single cross section bin. These sub-functions, , are plotted in Figure 3. We plot the corresponding collision energy distribution function for several values of in Figure 6. To ensure physical meaning of the results we limited the fitting parameters to positive values only. The fitting yielded a minimum , where is the number of degrees of freedom in the fit.
To explore the numerical stability of the fitting, we have derived the cross section from a set of 1000 simulated merged beams spectra . Each data point in a given simulated spectrum was obtained from the sum of the experimental value and an additive shift which was randomly chosen from a Gaussian distribution centered around zero and with a width equal to the 1 statistical error in . Each was then fitted to derive a cross section. The cross section values in each energy bin nearly follow a normal distribution. In some bins, however, up to 8% of the fitted values converged to zero. We attribute this behavior to the numerical instability for some of the fits, possibly due to converging to a local minimum or because of strong correlations with cross section values in neighboring energy bins. The mean cross section values for each bin are displayed in Figure 5. The standard deviations above and below the mean are displayed by asymmetric vertical error bars and reflect the statistical errors propagated from . The mean cross section values differ from those obtained directly from the experimental data by only a small fraction of the standard deviations. To test the accuracy of the mean cross section we have convolved it using equation (6) to generate a merged beams rate coefficient and compared the result to , which was derived by fitting the experimental data. The difference between the two is less than a fifth of the statistical uncertainties in our experimental data.
Additionally we have investigated the sensitivity of the cross section to the uncertainties in and . We have used their extreme values meV and eV to generate and derived the cross section from the 1000 model rate coefficients, as discussed above. The mean cross sections were then compared to the one obtained with the most probable electron beam temperatures meV and eV. The differences originating from and were added in quadrature and are displayed by gray bars in Figure 5. The sensitivity of to the electron beam parameters generally decreases with increasing energy. This is due to the decreasing relative energy spread with increasing energy. There is, though, an enhancement of the sensitivity seen in few bins at eV. We attribute this to narrow structures in the cross section with spacing comparable to the energy resolution at these energies (of order 2.5 meV). The effect of the electron beam temperature parameters is significantly lower than the statistical errors at all energies. Lastly, the 12% uncertainty on the absolute scaling of directly propagates to . However, this error is too small to be seen in Figure 5.
4.3 Plasma Recombination Rate Coefficient
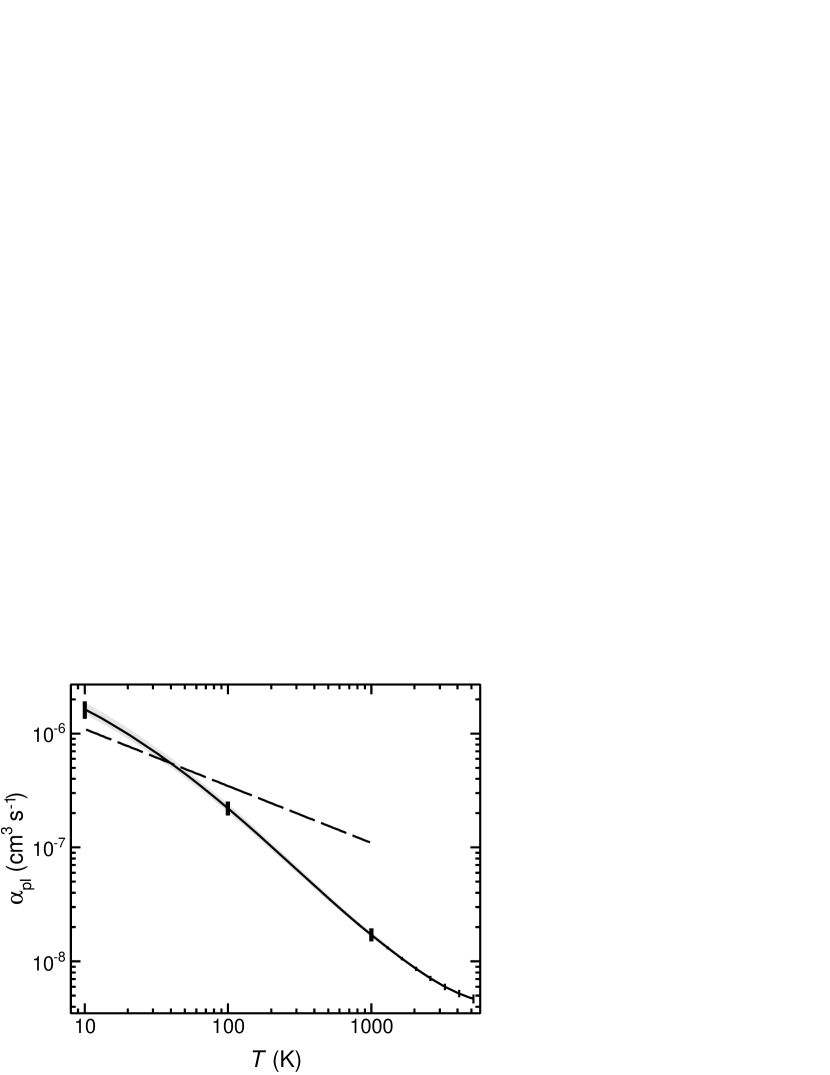
We have used the model cross section as a representation of the DR cross section and converted it to a plasma rate coefficient using the procedures described in Section 3.4.4. The resulting is plotted in Figure 7 for a plasma temperature range K.
To propagate the statistical uncertainty from the measured to the derived we follow the technique used for the cross section in Section 4.2. First we created a set of 1000 simulated merged beams spectra based on the measured and the corresponding statistical uncertainty. Each was used to derive a cross section which was subsequently convolved with to generate a plasma rate coefficient . The spread in the values of at each closely followed a normal distribution. The Gaussian width of this spread at each was taken as the statistical accuracy for . For below 400 K these errors are less than 1%. They increase at higher temperatures and reach at 5000 K.
The uncertainties in and introduce an error in the derived . The plasma rate coefficient displayed in Figure 7 was derived for meV. We have also evaluated taking into account the meV uncertainty in and repeated the analysis using the limiting values of . The corresponding respective change of is % at K, decreases to % at 100 K, and is less than % above 1000 K. Varying within the estimated range of values has a much smaller effect. At K the change in is % and drops to less than % at . In this paragraph positive (negative) changes in correspond to increased (decreased) and .
The only other important systematic uncertainty in is the 12% absolute scaling error propagated from . We treat this scaling error and those from and as independent and add them in quadrature. The resulting total systematic error amounts to 17% at 10 K, 14% at 100 K, and less than 13% above 1000 K.
We have fitted our results for ease of use in astrochemical models. We found that neither the two-parameter function commonly used to describe DR plasma rate coefficients (e.g., Florescu-Mitchell & Mitchell 2006) nor the more general three-parameter extension used in astrochemical databases (e.g., Woodall et al. 2007; Wakelam et al. 2012) are able to fit our measured plasma rate coefficient accurately over the entire temperature range from 10 to 5000 K. Such fits do not reproduce our results to within better than 40%. Therefore we propose a modified form of the two-parameter function, namely
| (11) |
where
| (12) |
This new function allows for more accurate fits than the previously used fitting functions. The results of fitting equation (11) to our data over the full temperature range are given in Table 1. The deviations of from the data are less than 1% over the full temperature range. It should be emphasized that the internal temperature of the ions in the experiment yielding these result is expected to lie near 300 K.
5 Discussion
5.1 Comparison with previous analysis methods
The principal difference between our new method for deriving the cross section and the plasma rate coefficient compared to the methods used in previous merged beams DR measurements lies in the conversion of the merged beams rate coefficient to a cross section. Our new method is essentially a one-step process. The traditional method, though, requires two steps. First it corrects the merged beams rate coefficient for the increased electron-ion collision energy in the merging and de-merging regions while ignoring the electron velocity spread (Lampert et al., 1996). Then the corrected rate coefficient is deconvolved to yield a cross section, assuming parallel beams in the interaction zone and zero electron energy spread along the beam axis, i.e., (Mowat et al., 1995). Our approach allows us to estimate the errors arising from the assumptions for each of these two steps.
To test the validity of the Lampert et al. (1996) step, we have extracted the cross section from using our new approach and converted it to using equation (7). The resulting then represents the rate coefficient as it would be measured in a merged beams configuration with parallel beams only and no merging or de-merging sections. Next we have reanalyzed our measured data using the method of Lampert et al. (1996) to generate . Comparing the two data sets and at high energies, where , our correction procedure and the one proposed by Lampert et al. (1996) are equal to within their statistical accuracies. However, at lower energies, the traditional correction results in a merged beams rate coefficient which is up to % higher. Both the toroid correction methods of Lampert et al. and ours increase the merged beams rate coefficient at these low energies. Therefore the difference can be interpreted as an over-correction by the older approach. We attribute this difference to the neglected electron velocity spread in the Lampert et al. method.
Next we tested the combined effects of the Lampert et al. (1996) and the Mowat et al. (1995) steps. For this we employed our new method for the cross section derivation with two modifications. First, we used as the input rate coefficient, and second, we generated the collision energy distribution for straight beams while setting . This latter step simulates the Mowat et al. approximation. We then converted the extracted cross section to the plasma rate coefficient using equation (10). The resulting plasma rate coefficient is larger than by % at K, % at K, and to % at K. The spread in these values due to the uncertainties in and is less than .
The errors in for DR which are introduced by the Lampert et al. (1996) and Mowat et al. (1995) approximations are only a few percent, much smaller than the other systematic errors in the measurement. However, larger differences could potentially arise if the measured merged beams rate coefficient were highly structured or decreased more rapidly with increasing energy. Additionally, it is not trivial to implement a Fast Fourier Transform (FFT) method, such as recommended by Mowat et al. (1995), using DR data on a non-uniform energy grid. Furthermore, the FFT method does not weigh the input data points by their statistical importance. All of these issues are readily accounted for by our new approach. The advantages of our new method are likely to be critical for reliably analyzing the expected highly structured DR data from upcoming Cryogenic Storage Ring (CSR) experiments on rotationally cold molecular ions (von Hahn et al., 2011; Krantz et al., 2011).
5.2 Experimental DR rate coefficient
Up to eV, the DR rate coefficient decreases rapidly with increasing energy. This behavior is typical for low energy DR spectra (Florescu-Mitchell & Mitchell, 2006; Larsson & Orel, 2008). Yet, as shown in Figure 3, the slope between and 30 meV is much steeper than the rate coefficient derived from the expected for the direct DR process (Bates, 1950; Larsson & Orel, 2008). As described in Section 2, direct electron capture to a repulsive neutral potential surface is unlikely at these low collision energies. Thus at these energies, DR is probably dominated by the indirect process and the enhanced rate coefficient most likely results from numerous DR resonances. These are unresolved due to both the energy resolution of the experiment and the natural widths of the resonances.
Based on the collision energies these resonances probably originate from neutral Rydberg states converging to a rotationally excited core. The exact positions for the resonances cannot be easily determined because of the large number of combinations between the initial K distribution of excited states and the many energetically accessible ro-vibrationally excited levels in the neutral Rydberg system. Still, the steep decrease of between meV may be attributed to the rotational structure of . As discussed in Section 2, each rotational level of the ion is expected to be the end point for a Rydberg DR resonance series. In Figure 3 we plot the range of such end point energies allowing for , 2, and 3 changes of the angular momentum with respect to the initial ionic state. The range of the end points (indicated by the gray bars) is due to the initial rotational excitation of the ions (using rotational parameters from Sheasley & Mathews 1973; the levels spacings are nearly the same for ions in the or state, respectively.) The energy range of the fastest decrease in matches best the lowest possible change of the angular momentum, i.e., . Thus, it appears likely that indirect processes involving rotational excitation of the K ions play an important role for the DR rate at the lowest energies. Correspondingly, rotational excitation rates by low energy electron collisions of may be large.
Somewhat more resolved structures appear between 30 and 300 meV. There is the suggestion of a neutral Rydberg series limit at meV corresponding to the fine-structure transition (Sheasley & Mathews, 1973) and at eV corresponding to the excitation (Linstrom & Mallard, 2013). The structures are blurred partly by the energy resolution of the experiment and partly by the initial rotational distribution of the stored ions. Further interpretation cannot be given without more detailed calculations.
The increase in at eV can be attributed to opening of additional dissociation pathways forming either excited Cl (above 0.6 eV) or excited H (above 1.9 eV) or both. Moreover, Rydberg resonances involving the A electronically excited core may also be present. Ion pair production, which can reduce the DR signal as discussed in Section 2, will set in above 1.7 eV. At these energies, the statistical uncertainties in our data prevent us from being able to discern the impact on the DR signal due to the opening up of these channels. DE channels are not accessible in the investigated collision energy range.
5.3 Cross Section
The derivation of the DR cross section from the merged beams rate coefficient makes the DR data independent of the experimental configuration. On the other hand, the experimental energy spread together with the statistical quality of the rate coefficient data limits the resolving power of our method for deriving the cross section. We have adjusted the cross section binning such that it provides good energy resolution while keeping the numerical instabilities small. The interpretation of the derived cross section is therefore somewhat limited and one needs to proceed cautiously in interpreting any structures which have an energy width comparable to the energy binning. But given that caveat, much of the structure discussed in above in can also be seen in the cross section.
5.4 Plasma rate coefficient
Our experimentally derived DR plasma rate coefficient for displays an unusually steep slope. Existing astrochemical models usually approximate DR of by (Neufeld & Wolfire, 2009)
This is believed to correspond to DR of typical diatomic molecular ions (Florescu-Mitchell & Mitchell, 2006). However, some astrochemical databases use a value 1.5 times higher for (e.g., Woodall et al. 2007), though there is no obvious reason for this. Taking the ratio of yields 1.5, 1.1, 0.64, 0.33, and 0.16 at , 30, 100, 300, and 1000 K, respectively. Such differences are larger than our experimental error bars. Thus we find that the “typical” diatomic DR rate coefficient is incorrect in both magnitude and temperature dependence for HCl+. Note, however, that our derived rate coefficient is for an internal temperature of 300 K of the ions.
5.5 Astrochemical implications
Our new data suggest that HCl+ depletion by DR in the cold ISM ( K) is faster than or similar to that currently assumed in existing astrochemical models. However, at higher temperatures the new data display a slower HCl+ destruction by DR. As HCl+ leads to the formation of H2Cl+, the H2Cl+ abundance will also decrease or increase when using our new data, depending on the temperature. Unfortunately, the kinetic temperatures of the observed environments were not directly derived in the works of Lis et al. (2010), De Luca et al. (2012), and Neufeld et al. (2012). Model calculations (Neufeld & Wolfire, 2009) predict that there is an abundance maximum of in the outer parts of dark interstellar clouds which, at an opacity of , are less dense than the core and with a temperature of K are also hotter. In these regions DR is predicted to clearly dominate the destruction of . Thus, our measured DR rate coefficient (which is about a factor of 4 lower than the ones used in current astrochemical models) will augment the predicted abundances in that region, leading to an improved agreement with the observed densities. It will also affect the H2Cl+ abundance in the outer parts of the clouds (which also predicted an abundance maximum at roughly the same cloud density as the one for is found), since a lesser efficient competition by the DR of will allow more H2Cl+ to be formed by reaction of with H2.
Neufeld et al. (2012) have explored the effect of lowering the DR rate coefficient on the discrepancy between the predicted and observed and H2Cl+ abundances. In their astrochemical model they decreased of to . The resulting abundances of and H2Cl+ increased by factors of 2.7 and 1.3, respectively. In both cases the calculated abundances are still far too low to match the greater than ten times larger observed abundances. The result of their tests suggests that our new DR data, which are about four times smaller than at the relevant temperature, cannot fully explain the discrepancy between current astrochemical models and the observations. Still, our new data differ from not only in magnitude, but also in the temperature dependence. Therefore the test of Neufeld et al. (2012) does not directly describe the effect of our new DR data and their calculations should be repeated in order to fully evaluate the remaining discrepancy.
We also note that our experimental data are for HCl+ rotationally excited to K. In the cold ISM, however, the internal excitation is expected to be much lower. In the very low density environment in interstellar clouds, the collision rate is much lower than the typical radiative decay time (Spitzer, 1978). Thus is generally even lower than the kinetic temperature and most of the molecules are expected to be in their rotational ground state. The response of the DR rate coefficients to has not yet been studied systematically. The few existing studies on light ions find that the measured merged beams rate coefficient exhibits an increasingly rich resonant structures with decreasing (e.g., Amitay et al. 1996, Zhaunerchyk et al. 2007, Petrignani et al. 2011, Schwalm et al. 2011). This can be explained by the smaller number of rotational states that contribute with decreasing . The individual resonant structures thereby become resolved as they no longer overlap with resonances of other, energetically higher states. Low values of can result in either a lower or higher plasma rate coefficient, depending on the particular shape of the cross section. We expect that future DR measurements at the CSR facility will be able to address this issue by investigating molecular ions rotationally colder than what can be achieved with TSR.
6 Summary
We have measured the absolute DR rate coefficient for in a merged beams configuration at electron-ion collision energies from 0 eV to 4.5 eV. Using a novel method, we have converted the experimental merged beams rate coefficient to a cross section and then to a plasma rate coefficient. Our new approach provides more precise results and better control on uncertainties as compared to previously used methods. At molecular cloud temperatures below K, the resulting plasma rate coefficient is similar or faster than that typically assumed for DR of other diatomic molecular ions. However, at higher temperatures relevant for HCl+ observations, DR of HCl+ is slower than previously expected. Thus our data indicate that the current issues in modeling chlorine chemistry in interstellar clouds may be partly resolved by our new DR data.
Appendix A Deconvolving the measured merged beams rate coefficient
In Section 3.4.3 we briefly introduced a new method for deriving a cross section from the measured merged beams rate coefficient. This approach begins with a model cross section which we multiply by the relative collision velocity and then, following equation (6), convolve the product with the center of mass energy distribution function . This generates a model rate coefficient . We iteratively modify the parameters defining the shape of to minimize the between the measured and the model . In this Appendix we discuss the core of our deconvolution method, namely the numerical evaluation of equation (6).
The required collision energy distribution is not known in analytical form. So we use a Monte Carlo simulation which includes the effects of both the electron velocity spread and the beam overlap geometry. The Monte Carlo method requires a large number of simulated events to reach a low statistical uncertainty for the multidimensional . The resulting computational demands rise steeply as the power of the number of dimensions. This can be partly reduced by fixing the electron energy spreads and and also fixing the merged beams geometry , as none of these parameters change during the measurement and can thus be kept constant during the fit.
The required computational time can be further reduced by using a good discretization of the dimension. We model as a histogram with non-uniform bin widths. For , we choose bin widths similar to the experimental energy resolution for . At higher energies we use broader bins, but which are still much narrower than the structure typically observed in TSR DR measurements of . A consequence and also advantage of this approach is that the exact energy bin positions and widths are not critical and can be fixed during fitting without any significant loss in the precision of the fit.
With a fixed energy binning we can then transform the model form of equation (6) into the summation
| (A1) |
where is the model cross section in energy bin and and are the edges of the bin. Defining the function
| (A2) |
we can re-express equation (A1) as
| (A3) |
Because the integrals are independent of the fitting parameters , the integrals can be calculated prior to the iterative -minimization procedure. As a result, the overall fitting time is reduced and is dominated by the initial generation of the integrals. For a given required statistical accuracy, this scales linearly with number of cross section bins and with the number of fitted energy points . Additionally, because the form of equation (A3) is a linear combination of the constant factors scaled by the fitting parameters , it allows us to use efficient fitting algorithms (e.g., Press et al. 2007).
We calculate the integrals employing a numerical Monte Carlo method (e.g., Press et al. 2007). In short, we use a model of the merged beams geometry in which we generate a large number of collision events according to the fixed experimental parameters , , , and . Events are generated by randomly selecting the dissociation position in as well as the electron velocity vector for the given values of , and . The exact probability distributions used are discussed below.
For each event , we calculate the electron-ion collision velocity and the corresponding center of mass collision energy . The propagation through the model of the randomized dissociation position and electron velocity vector ensures that the set of values generated for follows the desired distribution. Hence the numerical integration of equation (A2) reduces to a simple summation given by
| (A4) |
where is the total number of simulated events. For each energy , we generate events. This provides a statistical precision better than for the resulting . The fitting sub-functions are shown in Figure 3.
Although not directly needed for the cross section derivation, one can similarly obtain an average value of the distribution function in energy bin as
| (A5) |
The histograms are plotted in Figure 6 for several values of . Here we have chosen a very narrow energy binning so that the histogram closely approximates . For comparison, we also plot in Figure 6, the energy distribution function for parallel beams . This helps to highlight the extension of the high energy tail due to the merging and demerging of the beams.
We model the electron beam as a cylindrical body with the shape described in Section 3.1. Given that the ion beam diameter is much smaller than the electron beam and that the magnetic fields in the Target are too weak to significantly affect the ions, we can approximate the ion beam as a straight line of zero diameter. We assume uniform electron and ion beam densities within the model beams and can therefore treat the event probability distribution as uniform over the entire interaction region.
Because of the large difference between the electron and ion masses and the phase-space cooling, the velocity spread of the cooled ion beam has a negligible effect on the experimental energy spread . Thus we can model the ions with a constant laboratory velocity of with no velocity spread. The electron velocity vectors are randomized in the laboratory frame. The orientation of the electron beam bulk velocity is determined from the electron beam geometry at the position of each simulated event. The velocity components perpendicular to the electron beam axis are described by a Gaussian distribution centered around and with a width of . In the parallel direction the velocity distribution is centered at with a Gaussian width of . The electron-ion collision velocity is obtained by subtracting the ion and electron velocity vectors. The corresponding energy is then used for the summation condition in equation (A4) to decide to which each event contributes.
Lastly we note that choosing an appropriate energy binning for the model cross section is essential in order to avoid numerical instabilities when fitting the model to the measured . Bins significantly narrower than the energy resolution or than the energy spacing between the measured data points give an under-determined fitting system which results in fitted values with large uncertainties strongly correlated with neighboring bins. On the other hand, using bins which are too broad results in too coarse of a fitting function and a poorer quality of the fit.
We have developed a general recipe to define an optimal cross section energy binning which does not suffer from these effects. The bins are defined at lower energies starting with the lower energy edge of the first bin set to 0 eV, and the upper edge to . The edges of subsequent bins are set to . At energies we set the step to . At higher energies we set the bin width to be approximately the energy resolution given by equation (8). This is motivated by the fact that structures in the cross section which are separated by less than can not be resolved. For energies the spacing between the measured points is often larger than . For these cases we set the bin edges to fall between the measurement points, i.e, , so that each point in effectively contributes to only one cross section bin.
The binning generated by this method was tested on several DR spectra from previous TSR measurements for other systems. In all cases a high quality fit was achieved with reasonable numerical stability. The remaining errors, due to residual numerical instabilities, basically integrate away when calculating the plasma rate coefficient using equation (10). As a result, the dominant error in is due to the statistical and systematic errors in and the uncertainties in and . The resulting uncertainty as it relates to our HCl+ results are discussed in Section 4.
References
- Alexander et al. (1998) Alexander, M. H., Li, X., Liyanage, R., & Gordon, R. J. 1998, Chem. Phys., 231, 331
- Amin (1996) Amin, M. Y. 1996, Earth, Moon and Planets, 73, 133
- Amitay et al. (1994) Amitay, Z., Zajfman, D., & Forck, P. 1994, PhRvA, 50, 2304
- Amitay et al. (1996) Amitay, Z., Zajfman, D., Forck, P., et al. 1996, PhRvA, 54, 4032
- Andersen et al. (1989) Andersen, L. H., Hvelplund, P., Knudsen, H., & Kvistgaard, P. 1989, PhRvL, 62, 2656
- Bates (1950) Bates, D. R. 1950, Phys. Rev., 78, 492
- Bettendorff et al. (1982) Bettendorff, M., Peyerimhoff, S. D., & Buenker, R. J. 1982, CP, 66, 261
- Blake et al. (1986) Blake, G. A., Anicich, V. G., & Huntress, W. T. 1986, ApJ, 300, 415
- Cheng et al. (2007) Cheng, M., Brown, J. M., Rosmus, P., et al. 2007, PhRvA, 75, 012502
- Dalgarno & Black (1976) Dalgarno, A., & Black, J. H. 1976, Rep. Prog. Phys., 39, 573
- Dalgarno et al. (1974) Dalgarno, A., de Jong, T., Oppenheimer, M., & Black, J. H. 1974, ApJ, 192, L37
- Danared (1993) Danared, H. 1993, NIMPA, 335, 397
- De Luca et al. (2012) De Luca, M., Gupta, H., Neufeld, D., et al. 2012, ApJL, 751, L37
- Federman et al. (1995) Federman, S. R., Cardell, J. A., van Dishoeck, E. F., Lambert, D. L., & Black, J. H. 1995, ApJ, 445, 325
- Fischer & Tachiev (2013) Fischer, C. F., & Tachiev, G. 2013, MCHF/MCDHF Collection, Version 2, 35, available online at http://physics.nist.gov/mchf
- Florescu-Mitchell & Mitchell (2006) Florescu-Mitchell, A., & Mitchell, J. 2006, Phys. Rep., 430, 277
- Habs et al. (1989) Habs, D., Baumann, W., Berger, J., et al. 1989, 43, 390
- Hochadel et al. (1994) Hochadel, B., Albrecht, F., Grieser, M., et al. 1994, NIMPA, 343, 401
- Jura (1974) Jura, M. 1974, ApJ, 190, L33
- Kilgus et al. (1992) Kilgus, G., Habs, D., Schwalm, D., et al. 1992, PhRvA, 46, 5730
- Krantz et al. (2009) Krantz, C., Orlov, D. A., Hoffmann, J., et al. 2009, JPhCS, 192, 012025
- Krantz et al. (2011) Krantz, C., Berg, F., Blaum, K., et al. 2011, JPhCS, 300, 012010
- Krauss & Julienne (1973) Krauss, M., & Julienne, P. S. 1973, ApJL, 183, L139
- Lampert et al. (1996) Lampert, A., Wolf, A., Habs, D., et al. 1996, PhRvA, 53, 1413
- Larson et al. (2012) Larson, Å., Fonseca dos Santos, S., & Orel, A. E. 2012, Bull. Am. Phys. Soc., 57(5), 46
- Larsson & Orel (2008) Larsson, M., & Orel, A. E. 2008, Dissociative recombination of molecular ions (Cambridge: Cambridge University Press)
- Lefebvre-Brion et al. (2011) Lefebvre-Brion, H., Liebermann, H. P., & Vázquez, G. J. 2011, JChPh, 134, 204104
- Lestinsky et al. (2008) Lestinsky, M., Lindroth, E., Orlov, D. A., et al. 2008, PhRvL, 100, 033001
- Linstrom & Mallard (2013) Linstrom, P., & Mallard, W., eds. 2013, NIST Chemistry WebBook, NIST Standard Reference Database Number 69, national Institute of Standards and Technology, Gaithersburg MD, 20899, http://webbook.nist.gov
- Lis et al. (2010) Lis, D. C., Pearson, J. C., Neufeld, D. A., et al. 2010, A&A, 521, 5
- Liyanage et al. (1995) Liyanage, R., Yang, Y.-a., Hashimoto, S., Gordon, R. J., & Field, R. W. 1995, JChPh, 103, 6811
- Long et al. (2013) Long, J., Wang, H., & Kvaran, A. 2013, JChPh, 138, 044308
- Mowat et al. (1995) Mowat, J. R., Danared, H., Sundström, G., et al. 1995, PhRvL, 74, 50
- Müller (1999) Müller, A. 1999, RSPTA, 357, 1279
- Neufeld & Wolfire (2009) Neufeld, D. A., & Wolfire, M. G. 2009, ApJ, 706, 1594
- Neufeld et al. (2012) Neufeld, D. A., Roueff, E., Snell, R. L., et al. 2012, ApJ, 748, 37
- Novotny et al. (2005) Novotny, O., Mitchell, J. B. A., LeGarrec, J. L., et al. 2005, J. Phys. B, 38, 1471
- Novotný et al. (2009) Novotný, O., Motapon, O., Berg, M. H., et al. 2009, J. Phys. Conf. Ser., 192, 012021
- Novotný et al. (2010) Novotný, O., Buhr, H., Stützel, J., et al. 2010, J. Phys. Chem. A, 114, 4870
- Novotný et al. (2012) Novotný, O., Badnell, N. R., Bernhardt, D., et al. 2012, ApJ, 753, 57
- Orlov et al. (2009) Orlov, D. A., Krantz, C., Wolf, A., et al. 2009, J. App. Phys., 106, 054907
- Orlov et al. (2005) Orlov, D. A., Sprenger, F., Lestinsky, M., et al. 2005, JPhCS, 4, 290
- Orlov et al. (2004) Orlov, D. A., Weigel, U., Schwalm, D., Terekhov, A. S., & Wolf, A. 2004, NIMPA, 532, 418
- Peng et al. (2010) Peng, R., Yoshida, H., Chamberlin, R. A., et al. 2010, ApJ, 723, 218
- Petrignani et al. (2011) Petrignani, A., Altevogt, S., Berg, M. H., et al. 2011, PhRvA, 83, 032711
- Poth (1990) Poth, H. 1990, Phys. Rep., 196, 135
- Pradhan et al. (1991) Pradhan, A. D., Kirby, K. P., & Dalgarno, A. 1991, JChPh, 95, 9009
- Press et al. (2007) Press, W. H., Teukolsky, S. A., Vetterling, W. T., & Flannery, B. P. 2007, Numerical Recipes 3rd Edition: The Art of Scientific Computing, 3rd edn. (Cambridge University Press)
- Ralchenko et al. (2011) Ralchenko, Y., Kramida, A., Reader, J., & NIST ASD Team. 2011, Atomic Spectra Database, version 4.1.0, http://physics.nist.gov/asd, National Institute of Standards and Technology, Gaithersburg, MD.
- Romanescu & Loock (2007) Romanescu, C., & Loock, H.-P. 2007, JChPh, 127, 124304
- Schippers et al. (2004) Schippers, S., Schnell, M., Brandau, C., et al. 2004, A&A, 421, 7
- Schwalm et al. (2011) Schwalm, D., Shafir, D., Novotny, S., et al. 2011, JPhCS, 300, 012006
- Shafir et al. (2009) Shafir, D., Novotny, S., Buhr, H., et al. 2009, PhRvL, 102, 223202
- Sheasley & Mathews (1973) Sheasley, W. D., & Mathews, C. W. 1973, JMoSp, 47, 420
- Sonnentrucker et al. (2006) Sonnentrucker, P., Friedman, S. D., & York, D. G. 2006, ApJ, 650, L115
- Spitzer (1978) Spitzer, L. 1978, Physical Processes In The Interstellar Medium (Wiley)
- Sprenger (2003) Sprenger, F. 2003, Dissertation, Universität Heidelberg, http://www.ub.uni-heidelberg.de/archiv/4415
- Sprenger et al. (2004) Sprenger, F., Lestinsky, M., Orlov, D. A., Schwalm, D., & Wolf, A. 2004, NIMPA, 532, 298
- Steck et al. (1990) Steck, M., Bisoffi, G., Blum, M., et al. 1990, NIMPA, 287, 324
- Stützel (2011) Stützel, J. 2011, Dissertation, Universität Heidelberg, http://archiv.ub.uni-heidelberg.de/volltextserver/11597/
- von Hahn et al. (2011) von Hahn, R., Berg, F., Blaum, K., et al. 2011, NIMPB, 269, 2871
- Waffeu Tamo et al. (2011) Waffeu Tamo, F. O., Buhr, H., Motapon, O., et al. 2011, PhRvA, 84, 022710
- Wakelam et al. (2012) Wakelam, V., Herbst, E., Loison, J.-C., et al. 2012, ApJS, 199, 21
- Wolf et al. (2011) Wolf, A., Buhr, H., & Novotný, O. 2011, JPhCS, 300, 012008
- Woodall et al. (2007) Woodall, J., Agúndez, M., Markwick-Kemper, A. J., & Millar, T. J. 2007, A&A, 466, 1197
- Zhaunerchyk et al. (2007) Zhaunerchyk, V., Al-Khalili, A., Thomas, R. D., et al. 2007, PhRvL, 99, 013201
| Parameter | Value | Unit |
|---|---|---|
| dimensionless | ||
| K | ||
| K | ||
| K | ||
| K |
Note. — The values in parentheses give the error for the least significant digit shown.