Discovery of a small diameter young supernova remnant G354.4+0.0
Abstract
We report discovery of a shell like structure G354.4+0.0 of size 1.6′ that shows morphology of a shell supernova remnant. Part of the structure show polarized emission in NRAO VLA sky survey (NVSS) map. Based on 330 MHz, 1.4 GHz Giant Metrewave Radio Telescope (GMRT) observations and existing observations at higher frequencies, we conclude the partial shell structure showing synchrotron emission is embedded in an extended HII region of size . The spectrum of the diffuse HII region turns over between 1.4 GHz and 330 MHz. HI absorption spectrum shows it to be located more than 5 kpc away from Sun. Based on morphology, non-thermal polarized emission and size, this object is one of the youngest supernova remnants discovered in the Galaxy with an estimated age of years.
1 Introduction
Galactic OB star counts, pulsar birth rates, iron abundance and estimates of supernova rates in Local Group galaxies suggest that there should be more than 1000 supernova remnants (SNRs) in our Galaxy (Tammann et al., 1994). However, only 274 are presently cataloged (Green, 2009). This lack of detection is partly due to poor angular resolution of existing surveys which disfavors detection of small diameter SNRs (Green, 1991) that future surveys with upcoming facilities (Kassim et al., 2005; Bowman et al., 2013) could address. Supernova rate in our Galaxy is about 2.8 per century (Li et al., 2011). Hence, in the last 400 years more than ten supernova explosions have taken place in the Galaxy. However, only two of them (Cas A and G1.9+0.3) have been reported. There are only three SNRs of angular size 1.5′ listed in the catalog of Green (2009). They are G1.9+0.3, G54.1+0.3 and G337.00.1. Among them, G1.9+0.3 has been shown to be the youngest known SNR (Reynolds et al., 2008) in the Galaxy with age of about 150 years. The SNR G54.1+0.3 is centrally powered by a pulsar and the size of the emission region is 1.5′. The actual size of the outer shell is unknown (Leahy et al., 2008) and hence the remnant age could be much more than a few hundred years. The size of the SNR G337.00.1 has been measured to be 5 pc (Sarma et al., 1997), that suggests it to be a candidate young SNR.
The line of sight towards the Galactic center passes the longest distance through the Galaxy, that enhances the probability of detecting an SNR. Therefore, we had conducted observations of a few regions close to the Galactic center (GC) with the Giant Metrewave Radio Telescope (GMRT) at 330 MHz (Roy & Bhatnagar, 2006). The main objective of these observations was to confirm the nature of certain candidate SNRs. From one of these fields, a small diameter (1.5′) object G354.46+0.07 with partial shell morphology was identified. To confirm its nature, this field was re-observed with the GMRT at 1.4 GHz and 330 MHz. Here we describe its confirmation as a newly discovered young SNR in the Galaxy. In Sect. 2, observations and data analysis procedures are described. Results and Discussions are presented in Sect. 3 and 4 respectively.
2 Observations and data analysis:
The field mentioned above was observed on 17th and 18th June 2007 at 1.4 GHz and 330 MHz respectively. In the absence of system temperature measurement at GMRT, we have corrected for the variation of sky temperature from calibrator to the target source following Roy & Rao (2004) keeping the automatic level control of the antennas off 111NCRA technical report at http://ncralib1.ncra.tifr.res.in:8080/jspui/handle/2301/437. During the 330 MHz and 1.4 GHz observations, each of the 2 IFs had a bandwidth of 4 MHz and 16 MHz respectively. Both the IFs during the above set of observations had 128 spectral channels. At 1.4 GHz, it provided a velocity resolution of 6.6 km s-1 and a velocity coverage of more than 400 km s-1. 3C48 was used as primary flux density calibrator in both the frequency bands. HI absorption towards 3C287 is known to be less than 1% (Dickey et al., 1978) and was used as bandpass calibrator at 1.4 GHz. 1751253 and 1714252 222VLA calibrator catalog from http://www.vla.nrao.edu/astro/calib/manual/csource.html were used as phase calibrators at 1.4 GHz and 330 MHz respectively. The 1.4 GHz data was analyzed following the standard procedures in AIPS 333http://www.aips.nrao.edu. After preliminary editing, time and frequency based calibration, a continuum image of the object was made leaving aside the channels showing evidence of strong absorption. This image was used to phase only self calibrate the data for all the frequency channels. Before making the channel maps, the AIPS task UVLSF was used to subtract a constant term with a constant slope across the frequency channels corresponding to the continuum from the visibility data. To reduce the effect of comparatively large-scale structures in atomic hydrogen (HI) along the line of sight, we have done a high-pass filtering with a short uv cut-off of 1 k that resolves out structures with sizes 3′ while making the spectral line maps for detection of HI absorption.
During analysis of the 330 MHz data, after calibration and editing, each 10 adjacent frequency channels were averaged providing a channel width of 1.25 MHz in the output data. This process significantly reduces data volume while keeping bandwidth smearing smaller than the synthesized beam during imaging up to half power point of the antennas. The initial images were improved by phase-only and later by amplitude & phase self-calibration. The final image is made using multi-resolution CLEAN (Wakker & Schwarz, 1988).
3 Results:
3.1 Continuum images
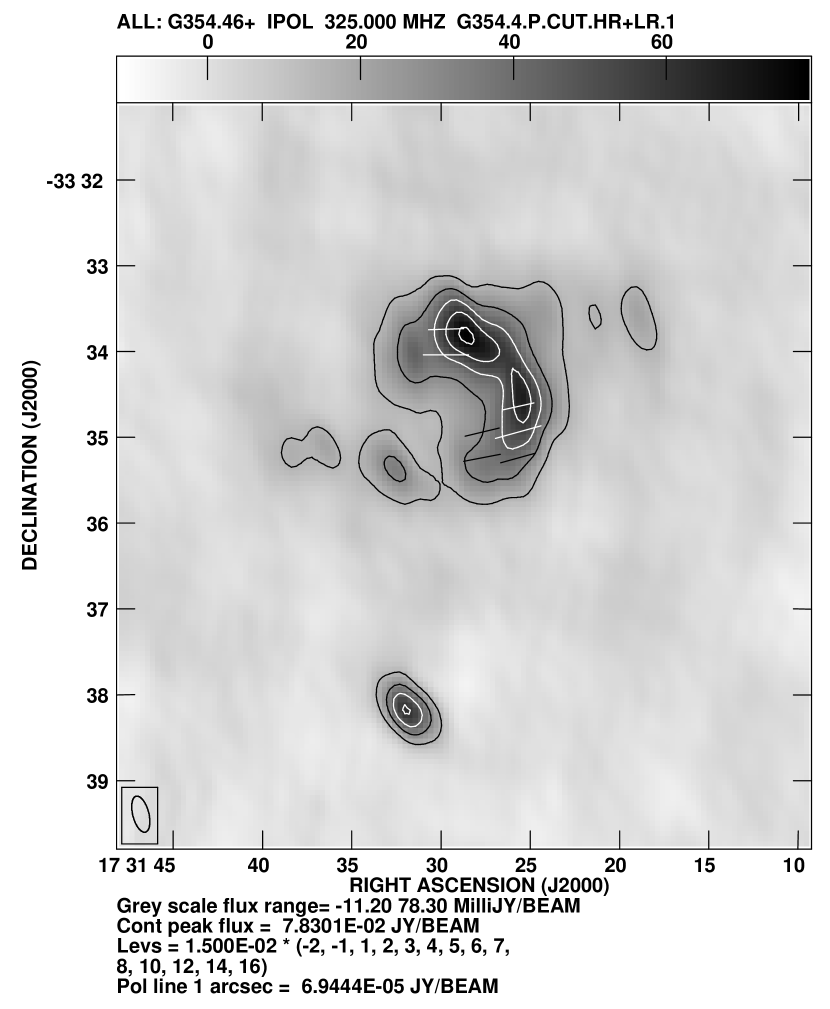
The continuum map of this source made from 330 MHz data having a resolution of 26 is shown in Fig. 1. This map is sensitive to large scale structures of size up to 30′. The size of the object G354.4+0.0 is 1.5′ and shows morphology of a partial shell. To detect any polarized emission and thereby confirm non-thermal emission, we have searched the NRAO VLA sky survey (NVSS) (Condon et al., 1998) map at the same location of the sky, and the polarization vectors from NVSS (resolution 45) are overlaid on Fig. 1. To make the polarization total intensity and angle images from the NVSS Stokes Q and U maps (rms noise 0.3 mJy beam-1), all pixels below a signal to noise ratio of 4.5 were blanked and correction for noise bias in polarized total intensity was made using the AIPS task COMB (option POLC). We do detect significant polarized emission from near the two brightest parts of the shell like structure with peak polarized flux densities of 0.3 mJy beam-1 (Fig. 1). The percentage polarization of the northern and southern components are 0.6 percent and 0.75 percent respectively.
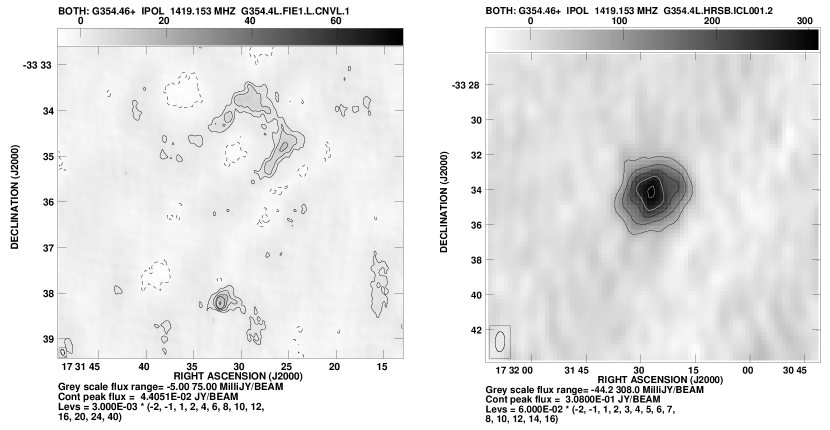
The 1.4 GHz continuum map of the shell without any short uv cut-off showed extended emission (size ). To image the shell structure at a higher resolution and to measure its flux density, we resolved out any extended structure of size using a short uv cut-off of 1000 to the data during imaging. We also avoided the frequency channels having HI absorption during imaging. The resultant image is shown in Fig. 2 (left). As can be seen from Fig. 1 and 2 (left), the morphology of the source is of shell type. To measure the size of this object, we took four cross-cuts across the shell at different orientations passing through the center of the shell like structure at 330 MHz. From the angular separation of the two peaks in the cross-cuts, we measured the angular size of the shell. The mean angular diameter of the shell is found to be or about 1.6′. Rms error on the mean angular diameter is . To measure flux density at 330 MHz and spectral index of the shell between 330 MHz and 1.4 GHz, this object was further imaged from 330 MHz data with a short uv cut-off of 1000 (same as at 1.4 GHz). This minimizes flux density variation due to different sensitivity in imaging large scale structures at 330 MHz with respect to the 1.4 GHz map. To compare flux densities in these two frequencies, the 1.4 GHz map was convolved to the resolution of the new 330 MHz map and brought to the same pixel size and center. AIPS task BLSUM was used to measure flux densities covering the same polygon region in both the maps. Measured flux densities are 0.70.1 and 0.90.1 Jy at 1.4 GHz and 330 MHz respectively. The error quoted in the flux density is 1 and is estimated from map rms and uncertainty in absolute flux density calibration (%). The observed spectral index between 1.4 GHz and 330 MHz is 0.20.1, that is quite flat and unexpected for a shell type supernova remnant. We note that the shell show extension towards the East at 330 MHz (e.g., Fig. 1) that is not seen in the 1.4 GHz image in Fig. 2 (left). The 330 MHz flux density of the shell when this emission is included is 1.10.1 Jy.
3.2 Nature of diffuse emission around the shell
To image the diffuse emission, we made a low resolution continuum map shown in Fig. 2 (right) of the field at 1.4 GHz after subtracting the significant CLEAN components () of the map shown in Fig. 2 (left) from the uv data. An extended source of size 4′ is seen in Fig. 2 (right) coincident with the shell G354.4+0.0. This extended source has also been cataloged in the PMN survey at 4.8 GHz (Wright et al., 1996) as J17313334. We have also detected the complex at 843 MHz from the Molonglo Galactic plane survey (Green et al., 1999). The measured flux densities of the diffuse emission and the shell at various frequencies and their physical parameters are given in Table 1. Note that the flux densities of the shell and the diffuse emission at 330 MHz given in Table 1 were measured from the large scale sensitive map shown in Fig. 1.
The flux density of the diffuse emission decreases significantly at 330 MHz as compared to 1.4 GHz and this indicates self absorption. For a typical extended source in the Galaxy, self absorption at meter wavelengths is caused by bremsstrahlung process. No significant free-free absorption by the line of sight gas is likely at 330 MHz as significant optical depth of this gas is observed only at 100 MHz (Brogan et al., 2003). The free-free optical depth () is related to observing frequency () by
| (1) |
Where, is electron density, electron temperature and is the path length through the diffuse HII region.
The flux density (S) of an object is related to its brightness temperature in radio frequency ranges by
| (2) |
Where, is the solid angle and is the brightness temperature of the diffuse emission. In case of bremsstrahlung emission, the brightness temperature of the emission is related to the thermal electron temperature () by
| (3) |
We note that significant decrease of flux density of the diffuse emission at
330 MHz (Table 1) indicates significant optical depth at this frequency.
However, the measured value of for the HII region at 330 MHz
(using Table 1) is only about 500 K. As this temperature would be
comparable to the Galactic background temperature at 330 MHz, correction due to
absorption of the Galactic background radiation by the HII region needs to be
made. We measured the Galactic background temperature from Haslam et al. (1982)
408 MHz single dish map convolved to the primary beam of the GMRT at 330 MHz
and scaled to the same frequency assuming a spectral index of 2.7 for the
sky brightness temperature. The measured temperature is 700 K towards the
HII region. One sigma error on this measurement is less than 70 K.
Following the discussion in Nord et al. (2006), we can write
,
where and are the brightness temperature of the non-thermal
emission behind and in front of the diffuse HII region respectively.
For a direction slightly away from the HII region, the Galactic plane
temperature () is
.
An Interferometer is insensitive to the total large scale temperature (or flux
density) and measures the difference between the above two, giving an observed
brightness temperature of the HII region of
| (4) |
Therefore, in Eq. 2 needs to be replaced by (Eq. 4), where is given by Eq. 1. One finally gets,
| (5) |
where, electron temperature in 104 K, Galactic plane temperature at 1 GHz in 104 K, EM emission measure in the unit of cm-6 pc and is in GHz. Eq. 5 is fitted to the observed flux densities of the diffuse HII region to measure its physical properties (, ).
At 843 MHz and 4.8 GHz, the contribution of the shell could not be separated from the diffuse emission. Therefore, estimation of flux densities of the diffuse emission at these two frequencies depend on the actual flux density of the shell emission that in turn depends on its location with respect to the diffuse HII region. Therefore, we consider below three possible configuration of the shell with respect to the HII region, thereby allowing us to constrain the spectral index of the shell.
3.2.1 G354.4+0.0 shell at the center of the diffuse HII region
From the plot of the flux densities of the shell and the diffuse emission (Fig. 3), we note the slopes of their flux densities between 1.4 GHz and 330 MHz are very different, indicating the shell type object and the diffuse emitting region are two different objects. When the shell is at the center of the HII region, its emission undergoes absorption by the diffuse HII region at 330 MHz and the intrinsic spectrum of the shell is steeper than the observed one as given in Table 1. By assuming the diffuse emission to be optically thin () at 843 MHz and above, and an intrinsic spectral index of 0.5 for the shell (typical for a shell type SNR (Green, 2009)), we estimate its flux densities at 843 MHz and 4.8 GHz from its measured flux density at 1.4 GHz. The estimated flux densities are then subtracted from the total measured flux densities of the complex at the above two frequencies to get the flux densities of the diffuse emission.
If we know the distance to the HII region, could be estimated from our measured temperature of 700 K towards G354.4+0.0. Here, we assume the shell structure and the diffuse HII region is located nearly at the distance of the Galactic center, but is at the near side of the GC (discussed in detail in Sect. 3.3). Due to expected high density of massive stars in the GC region, it is likely that most of the Galactic non-thermal emission is generated in the region. Therefore, we assume , and scale the value of as a function of frequency (). The flux densities of the diffuse emission as a function of frequency fitted well by Eq. 5 (see Fig. 3), with a reduced Chi-square of 0.7. From the fitted parameters, emission measure and electron temperature of the HII region are 1.7 cm-6 pc and 2300350 K respectively. Assuming the source to be spherical and located at the distance of the Galactic center (8 kpc), path length through the source () is about 9 pc. Consequently, the electron density in the diffuse emitting region is estimated to be 441 cm-3. This gas will have a of about 0.4 at 330 MHz.
Given the relative location of the shell with respect to the diffuse emission, the emission from the shell would undergo free-free absorption with being half of that of the ionized gas and percent of its emission would be absorbed at 330 MHz. Moreover, its brightness temperature and consequent flux density is underestimated in Table 1 due to high large scale diffuse Galactic background (Eq. 4). Given the angular cross-section used (4.4 square arc-min) to measure its flux density (Table 1) and of 700 K at 330 MHz, the flux density that was underestimated in Table 1 at 330 MHz is 0.28 Jy. Once this flux density is added with the observed flux density of the shell at 330 MHz, and correction is made for the fraction that was absorbed by the diffuse HII region, its estimated flux density at 330 MHz is 1.5 Jy. This shows its spectral index between 1.4 GHz and 330 MHz is about 0.5, consistent with spectral indices of typical shell type SNRs in the Galaxy (Green, 2009).
3.2.2 G354.4+0.0 shell in front of the diffuse HII region
In this case, the shell’s emission do not undergo any absorption by the HII region. Considering its measured flux densities at 1.4 GHz and 330 MHz (Table 1) and underestimation of its flux density due to large scale Galactic plane emission as discussed above, its spectral index is 0.36. By using its flux density at 1.4 GHz and the spectral index, we estimate its flux densities at 4.8 GHz and 843 MHz, which are then subtracted from the corresponding total flux densities of the complex to get the flux densities of the diffuse HII region at the two frequencies (Table 1). A fit of Eq. 5 to the new set of flux densities showed the emission measure and electron temperature to remain the same as before within the error bars.
3.2.3 G354.4+0.0 shell behind the diffuse HII region
If the SNR is located behind the HII region, the absorption of the shell emission would be more than the case when it was assumed to be at the center of the HII region. At 843 MHz and 4.8 GHz, only the total flux densities of the complex are available, and the flux densities of the diffuse HII region were computed by subtracting the flux density of the shell with an assumed spectral index of 0.5. In the present case, we assume that the properties of the diffuse HII region do not change significantly with changes in flux densities of the shell (quite small with respect to the HII region) at 843 MHz and 4.8 GHz. Optical depth towards the shell at 330 MHz is about 0.4 (Sect. 3.2.1). Based on its 1.4 GHz flux density and underestimation of its flux density at 330 MHz due to large scale Galactic plane emission as discussed earlier, its spectral index is estimated to be 0.6. By using its flux density at 1.4 GHz and the spectral index, we estimate its flux densities at 4.8 GHz and 843 MHz, which are then subtracted from the corresponding total flux densities of the complex to get the flux densities of the diffuse HII region at the two frequencies (Table 1). A fit of Eq. 5 to the set of flux densities showed the emission measure and electron temperature do remain the same as in Sect 3.2.1 within the error.
| Source | Angular | S330 | S843 | S1400 | S4800 | Te | ne | ||
| name | size | ||||||||
| (′) | (Jy) | (Jy) | (Jy) | (Jy) | (K) | (cm-3) | |||
| G354.4+0.0 | 1.6.1 | 0.90.1 | 0.9b | 0.70.1 | 0.4b | ||||
| shell | |||||||||
| Diffuse | 4 | 2.40.2 | 3.30.3 | 3.50.3 | 3.30.2 | 0.4 | 2300 | 441 | |
| HII region | 3.50.3 | 3.20.2 | 350 | ||||||
| 3.20.3 | 3.40.2 | ||||||||
| In the table, S330, S843, S1400 and S4800 denote flux densities at 330, 843, 1400 and 4800 MHz | |||||||||
| respectively. observed spectral index between 1.4 GHz and 843 MHz (HII region) or 1.4 GHz | |||||||||
| and 330 MHz (shell). optical depth at 330 MHz. | |||||||||
| a 1.10.1 Jy with emission from Eastern part of shell. | |||||||||
| b estimated assuming the shell is at the center of the diffuse HII region. | |||||||||
| c estimated assuming G354.4+0.0 shell is in front of the diffuse emission. | |||||||||
| d estimated assuming G354.4+0.0 shell is behind the diffuse emission. | |||||||||

3.3 Distance from HI absorption
To measure the distance to the shell type object G354.4+0.0, we plot in Fig. 4 the HI spectrum towards this object. Strong absorption is seen near 0 km s-1 that is believed to be caused by local gas rotating almost perpendicular to our line of sight seen near the direction of the GC. HI absorptions are also seen near 40 and 80 km s-1. The line of sight velocity of the 3 kpc arm at the longitude of this SNR is about 80 km s-1 (Cohen & Davies, 1976). Presence of absorption by this feature shows the distance of G354.4+0.0 to be at least 5 kpc from Sun. We also examined HI absorption spectrum of a few sources in the field and the spectrum of the brightest small diameter source (peak flux density 0.49 Jy beam-1) with the RA=17h31m20.7s, DEC=33∘53′25 (J2000) is shown in Fig. 5 (henceforth will be called source A). Compared to Fig. 4, it shows a much wider absorption profile between +15 to 40 km s-1, suggesting source A to be much further away than G354.4+0.0. Flux density of source A is found to go down by more than a factor of four between 1.4 GHz and 330 MHz indicating it to be a compact HII region. It is likely that the source A is located at the other side of the Galaxy. Based on the above, it is likely that G354.4+0.0 is located between 5 kpc to the Galactic center distance of 8 kpc.


4 Discussions
From the above, the morphology of the object G354.4+0.0 is found to be of a partial shell. It shows polarized emission, and after correction of sky background temperature, the spectrum of the shell is found to be steep that holds good irrespective of whether it is at the center, in front or behind the HII region. Polarized emission along with inferred steep spectrum shows synchrotron emission from the shell. Therefore, based on the shell type morphology, and synchrotron emission, the shell type source G354.4+0.0 is classified as a newly discovered SNR. It is also expected to emit in X-ray, but no counterpart is known in that band. The surface brightness of the shell at 1 GHz is about 6 W m-2 Hz-1 sr-1, that compares well with the youngest SNR G1.9+0.3 (Green & Gull, 1984). The orientation of magnetic fields in young SNRs is typically radial (Milne, 1987). Therefore, the polarization vectors representing electric field direction in Fig. 1 should be cross-radial or tangential to the shell in the absence of any Faraday rotation. We note the resolution of the NVSS (45) is not much smaller than the size of the shell. This causes smearing of any change of the polarization vectors with change in position on the shell. From Fig. 1, we note the polarization vectors in the northern part of the shell lies along the shell, while only fraction of the polarized vectors in the southern part lies along the shell. Assuming magnetic field strength in the diffuse HII region to be of typical ISM value of 10 Gauss and the SNR at the center of the HII region, given the electron density and the path length through the ionized gas, any polarized emission from the SNR would undergo Faraday rotation by 60 radian at the observing wavelength of NVSS. Faraday rotation towards the Northern part need to be ( integer) radian to explain the observation. It is possible that the Faraday rotation towards the Southern part of the shell is slightly different than the northern part of shell, and this causes a change in direction of the observed polarization vectors from the tangential direction of the shell. Future polarization observations at three or more frequencies with high angular resolution will be able to measure Faraday rotation accurately and could show whether the shell lies inside or in front of the HII region.
4.1 Evolutionary phase of the SNR and its age
If the SNR is located outside the HII region, it is then expanding in typical ISM. Given the assumed distance and the angular size of the remnant, it will be in the free expansion stage. Hence, the structure of the shock front and the corresponding shock acceleration of energetic particles would not depend significantly on the structure of the ISM in which it is expanding. Therefore, the synchrotron emission from the shell should roughly be circularly symmetric. However, the shell appears fragmented towards East, and only some parts of it are seen in Fig. 1. This is possible if the shell is no longer in the free expansion stage. Given the angular size and the distance to the SNR (8 kpc), its linear diameter is about 3.7 pc. If it is within the dense HII region, given its , the SNR has swept up about 20 of material from the surrounding ISM during its expansion. Kinetic energy of ejecta from a supernova explosion lies in the range of ergs (Woosley & Bloom, 2006). Depending on the type of explosion, the ejecta mass varies from (type Ia) (Stritzinger et al., 2006) to (core collapse) (Taddia et al., 2012). type of the progenitors and the explosion, the As the mass of the swept up material in this case is comparable to or more than the typical ejected mass from supernova explosion, there will be appreciable slowdown of its expansion. This phase of expansion is known as the adiabatic phase (Weiler & Sramek, 1988), and given the morphology discussed above, the SNR is likely expanding in a denser than ISM environment. Assuming energy conservation between the supernova ejecta and the swept up material and given the range of initial ejecta mass, the age of the SNR is estimated from numerical integration of considering its slow down due to expansion in the dense environment. The range of age possible for this remnant is found to be 100500 years. We note that the of 2300 K determined in Sect. 3.2 is low for a typical HII region, that is typically 500010000 K. However, WIM with temperatures of 3000 K has been reported (Dobler et al., 2009) and unstable WIM can reach temperatures much lower (Dong & Draine, 2011). Moreover, averaging of flux densities within the angular size of the source with likely spatial variation of electron density leads to an underestimation of source temperature (Rubin, 1969). Even if we assume is a factor of three higher (7000 K), estimated value of being mainly dependent on higher radio frequency emissions (1 GHz), it will only increase by a factor of 1.2. This does not significantly change the evolutionary phase of the SNR.
If a pulsar was created during the supernova explosion, given their typical velocity of a few hundred km s-1 (Motch et al., 2009), it would be seen within arc seconds from the center of the remnant. However, no pulsar is known within several arc-minutes of the object. This could be caused by (i) a type-Ia explosion that does not leave behind any neutron star, (ii) lack of beaming of any pulsar in the region towards us, or (iii) lack of sensitive survey with suitable dedispersion of the pulses at the right DM (the diffuse HII region itself would contribute a DM of about 400 cm-3 pc).
4.2 Surface brightness and expansion of G354.4+0.0 in the dense medium
When an SNR expand inside a dense ISM, it is expected to be brighter. For example, in M82, where emission measure of foreground gas towards the SNRs in that galaxy is about four orders of magnitude higher than the medium around G354.4+0.0 shell (McDonald et al., 2002), the typical surface brightness of SNRs of the diameter of G354.4+0.0 are a few hundred times more (Urošević et al., 2005). In our Galaxy, such a brightening has also been observed for SNRs interacting with molecular clouds (Pavlović et al., 2013). However, particle density in the diffuse HII region is much less than that of typical molecular clouds and that may explain why this SNR is not that bright. Moreover, there is more than an order of magnitude spread of surface brightness from what is predicted by relation (Pavlović et al., 2013). The surface brightness of G354.4+0.0 compares well with that of CTB 33 (G337.00.1) in our Galaxy expanding in a dense environment (Pavlović et al., 2013).
Acknowledgment
We thank the staff of the GMRT that made the observations presented in this paper possible. GMRT is run by the National Centre for Radio Astrophysics of the Tata Institute of Fundamental Research. S.R. thanks Dave Green for useful discussion. We thank the anonymous referee for help in improving the quality of the paper. We also thank Poonam Chandra and Arunima Banerjee for going through the manuscript. Work of SP is supported by a grant of MOES.
References
- Bowman et al. (2013) Bowman, J. D., Cairns, I., Kaplan, D. L., et al. 2013, PASP, 30, 31
- Brogan et al. (2003) Brogan, C. L., Nord, M., Kassim, N., Lazio, J., & Anantharamaiah, K. 2003, Astronomische Nachrichten Supplement, 324, 17
- Cohen & Davies (1976) Cohen, R. J. & Davies, R. D. 1976, MNRAS, 175, 1
- Condon et al. (1998) Condon, J. J., Cotton, W. D., Greisen, E. W., et al. 1998, AJ, 115, 1693
- Dickey et al. (1978) Dickey, J. M., Terzian, Y., & Salpeter, E. E. 1978, ApJS, 36, 77
- Dobler et al. (2009) Dobler, G., Draine, B., & Finkbeiner, D. P. 2009, ApJ, 699, 1374
- Dong & Draine (2011) Dong, R. & Draine, B. T. 2011, ApJ, 727, 35
- Green et al. (1999) Green, A. J., Cram, L. E., Large, M. I., & Ye, T. 1999, ApJS, 122, 207
- Green (1991) Green, D. A. 1991, PASP, 103, 209
- Green (2009) —. 2009, Bulletin of the Astronomical Society of India, 37, 45
- Green & Gull (1984) Green, D. A. & Gull, S. F. 1984, Nature, 312, 527
- Haslam et al. (1982) Haslam, C. G. T., Stoffel, H., Salter, C. J., & Wilson, W. E. 1982, A&AS, 47, 1+
- Kassim et al. (2005) Kassim, N. E., Lazio, T. J. W., Lane, W. M., et al. 2005, in X-Ray and Radio Connections, ed. L. O. Sjouwerman & K. K. Dyer
- Leahy et al. (2008) Leahy, D. A., Tian, W., & Wang, Q. D. 2008, AJ, 136, 1477
- Li et al. (2011) Li, W., Chornock, R., Leaman, J., et al. 2011, MNRAS, 412, 1473
- McDonald et al. (2002) McDonald, A. R., Muxlow, T. W. B., Wills, K. A., Pedlar, A., & Beswick, R. J. 2002, MNRAS, 334, 912
- Milne (1987) Milne, D. K. 1987, Australian Journal of Physics, 40, 771
- Motch et al. (2009) Motch, C., Pires, A. M., Haberl, F., Schwope, A., & Zavlin, V. E. 2009, A&A, 497, 423
- Nord et al. (2006) Nord, M. E., Henning, P. A., Rand, R. J., Lazio, T. J. W., & Kassim, N. E. 2006, AJ, 132, 242
- Pavlović et al. (2013) Pavlović, M. Z., Urošević, D., Vukotić, B., Arbutina, B., & Göker, Ü. D. 2013, ApJS, 204, 4
- Reynolds et al. (2008) Reynolds, S. P., Borkowski, K. J., Green, D. A., et al. 2008, ApJ, 680, L41
- Roy & Bhatnagar (2006) Roy, S. & Bhatnagar, S. 2006, Journal of Physics Conference Series, 54, 152
- Roy & Rao (2004) Roy, S. & Pramesh Rao, A. 2004, MNRAS, 349, L25
- Rubin (1969) Rubin, R. H. 1969, ApJ, 157, 1461
- Sarma et al. (1997) Sarma, A. P., Goss, W. M., Green, A. J., & Frail, D. A. 1997, ApJ, 483, 335
- Stritzinger et al. (2006) Stritzinger, M., Leibundgut, B., Walch, S., & Contardo, G. 2006, A&A, 450, 241
- Taddia et al. (2012) Taddia, F., Stritzinger, M. D., Sollerman, J., et al. 2012, A&A, 537, A140
- Tammann et al. (1994) Tammann, G. A., Loeffler, W., & Schroeder, A. 1994, ApJS, 92, 487
- Urošević et al. (2005) Urošević, D., Pannuti, T. G., Duric, N., & Theodorou, A. 2005, A&A, 435, 437
- Wakker & Schwarz (1988) Wakker, B. P. & Schwarz, U. J. 1988, A&A, 200, 312
- Weiler & Sramek (1988) Weiler, K. W. & Sramek, R. A. 1988, ARA&A, 26, 295
- Woosley & Bloom (2006) Woosley, S. E. & Bloom, J. S. 2006, ARA&A, 44, 507
- Wright et al. (1996) Wright, A. E., Griffith, M. R., Hunt, A. J., et al. 1996, ApJS, 103, 145