Experimental observation of a large ac-spin Hall effect
Abstract
In spinelectronics the spin degree of freedom is used to transmit and store information. Ideally this occurs without net charge currents in order to avoid energy dissipation due to Joule heating. To this end the ability to create pure spin currents i.e. without net charge transfer is essential. Spin pumping is the most popular approach to generate pure spin currents in metals Tserkovnyak et al. (2002a); Urban et al. (2001); Mizukami et al. (2001a); Mosendz et al. (2010); Azevedo et al. (2011), semiconductors Ando et al. (2011); Chen et al. (2013), graphene Tang et al. (2013), and even organic materials Ando et al. (2013). When the magnetization vector in a ferromagnet (FM) - normal metal (NM) junction is excited the spin pumping effect leads to the injection of pure spin currents in the normal metal. The polarization of this spin current is time dependent Tserkovnyak et al. (2002b) and contains a very small dc component Brataas et al. (2003). The dc-component of the injected spin current has been intensely studied in recent years and has given rise to controversial discussions concerning the magnitude the spin Hall angle which is a material dependent measure of the efficiency of spin to charge conversion Morota et al. (2011); Liu et al. (2012). However in contrast to the rather well understood dc component Mosendz et al. (2010); Azevedo et al. (2011); Saitoh et al. (2006) the two orders of magnitude larger ac component has escaped experimental detection so far Jiao and Bauer (2013). Here we show that the large ac component of the spin currents can be detected very efficiently using the inverse spin Hall effect (ISHE). The observed ac-ISHE voltages are one order of magnitude larger than the conventional dc-ISHE measured on the same device. The spectral shape, angular dependence, power scaling behavior and absolute magnitude of the signals are in line with spin pumping and ISHE effects. Our results demonstrate that FM-NM junctions are very efficient sources of pure spin currents in the GHz frequency range and we believe that our result will stimulate the emerging field of ac spintronics Kochan et al. (2011); Jiao and Bauer (2013).
pacs:
75.30. Gw, 77.55. fp, 77.55. Nv, 77.84. Bw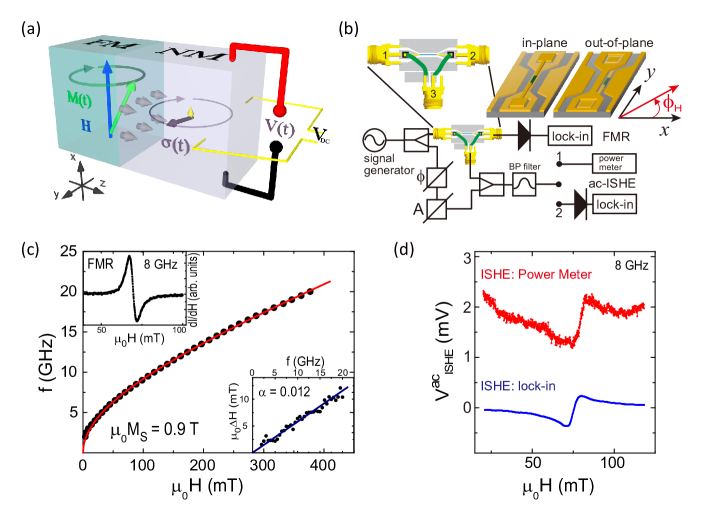
The time dependence of the polarization of a spin current injected by spin pumping is given by Tserkovnyak et al. (2002b) and is illustrated in Fig. 1(a). The absorption of a spin current in a nonmagnetic metal with a finite spin Hall effect leads to an electric field and therefore a voltage transverse to the spin current and spin polarization as expressed by the following equation:
| (1) |
where is the spin-current propagation direction, and denotes the spin polarization vector of the spin current. In this way dc and ac voltage signals may be measured as shown in Fig. 1(a). In the following we demonstrate experimentally the presence of a large ac component in the ISHE voltage signal in a FM/NM bilayer, where the ac spin current is generated by spin pumping at ferromagnetic resonance (FMR). The magnitude of the ac-ISHE signal is measured as a function of frequency, angle and power. In addition the dc and ac-ISHE signals are measured in the same device in order to compare their relative amplitudes.
A sketch of the experimental configuration is shown in Fig. 1(b), the FM/NM bilayer stripes are either integrated on top of the signal line or in the gap between the signal and ground lines of a coplanar waveguide (CPW). In these two configurations the magnetization in the FM is excited by an in-plane and out-of-plane microwave magnetic field , respectively. In all experiments the stripes are m wide, m long, and the thicknesses of the Ni80Fe20 and NM layers are 10 nm.
The difficulty to detect the ac-ISHE signal lies in the ability to measure sub-mV GHz signals and isolate them from a large background signal caused by the excitation of FMR which has the same frequency. The experimental setup for the measurement of ferromagnetic resonance (FMR) and ac-ISHE is sketched in Fig. 1(b). The microwave signal transmitted from terminal 1 to terminal 2 is used to measure FMR inductively. In order to measure ac-ISHE signals the NM/FM stripe is connected to a 50 waveguide (terminal 3). In addition the sample structure was designed as waveguide (strip line) such that the ac-ISHE voltage signal can propagate along the NM/FM stripe. Unfortunately the microwave signal suppression from terminal 1 to terminal 3 is only about 10 dB (as shown in supplementary figure S1) leading to a cross talk ac signal amplitude on terminal 3 of about 15 dBm. This signal is 2 orders of magnitude larger than the expected ac-ISHE signal. For this reason it is compensated by a reference signal using a power combiner where amplitude and phase of the reference signal can be adjusted to almost fully compensate the direct cross talk between terminals 1 and 3. The resulting signal has a magnitude of only a few mV allowing the detection of the ISHE by a power meter (detection scheme 1) or by a rectifying diode and a lock-in amplifier (detection scheme 2). For lock-in detection the static magnetic field is modulated with an amplitude of 0.2 mT. The lock-in signal is converted into the ac voltage amplitude at terminal 3 using the power to voltage conversion characteristics of the Schottky detector diode.
First the dynamic properties of the bilayer devices are studied by frequency dependent FMR measurements. For these measurements in-plane excitation is used and the magnetic field is applied along the -axis (). The results are summarized in Fig. 1(c) where a typical FMR spectrum obtained at a microwave frequency of 8 GHz is shown as the upper left inset. The FMR field and line width are extracted from the spectra as a function of frequency. The frequency dependence of can be well reproduced by a Kittel fit with effective magnetization . is strictly proportional to the microwave frequency, and the Gilbert damping constant determined from the slope of is , which is enhanced compared to for a reference Ni80Fe20 layer, due to spin pumping Tserkovnyak et al. (2002b); Mizukami et al. (2001b).
Typical signals of the ac-ISHE () measured on a Ni80Fe20/Pt stripe at 8 GHz using in-plane excitation are shown in Fig. 1(d). The top spectrum spectrum (red line) is the amplitude of the ac voltage along the Ni80Fe20/Pt stripe measured directly with a microwave power meter (detection scheme 1); as outlined in Fig. 1(b). At the resonance field, a step like feature with an amplitude of 450 V is observed. This signal is attributed to the ac-ISHE. The bottom spectrum (blue line) is the ac-ISHE signal measured by field modulation and lock-in amplification (detection scheme 2). This spectrum was converted into the voltage by numerical integration. Line shape and amplitude are in agreement with the spectrum observed by the power meter however with significantly improved signal to noise ratio.
In the following the line shape, frequency, angular and power dependence of the observed ac-ISHE signal will be examined in detail.
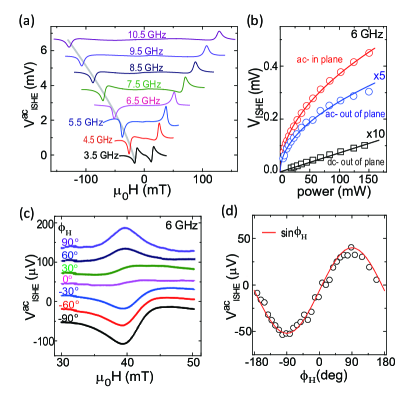
First we would like to address the shape of the ac-ISHE signals. The signals we measure are a superposition of a field independent microwave electric field (cross talk between terminals 1 and 3) and the actual ac-ISHE signal. The antisymmetric line shape observed in Fig. 1(d) is a consequence of this superposition. Since the relative phase shift between the electric cross talk and the ac-ISHE signal is frequency and sample dependent any line shape (symmetric to antisymmetric) can result. This is demonstrated by recording spectra at frequencies between 3.5 and 10.5 GHz (from bottom to top) shown in Fig. 2(a). As a function of microwave frequency the ac-ISHE signals are observed at the negative and positive resonance fields of FMR, indicated by the dashed gray line. The shapes of the resonance in can be peaks, dips, or fully anti-symmetric signals depending on the microwave frequency and device. The line shape of these spectra can be well explained by the superposition of two ac signals. A numerical simulation of the sum of and for different phase shifts between these two signals Wirthmann et al. (2010) is shown in the Supplementary figure S2.
Fig. 2(b) shows the rf-power dependence of at 6 GHz. The red dots and blue squares are for the ac- and dc-ISHE amplitudes respectively. and are measured on different devices with in- and out-of-plane excitation field, respectively. is proportional to the rf-power Azevedo et al. (2011); Costache et al. (2006), on the other hand scales with . This power dependence will be discussed below.
The angular dependence of measured at 6 GHz is shown in Fig. 2(c) and (d). For this experiment out-of-plane excitation is used and a rotatable magnetic field is applied in the plane, thus the magnetic excitation and in this way the spin pumping process do not depend on the in-plane field angle . The spectra for between 90 to -90∘ (from top to bottom) are shown in Fig. 2(c). The spectrum at ( applied along the stripe) shows a symmetric line shape, and its intensity decreases monotonically to zero when is 0∘ ( perpendicular to the stripe); for even smaller angles the signal reverses. The amplitude of as a function of is shown in Fig. 2(d) and can be well fitted to a sine function, as expected from Eq. 1. At , since the ac spin current spin direction is rotating in the plane, the ac-ISHE voltage is generated along the y direction, leading to a vanishing voltage along the direction (along the stripe).
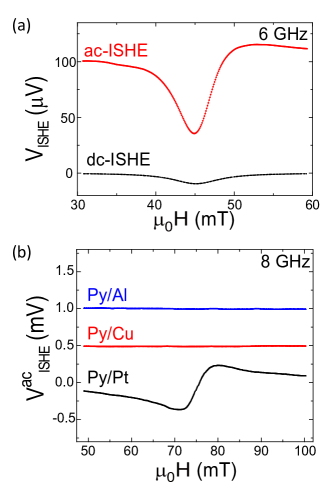
In the following we compare the amplitudes of the dc- and ac-ISHE signals measured in the same device. For the dc-ISHE measurements the voltage is measured by connecting a nanovoltmeter to terminal 3 of the sample. In Fig. 3(a), the top (red) and bottom (black) spectra are the ac- and dc-ISHE voltages measured at 6 GHz with out-of-plane excitation. One can clearly see that the ac-ISHE signal is much larger than the dc-ISHE signal. For the measurement of the ac-ISHE the applied field is oriented at of 90∘ while for the dc-ISHE is used, cf. Eq. 1 and Fig. 1(a). For the measurements in Fig. 3(a) we obtain a magnitude of and of 60 and 10 V, respectively.
Theoretically one can derive the following expressions for the peak amplitudes Obstbaum et al. (2013) (and supplementary discussion part 1):
| (2) |
| (3) |
here and are the spin Hall angle and spin diffusion length of NM, is the length of the stripe, and and are the in and out-of-plane susceptibilities at FMR. is the spin mixing conductance, is the conductivity of the bilayer and is the thicknesses of the normal metal (Pt) layer. Since the dc-ISHE scales with one expects to scale linear with the microwave power Azevedo et al. (2011); Costache et al. (2006), while for ac-ISHE a scaling behavior with is expected. This behavior is perfectly reproduced in our experiment as shown in Fig. 2(b). Furthermore, the expected ratio of the amplitudes of the ac- and dc-ISHE voltages is given by
| (4) |
This ratio can be easily calculated for parameters that apply to Fig. 3(a): GHz ( mT), using T, and mT Mosendz et al. (2010) results in . Experimentally we only observe , however one needs to consider the poor transmission of the rf-signal into the 50 terminal. In the case of out-of-plane excitation the bilayer stripe in the gap of the CPW can be considered as a waveguide with a characteristic impedance of 250 . The resistance mismatch between this waveguide and the 50 terminal leads to a transmission of only 33% of the signal as can be calculated from the voltage standing wave ratio . This implies that the is in fact 3 time larger on the sample. Even in this case the observed is still half of expected. Considering the poor microwave properties of the bonding wires that are used to connect the magnetic bilayer (ac signal source) and terminal 3 and the Ohmic losses in the bilayer stripe, a loss of 1/2 of the signal at 6 GHz is reasonable. This means that also the absolute amplitude we observe is roughly in agreement with theory Jiao and Bauer (2013). Using published values for the spin Hall angle Liu et al. (2011a) and nm Liu et al. (2011a, b), the ISHE voltages at resonance (6 GHz) can be calculated as mV and V, respectively.
A similar analysis can be performed with the signal amplitudes shown in Fig. 2(a). E.g. for FMR at 10 GHz one obtains the following parameters: (due to the in-plane excitation has to be used instead of ) and mT. From this and Eq. Experimental observation of a large ac-spin Hall effect an amplitude of 3.1 mV is expected. Again the waveguide properties of the Ni80Fe20/Pt stack on the gold waveguide need to be considered. As discussed in the supplementary discussion part 2, this configuration is equivalent to a microstrip waveguide with a characteristic impedance . One expects a transmission of only 18% into using the voltage standing wave ratio (supplementary discussion part 2). Again due to ohmic losses in the bilayer and poor microwave transmission of the bonding wires one finds approximately 1/2 of the expected amplitude (0.6 mV), see Fig. 2(a).
Additional parasitic signals may in principle be generated by the anisotropic magneto-resistance (AMR) in the Ni80Fe20 layer and also contribute to ac- and/or dc- voltages along the Ni80Fe20/Pt stripe. Via the non-linear rectification effect, a combination of the inductively coupled rf current in the stripe and a time dependent modulation of the resistance due to the AMR effect, an ac-voltage with twice the frequency and a dc-voltage may also be generated by mixing. In dc-ISHE experiments it is difficult to distinguish the ISHE-signal from the AMR voltage Bai et al. (2013); Obstbaum et al. (2013). In contrast to this for the ac-ISHE measurements, AMR signals can only occur at and are easily suppressed using band pass filter (cf. Fig. 1(b)). In our experiments we find no evidence of an AMR contribution to the signal, even when the band pass filter is omitted.
In order to further confirm that the observed signal is indeed a consequence of the inverse spin Hall effect in Pt, we compare samples with different capping layer materials. Devices with the following layer stacks were prepared: Ni80Fe20/Pt, Ni80Fe20/Al, and Ni80Fe20/Cu. The corresponding measurements performed at 8 GHz are shown in Fig. 3(b). For Al and Cu, it is well accepted that the spin Hall effect is very small due to the weak spin-orbit interaction Valenzuela and Tinkham (2006); Niimi et al. (2011). For otherwise identical experimental conditions the spectra are shown in Fig. 3(b). Only for the Ni80Fe20/Pt device the voltage signals are observed at the ferromagnetic resonance field. This material dependence and the fact that the angular dependence, line shape, and magnitude are in line with the theory of the ac-ISHE indicate that our signals are indeed a consequence of the spin currents generated by spin pumping and detected by the inverse spin Hall effect.
In summary, we present the first experimental demonstration of the ac-ISHE due to spin pumping at FMR. We demonstrate signals with amplitudes of up to a few mV. The direct comparison of the ac- and dc- ISHE voltage on the same device for out-of-plane excitation shows that is approximately 6 times larger than despite the fact that our experiment can only detect 20% of ac-ISHE signal. The large ac-ISHE voltages indicate the presence of large rf spin currents in agreement with the theory of spin pumping. Such spin currents and their detection via ISHE may be very useful for the development of ac spintronic devices.
I Methods
The bilayer stripes are prepared by optical lithography, magnetron sputter deposition, and lift-off techniques on semi-insulating GaAs substrates. Subsequently the CPW and the electrical contacts are fabricated by optical lithography using gold metallization. A thick alumina layer (80 nm ) deposited by atomic layer deposition is used to insulate the Ni80Fe20/Pt stripe and its contact electrodes from the CPW. The typical resistance of the Ni80Fe20/Pt stripes is around 1400 . All measurements are performed at room temperature with a nominally constant input microwave power of 320 mW (25 dBm).
The authors would like to acknowledge financial support from the German research foundation (DFG) through programs SFB 689 and SPP 1538 and from the European Research Council (ERC) through starting grant ECOMAGICS. D.W. would like to acknowledge a stipend from the Alexander von Humboldt foundation (AvH).
References
- Tserkovnyak et al. (2002a) Y. Tserkovnyak, A. Brataas, and G. E. Bauer, Physical Review Letters 88, 117601 (2002a).
- Urban et al. (2001) R. Urban, G. Woltersdorf, and B. Heinrich, Physical Review Letters 87, 217204 (2001).
- Mizukami et al. (2001a) S. Mizukami, Y. Ando, and T. Miyazaki, Japanese Journal of Applied Physics 40, 580 (2001a).
- Mosendz et al. (2010) O. Mosendz, J. Pearson, F. Fradin, G. Bauer, S. Bader, and A. Hoffmann, Physical Review Letters 104, 046601 (2010).
- Azevedo et al. (2011) A. Azevedo, L. Vilela-Leao, R. Rodríguez-Suárez, A. L. Santos, and S. Rezende, Physical Review B 83, 144402 (2011).
- Ando et al. (2011) K. Ando, S. Takahashi, J. Ieda, H. Kurebayashi, T. Trypiniotis, C. H. W. Barnes, S. Maekawa, and E. Saitoh, Nature Materials 10, 655 (2011).
- Chen et al. (2013) L. Chen, F. Matsukura, and H. Ohno, Nature Communications 4 (2013).
- Tang et al. (2013) Z. Tang, E. Shikoh, H. Ago, K. Kawahara, Y. Ando, T. Shinjo, and M. Shiraishi, Physical Review B 87, 140401 (2013).
- Ando et al. (2013) K. Ando, S. Watanabe, S. Mooser, E. Saitoh, and H. Sirringhaus, Nature Materials 12, 622 (2013).
- Tserkovnyak et al. (2002b) Y. Tserkovnyak, A. Brataas, and G. E. Bauer, Physical Review Letters 88, 117601 (2002b).
- Brataas et al. (2003) A. Brataas, G. Zaránd, Y. Tserkovnyak, and G. E. Bauer, Physical Review Letters 91, 166601 (2003).
- Morota et al. (2011) M. Morota, Y. Niimi, K. Ohnishi, D. H. Wei, T. Tanaka, H. Kontani, T. Kimura, and Y. Otani, Physical Review B 83, 174405 (2011).
- Liu et al. (2012) L. Liu, C.-F. Pai, Y. Li, H. Tseng, D. Ralph, and R. Buhrman, Science 336, 555 (2012).
- Saitoh et al. (2006) E. Saitoh, M. Ueda, H. Miyajima, and G. Tatara, Applied Physics Letters 88, 182509 (2006).
- Jiao and Bauer (2013) H. Jiao and G. E. Bauer, Physical Review Letters 110, 217602 (2013).
- Kochan et al. (2011) D. Kochan, M. Gmitra, and J. Fabian, Physical Review Letters 107, 176604 (2011).
- Mizukami et al. (2001b) S. Mizukami, Y. Ando, and T. Miyazaki, Journal of Magnetism and Magnetic Materials 226, 1640 (2001b).
- Wirthmann et al. (2010) A. Wirthmann, X. Fan, Y. Gui, K. Martens, G. Williams, J. Dietrich, G. Bridges, and C.-M. Hu, Physical Review Letters 105, 017202 (2010).
- Costache et al. (2006) M. Costache, M. Sladkov, S. Watts, C. Van der Wal, and B. Van Wees, Physical Review Letters 97, 216603 (2006).
- Obstbaum et al. (2013) M. Obstbaum, M. Hartinger, T. Meier, F. Swientek, C. Back, and G. Woltersdorf, arXiv preprint arXiv:1307.2947 (2013).
- Liu et al. (2011a) L. Liu, T. Moriyama, D. Ralph, and R. Buhrman, Physical Review Letters 106, 036601 (2011a).
- Liu et al. (2011b) L. Liu, R. Buhrman, and D. Ralph, arXiv preprint arXiv:1111.3702 (2011b).
- Bai et al. (2013) L. Bai, Z. Feng, P. Hyde, H. Ding, and C.-M. Hu, Applied Physics Letters 102, 242402 (2013).
- Valenzuela and Tinkham (2006) S. O. Valenzuela and M. Tinkham, Nature 442, 176 (2006).
- Niimi et al. (2011) Y. Niimi, M. Morota, D. Wei, C. Deranlot, M. Basletic, A. Hamzic, A. Fert, and Y. Otani, Physical Review Letters 106, 126601 (2011).