LHCP 2013
Searches for New Physics in Multijet Final States
Abstract
A variety of new physics models predict heavy resonances that decay to multiple hadronic jets. These models include axigluons, colorons, diquarks, excited quarks, Randall-Sundrum gravitons, string resonances, and Z’ models, among others. Other models make the prediction that high- jets will be suppressed, resulting in jet extinction. Using the data collected in 2012 at a center-of-mass energy of 8 TeV, the CMS Collaboration has made a baseline inclusive jet cross section measurement for comparison with new-physics searches, and then performed searches for jet extinction and resonances that decay to two hadronic jets. The results of these searches will be presented. No evidence of new physics has been observed, and these results set new limits on the parameters of these models.
1 Introduction
A major goal of the Compact Muon Solenoid (CMS) experiment cmsdet at the Large Hadron Collider (LHC) is the discovery of new physics (NP) beyond the standard model (SM). Many NP theoretical models predict jet extinction or production of resonances that decay to paired jets. During 2012, the CMS detector recorded 19.6 of pp data at a center-of-mass energy of 8 TeV. Several CMS analyses have exploited this rich data set to make a measurement of the inclusive jet cross section and to search for these NP signals.
2 Measurement of Differential Inclusive Jet Cross Sections
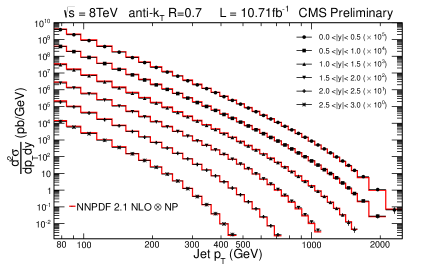
The inclusive jet cross section provides an important baseline for comparison with new-physics models. Additionally, the measurement provides a method of assessment of Quantum Chromodynamic (QCD) calculation frameworks and parton distribution functions (PDFs) used with those frameworks. CMS has performed the measurement of the double-differential inclusive jet cross section in terms of and rapidity by using 10.7 of the 2012 8 TeV pp dataset smp1212 . The measurement uses six, staggered triggers to cover a range from 74–2500 GeV and a range of parton momentum fraction from 0.019–0.625. The data are corrected for detector smearing effects and jet energy resolution. The dominant systematic uncertainty for data comes from the jet energy scale and ranges from 15–40%.
The theory prediction is calculated at next-to-leading-order (NLO) by NLOJet++ Nagy:2001fj ; Nagy:2003tz in the fastNLO framework Britzger:2012bs . Its dominant systematic uncertainty comes from PDF variation and ranges from 10–50%. The measured cross section matches the theory calculation with the NNPDF2.1 PDF set NNPDF , as shown in Fig. 1.
3 Search for Jet Extinction in the Inclusive Jet Spectrum
Terascale gravity theories predict that the Planck scale would occur at the TeV scale 1999Banks . In this case, collisions at the LHC could produce microscopic black holes. Many such theories predict that these black holes would decay spectacularly in a spray of high- jets and particles ref:Giddings_and_Thomas ; ref:Landsberg_Dimopoulos , but LHC searches so far have found no evidence for such black hole decay StrongGravity_ATLAS2012 ; Diphoton_ATLAS2012 ; ZZ_ATLAS2012 ; Black_Holes_CMS2012 ; Diphotons_CMS2012 ; Dijet_CMS2011 ; Dilepton_CMS2011 ; CMS_monophotons ; CMS_monojets . However, non-perturbative processes could produce black holes that decay to a high multiplicity of low-energy jets Kilic:2012wp . Such black hole decays might be difficult to distinguish from the low-energy SM background, but their effect on the jet- spectrum would be dramatic. At a certain energy scale, black holes would dominate and thereby suppress the production of high- jets, causing jet extinction at the high end of the jet- spectrum.
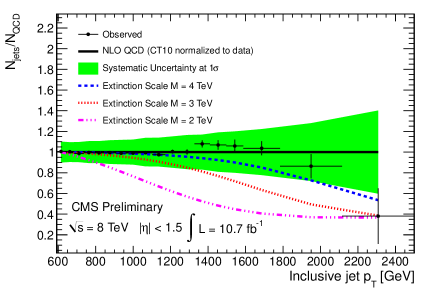
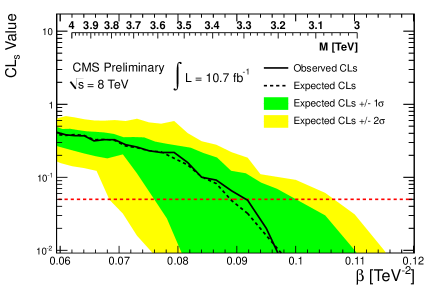
CMS has performed a search for such jet extinction with 10.7 of the 2012 8 TeV pp dataset exo1251 . The SM prediction was made at NLO with NLOJet++ in the fastNLO framework and the CT10 PDF set and was scaled to data. The leading-order extinction spectrum was generated with PYTHIA ref:Pythia and assumed the strong-coupling limit of the string model, so jet extinction would occur beyond a scale . The largest systematic uncertainty comes from the jet energy scale and is about 10%. The data was found to match the SM prediction within the uncertainties, as seen in Figs. 2 and 3. A 95% confidence level (CL) limit at 3.3 TeV on scale was set with the calculator, as shown in Fig. 4.

For the NLOJet++ calculator, there are a number of PDF sets that can be employed, in addition to the CT10 PDF used for the SM estimate. The variation between PDF sets is bracketed by the CT10 and MSWT2008 sets. Thus, as a cross check, the MSWT2008 set was tried for the SM estimate, and it increased the observed limit by only 10%, thereby confirming the CT10 limit of 3.3 TeV as a conservative value.
4 Search for Narrow Resonances using the Dijet Mass Spectrum
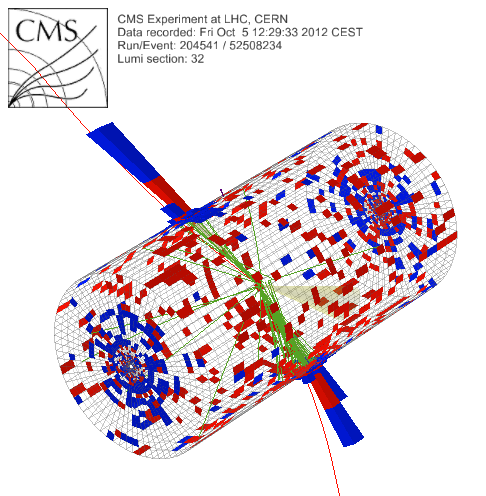
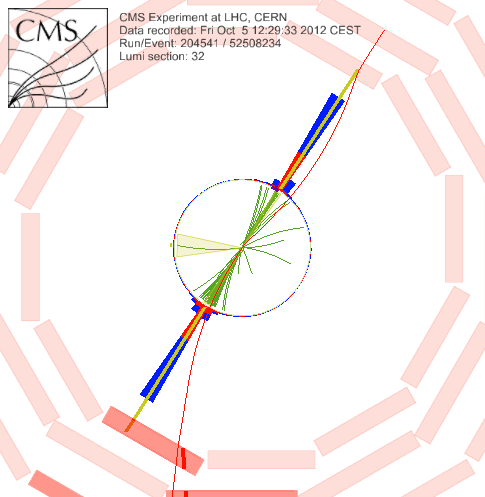
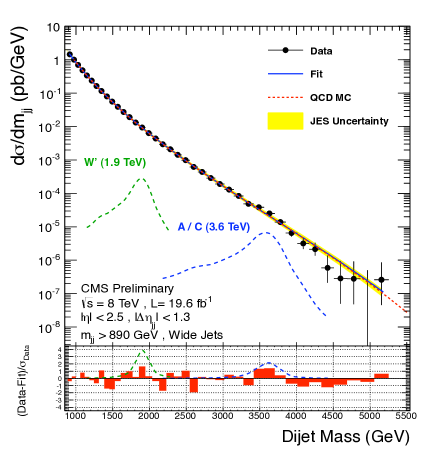
Many new physics models predict heavy resonances that couple to quarks and gluons and decay to dijets. Some of these models include axigluons (A) ref_axi ; Chivukula:2011ng , color-octet colorons (C) ref_coloron , excited quarks ref_qstar ; Baur:1989kv , Randall-Sundrum gravitons ref_rsg , scalar diquarks ref_diquark , string resonances Anchordoqui:2008di ; Cullen:2000ef , technicolor s8 resonances Han:2010rf , and new gauge bosons (W’ and Z’) ref_gauge . CMS has performed searches for such resonances, first with 4.0 exo1216 , and then with the full 19.6 2012 8 TeV pp dataset exo1259 . This search employs the wide-jet technique Cacciari:2008gd ; Krohn:2009th ; Abdesselam:2010pt , which adds close sub-leading jets to the two leading jets in each selected event. Figure 5 shows a CMS event display of the dijet event with the highest invariant mass in this dijet search.
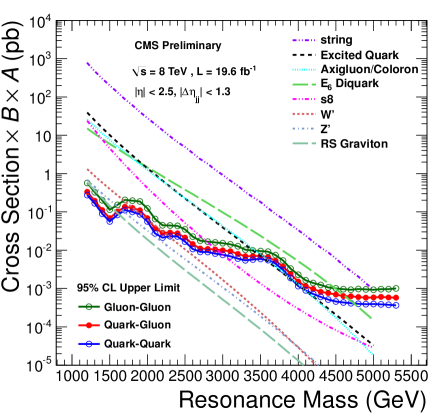
The background prediction comes from a four-parameter fit to the data. The largest systematic uncertainty is the jet energy resolution uncertainty, which is 10%. The data matches the background estimate with no excess or bumps observed on the smooth background, as shown in Fig. 6. Mass limits are set on the eight signal models, as shown in Fig. 7, with the strongest limit being 5.1 TeV on the string resonance mass.
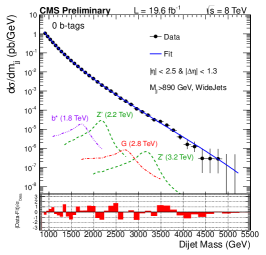
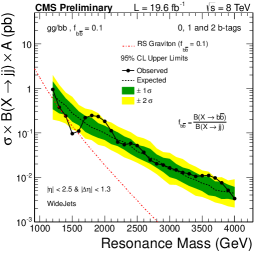
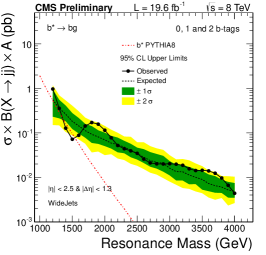
5 Search for Heavy Resonances Decaying into b and bg Final States
As a variation on the dijet search in Sec. 4, a b-jet tagging requirement can be placed on the jets in order to reduce SM backgrounds and to make the search sensitive to models that specifically produce b jets: excited b quarks ref_qstar ; Baur:1989kv , RS gravitons ref_rsg , and a sequential SM Z’ ref_gauge . CMS has performed such a search with the full 19.6 2012 8 TeV pp dataset exo1223 . Like the previous analysis, this one uses the wide-jet technique and a background estimate from a four-parameter fit to the data.
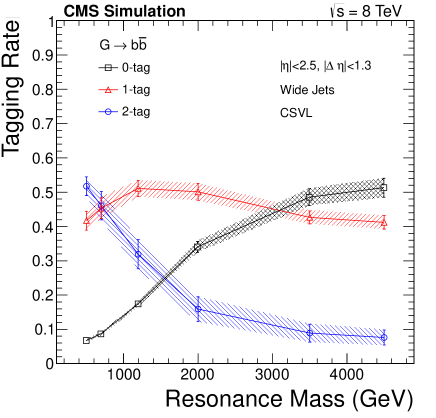
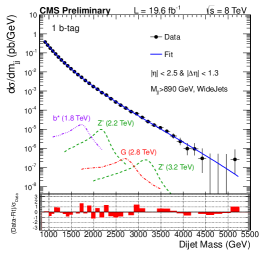
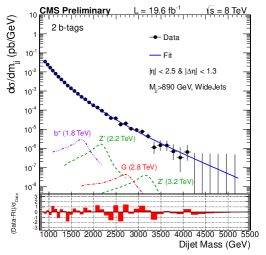
Because the b-tagging rate drops significantly for high-mass signal resonances, as shown in Fig. 8, the analysis is performed in three channels: 0 b tags, 1 b tag, and 2 b tags.
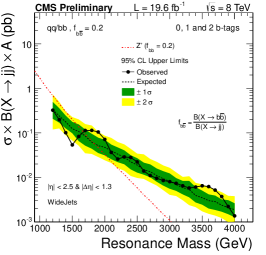
The largest systematic uncertainty comes from the jet energy resolution and is about 10%. The background estimates compared to the data are shown in Fig. 9. The data match the background estimates within the uncertainties, and no excess is observed. The best mass limits to date are set on the three signal models, as shown in Fig. 10, with the strongest limit being 1.7 TeV on the Z’ mass.
6 Conclusion
The CMS Collaboration has measured the inclusive jet cross section and performed several searches for new physics using jets with the 2012 8 TeV pp collision dataset. The jet cross section measurement has confirmed the NLOJet++ calculations and PDF sets. In the searches, no significant deviations from the SM were observed. New limits have been set on many models, most being the best to date on these models. These limits range up to 3.3 TeV on the jet extinction scale, up to 5.1 TeV on dijet string resonances, and up to 1.7 TeV on a Z’. CMS is continuing its searches for new physics, and more results will be coming out soon.
References
- (1) S. Chatrchyan et al. (CMS), JINST 3, S08004 (2008)
- (2) S. Chatrchyan et al. (CMS), CMS Physics Analysis Summary CMS-PAS-SMP-12-012 (2013)
- (3) Z. Nagy, Phys. Rev. Lett. 88, 122003 (2002), hep-ph/0110315
- (4) Z. Nagy, Phys. Rev. D 68, 094002 (2003), hep-ph/0307268
- (5) D. Britzger, K. Rabbertz, F. Stober, M. Wobisch, p. 217 (2012), arXiv:1208.3641
- (6) R.D. Ball et al., Nucl. Phys. B 838, 136 (2010)
- (7) S. Alekhin, J. Blümlein, S. Moch, Phys. Rev. D 86, 054009 (2012), arXiv:1202.2281
- (8) H.L. Lai et al., Phys. Rev. D 82, 074024 (2010)
- (9) H1 and ZEUS Collaborations, JHEP 01, 109 (2010)
- (10) A.D. Martin et al., Eur. Phys. J. C 63, 189 (2009)
- (11) T. Banks, W. Fischler (1999), hep-th/9906038
- (12) S.B. Giddings, S.D. Thomas, Phys. Rev. D 65, 056010 (2002)
- (13) G. Landsberg, S. Dimopoulos, Phys. Rev. Lett. 87, 161602 (2001)
- (14) G. Aad et al. (ATLAS), Phys. Lett. B 709, 322 (2012)
- (15) G. Aad et al. (ATLAS), Phys. Lett. B 710, 538 (2012)
- (16) G. Aad et al. (ATLAS), Phys. Lett. B 712, 331 (2012)
- (17) S. Chatrchyan et al. (CMS), JHEP 04, 061 (2012)
- (18) S. Chatrchyan et al. (CMS), Phys. Rev. Lett. 108, 111801 (2012)
- (19) S. Chatrchyan et al. (CMS), Phys. Lett. B 704, 123 (2011)
- (20) S. Chatrchyan et al. (CMS), JHEP 05, 093 (2011)
- (21) S. Chatrchyan et al. (CMS), Phys. Rev. Lett. 108, 261803 (2012)
- (22) S. Chatrchyan et al. (CMS), JHEP 1209, 094 (2012), arXiv:1206.5663
- (23) C. Kilic, A. Lath, K. Rose, S. Thomas (2012), submitted to PRD, arXiv:1207.3525
- (24) S. Chatrchyan et al. (CMS), CMS Physics Analysis Summary CMS-PAS-EXO-12-051 (2013)
- (25) T. Sjöstrand, S. Mrenna, P.Z. Skands, JHEP 05, 026 (2006)
- (26) P.H. Frampton, S.L. Glashow, Phys.Lett. B190, 157 (1987)
- (27) R.S. Chivukula, A. Farzinnia, E.H. Simmons, R. Foadi, Phys.Rev. D85, 054005 (2012), arXiv:1111.7261
- (28) E.H. Simmons, Phys.Rev. D55, 1678 (1997), hep-ph/9608269
- (29) U. Baur, I. Hinchliffe, D. Zeppenfeld, Int. J. Mod. Phys. A 2, 1285 (1987)
- (30) U. Baur, M. Spira, P.M. Zerwas, Phys. Rev. D 42, 815 (1990)
- (31) L. Randall, R. Sundrum, Phys. Rev. Lett. 83, 4690 (1999), hep-th/9906064
- (32) J.L. Hewett, T.G. Rizzo, Phys.Rept. 183, 193 (1989)
- (33) L.A. Anchordoqui, H. Goldberg, D. Lust, S. Nawata, S. Stieberger et al., Phys.Rev.Lett. 101, 241803 (2008), arXiv:0808.0497
- (34) S. Cullen, M. Perelstein, M.E. Peskin, Phys.Rev. D62, 055012 (2000), hep-ph/0001166
- (35) T. Han, I. Lewis, Z. Liu, JHEP 1012, 085 (2010), arXiv:1010.4309
- (36) E. Eichten, I. Hinchliffe, K.D. Lane, C. Quigg, Rev. Mod. Phys. 56, 579 (1984)
- (37) S. Chatrchyan et al. (CMS), CMS Physics Analysis Summary CMS-PAS-EXO-12-016 (2012)
- (38) S. Chatrchyan et al. (CMS), CMS Physics Analysis Summary CMS-PAS-EXO-12-059 (2013)
- (39) M. Cacciari, J. Rojo, G.P. Salam, G. Soyez, JHEP 0812, 032 (2008), arXiv:0810.1304
- (40) D. Krohn, J. Thaler, L.T. Wang, JHEP 02, 084 (2010)
- (41) A. Abdesselam et al., Eur. Phys. J. C 71, 1661 (2011)
- (42) S. Chatrchyan et al. (CMS), CMS Physics Analysis Summary CMS-PAS-EXO-12-023 (2013)