Temperature-dependent phonon shifts in monolayer MoS2
Abstract
We present a combined experimental and computational study of two-dimensional molybdenum disulfide (MoS2) and the effect of temperature on the frequency shifts of the Raman-active E2g and A1g modes in the monolayer. While both peaks show an expected red-shift with increasing temperature, the frequency shift is larger for the A1g more than for the E2g mode. This is in contrast to previously reported bulk behavior, in which the E2g mode shows a larger frequency shift with temperature. The temperature dependence of these phonon shifts is attributed to the anharmonic contributions to the ionic interaction potential in the two-dimensional system.
I Introduction
Molybdenum disulfide (MoS2) is transition-metal dichalcogenide consisting of covalently bound S-Mo-S layers held together by the weak van der Waals interaction and is of great research interest due to its potential uses in electronic and optical devices. MoS2 shows a number of interesting features when confined to a single monolayer - most notably an indirect-to-direct electronic band gap transitionMak et al. (2010); Kuc et al. (2011); Ellis et al. (2011) - accompanied by an enormous increase in the photoluminiscence quantum yieldSplendiani et al. (2010). The room-temperature moblility of MoS2 is comparable to that of graphene nanoribbons, and has been predicted to be as high as 400 cm2V-1s1 when optical phonon scattering and intra/intervalley deformation potential couplings are includedKaasbjerg et al. (2012).
The vibrational properties of bulk, few layer and monolayer MoS2 have been studied both experimentallyChakraborty et al. (2012); Livneh and Sterer (2010); Rice et al. (2013); Kioseoglou et al. (2012); Lee, C. and Yan, H. and Brus L.E. and Heinz, T.F. and Hone, J. and Ryu, S. (2010); Bertrand (1991) and theoreticallyMolina-Sanchez and Wirtz (2011); Ataca et al. (2011); Li (2012). One of the most pronounced effects of confining the system to a strictly 2-dimensional geometry as in the monolayer is the redshift of the Raman-active mode and blueshift of the Raman-active phonon mode with decreasing number of layersAtaca et al. (2011). The unexpected blueshift of the peak was shown to be due to dielectric screening of the long-range Coulomb interactionMolina-Sanchez and Wirtz (2011), while the redshift of the mode is in line with the classical picture of a harmonic potential. Work involving the effect of strain shows that the in-plane mode is sensitive to strain, while the out-of-plane mode shows a weak strain dependenceRice et al. (2013). These two Raman-active mode also show distinct doping dependence; with the mode decreasing in frequency with increased electron concentration and the mode showing an overall weak dependence on electron concentrationChakraborty et al. (2012). This difference is attributed to the stronger coupling to electrons of the mode compared to the mode.
While the temperature dependence of the Raman active peaks has been investigated for the bulk crystalLivneh and Sterer (2010), the temperature effect on the monolayer has not been studied. In the bulk crystal, both the and peaks shift toward lower frequencies with increasing temperature, and the temperature coefficient of the mode is larger in magnitude than that of the mode. Here we show using Raman spectroscopy along with finite-temperature molecular dynamics simulations that for the monolayer, both peaks show a redshift with increasing temperature but the magnitude of the frequency shift is larger for the mode than for the mode. To our knowledge, this is the first time that finite-temperature molecular dynamics has been used to study the phonon spectrum of a quantum-confined two-dimensional system.
II Methods
II.1 Theory
Our molecular dynamics simulations were performed with the CPMD codecpm using HGH gradient-corrected pseudopotentialsGoedecker et al. (1996) and a plane wave cutoff energy of 80 Rydberg. Our supercell contained 48 atoms and k-point sampling was restricted to the -point of the Brillouin Zone. We have included 14 Å of vacuum separating periodic images of the monolayer. The geometry was relaxed until the forces on the atoms were less than eV/ Å, and we have found the average Mo-S bond length to be 2.41 Å, which is within 0.05 Å of the optimized structures found in previous workMolina-Sanchez and Wirtz (2011); Ataca et al. (2011). In order to investigate the effect of temperature on the phonon spectra we have performed Car-ParrinelloCar and Parrinello (1985) MD simulations for the system in the crystal phase. The system was kept close to the Born-Oppenheimer surface through repeated quenching. The simulations were allowed to evolve for 100 ps using a timestep of 4 a.u. and a fictitious electron mass of 400 a.u. The phonon spectrum was derived from the Fourier transform of the velocity auto-correlation function. The resolution in frequency space is on the order of 2 cm-1. These calculations were run on 1024 processors of the IBM BG/L supercomputer.
II.2 Experiment
Single layer MoS2 films were grown directly on 285 nm SiO2/Si substrate by chemical vapor deposition using the procedure described in detail by Najmaei et al.Najmaei et al. (2013); Zhan et al. (2012). Hydrothermally grown MoO3 nanoribbons were dispersed onto auxiliary silicon substrates and placed inside a tube furnace surrounded by the growth substrate. Sulfur powder was sublimated upstream near the opening of the furnace at an approximate temperature of 600∘C while the furnace was heated to a peak temperature of 850∘ under a constant flow of nitrogen and was held at this set point for 10 to 15 minutes and then cooled to room temperature. This resulted in incomplete growth of triangular MoS2 domains which were primarily monolayer but occasionally contained a small bilayer region in the center.
Micro-Raman and photoluminescence (PL) measurements were performed with a WITec Alpha 300RA system using the 532 nm line of a frequency-doubled Nd:YAG laser as the excitation source. The spectra were measured in the backscattering configuration using a 100x objective and either a 600 or 1800 grooves/mm grating. The spot size of the laser was 342 nm resulting in an incident laser power density 140 W/m2. This laser power was found to be sufficiently low to not to cause any shifting in the both the in-plane and out-of-plane modes of the Raman signatureNajmaei et al. (2012). Single point Raman measurements were performed on the same location in the sample over the temperature range from 30 to 175∘C using a heating stage. The location was determined via Raman mapping the selected crystal at each temperature set, after allowing at least 30 minutes for thermal stabilization of the sample and optics. In addition atomic force microscopy (AFM) was utilized to confirm the thicknesses of the CVD material.
III Results and Discussion
III.1 Experiment
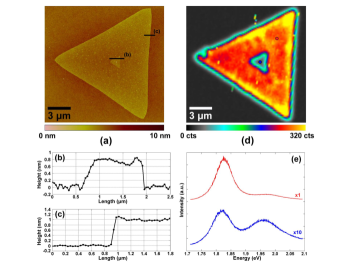
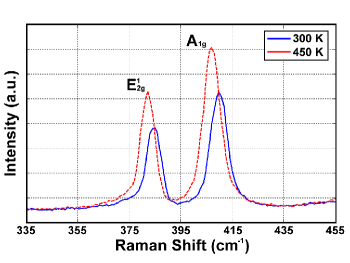
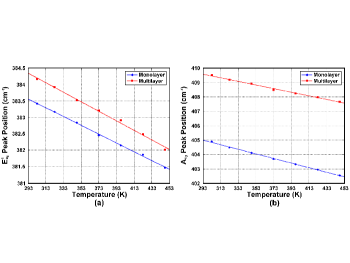
Figure 1 shows photoluminescence (PL) and AFM images of a typical monolayer crystal with a small bilayer region at its center. The AFM images indicate that the deposited MoS2 films are monolayer with a typical thickness of 0.9 nm. In addition, the enhancements of the PL signal emanating from the monolayer regions are indicative of the indirect-to-direct gap transition observed in MoS2 as the layer count is reduced from two or more layers to a single layerMak et al. (2010). Single spectra recorded at 30 and 175∘C are shown in Figure 2, and extracted values of the temperature coefficient for the E12g and A1g modes for both CVD grown monolayer and bulk (100 nm thick) exfoliated MoS2 are presented in Figure 3. An increased phonon coupling in the MoS2 is observed at elevated temperatures, as shown in the increased intensity of the peaks for both monolayer (Figure 2) and bulk (not shown).
III.2 Theory
Any temperature-dependent changes in the calculated phonon density of states is due to the anharmonic terms in the lattice potential energy. In contrast to strictly harmonic or quasi-harmonic calculations, anharmonic frequency shifts are the result of coupling between phonons having different momentum q and band index , as well as thermal expansion of the lattice. The calculated phonon density of states for molecular dynamics simulations at representative temperatures of 50 K and 300 K are shown in Figure 4.
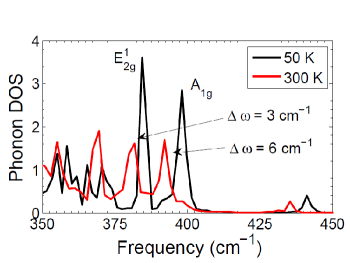
At both temperatures, the Raman-active and peaks are well-defined, although slightly redshifted in frequency relative to estimates made in the harmonic approximationMolina-Sanchez and Wirtz (2011). It is clear that as the temperature is increased by several hundred Kelvin, both peaks shift toward lower frequencies, and that the frequency shift of the peak is more pronounced than that of the peak.
This temperature dependent shift of both peaks is due to the anharmonic contributions to the interatomic potential energy, mediated by phonon-phonon interactions. Intuitively, it makes sense that the out-of-plane mode shows a stronger temperature response in the monolayer, where there are no weak interlayer interactions restricting the vibrations away from the basal plane. While thermal expansion of the crystal is technically considered an anharmonic effect, it is a distinct physical phenomenon from the anharmonic coupling between phononsCalizo et al. (2007). Because the size of the supercell is held fixed during simulations at different temperatures, we expect thermal expansion to play a minimal role since the in-plane structure does not change appreciably.
We note that the mode has a stronger coupling to electrons than the mode, which could explain the larger frequency shift of the phonons. We can compare this to the case of superconducting MgB2, in which the anharmonic renormalization is greatest for the modes that couple most strongly to electronsLazzeri et al. (2003).
| -0.013 | -0.016 | 6 cm-1 | ||
| -0.015 | -0.013 | 3 cm-1 |
IV Conclusion
In summary, we have used a combination of Raman spectroscopy and first-principles molecular dynamics simulations to study the temperature dependence of the Raman active peaks in monolayer MoS2. We have investigated the temperature dependence of the E2g and A1g peaks in the Raman spectra of monolayer MoS2 grown by CVD on Si/SiO2 substrates. Micro-Raman spectroscopy was carried out using the 532 nm laser excitation over the temperature range from 30 to 175∘C. The extracted values of the temperature coefficient of these modes are X = -0.013 cm-1/∘C and X = -0.017 cm-1/∘C for monolayer, and X = -0.015 cm-1/∘C and X = -0.013 cm-1/∘C for bulk, respectively. Simulation results agree qualitatively with experiment, predicting a larger temperature-dependent shift for the A1g than for the E1g mode.
We see that both the and peaks are redshifted with increasing temperature, and the magnitude of the temperature coefficient is larger than that of the mode. The temperature dependent shift of both peaks is attributed to anharmonic contributions in the interatomic potential energy due to phonon-phonon interactions. The larger anharmonic frequency shift of the mode is due to the stronger electron-phonon coupling relative to other Raman-active modes. Future work will look at the temperature effects of few-layer MoS2 as well as monolayers containing Mo defect sites.
References
- Mak et al. (2010) K. Mak, C. Lee, J. Hone, J. Shan, and T. Heinz, Physical Review Letters 105 (2010).
- Kuc et al. (2011) A. Kuc, N. Zibouche, and T. Heine, Physical Review B 83 (2011).
- Ellis et al. (2011) J. Ellis, M. Lucero, and G. Scuseria, Applied Physics Letters 99 (2011).
- Splendiani et al. (2010) A. Splendiani, L. Sun, Y. Zhang, T. Li, J. Kim, C. Chim, G. Galli, and F. Wang, Nano Letters 10, 1271 (2010).
- Kaasbjerg et al. (2012) K. Kaasbjerg, K. Thygesen, and K. Jacobsen, Physical Review B 85 (2012).
- Chakraborty et al. (2012) B. Chakraborty, A. Bera, D. Muthu, S. Bhowmick, U. Waghmare, and A. Sood, Physical Review B 85 (2012).
- Livneh and Sterer (2010) T. Livneh and E. Sterer, Physical Review B 81 (2010).
- Rice et al. (2013) C. Rice, R. J. Young, R. Zan, U. Bangert, D. Wolverson, T. Georgiou, R. Jalil, and K. S. Novoselov, Physical Review B 87 (2013).
- Kioseoglou et al. (2012) G. Kioseoglou, A. T. Hanbicki, M. Currie, A. L. Friedman, D. Gunlycke, and B. T. Jonker, Applied Physics Letters 101 (2012).
- Lee, C. and Yan, H. and Brus L.E. and Heinz, T.F. and Hone, J. and Ryu, S. (2010) Lee, C. and Yan, H. and Brus L.E. and Heinz, T.F. and Hone, J. and Ryu, S., ACS Nano 4, 2695 (2010).
- Bertrand (1991) P. Bertrand, Physical Review B 44, 5745 (1991).
- Molina-Sanchez and Wirtz (2011) A. Molina-Sanchez and L. Wirtz, Physical Review B 84 (2011).
- Ataca et al. (2011) C. Ataca, M. Topsakal, E. Akturk, and S. Ciraci, Journal of Physical Chemistry C 115, 16354 (2011).
- Li (2012) T. Li, Physical Review B 85 (2012).
- (15) These calculations used the code CPMD; Copyright IBM Corp 1990 -2005, MPI für Festkörperforschung Stuttgart 1997 -2001; http://www.cpmd.org.
- Goedecker et al. (1996) S. Goedecker, M. Teter, and J. Hutter, Physical Review B 54, 1703 (1996).
- Car and Parrinello (1985) R. Car and M. Parrinello, Phys. Rev. Lett. 55 (1985).
- Najmaei et al. (2013) S. Najmaei, Z. Liu, W. Zhou, X. Zou, G. Si, S. Lei, B. Yakobson, J. Idrobo, P. Ajayan, and J. Lou, arxiv (2013).
- Zhan et al. (2012) Y. Zhan, Z. Liu, S. Najmaei, P. Ajayan, and J. Lou, Small 8, 966 (2012).
- Najmaei et al. (2012) S. Najmaei, Z. Liu, P. M. Ajayan, and J. Lou, Applied Physics Letters 100 (2012).
- Calizo et al. (2007) I. Calizo, A. A. Balandin, W. Bao, F. Miao, and C. N. Lau, Nano Letters 7, 2645 (2007).
- Lazzeri et al. (2003) M. Lazzeri, M. Calandra, and F. Mauri, Physical Review B 68 (2003).