A multi-wavelength investigation of the radio-loud supernova PTF11qcj and its circumstellar environment
Abstract
We present the discovery, classification, and extensive panchromatic (from radio to X-ray) follow-up observations of PTF11qcj, a supernova discovered by the Palomar Transient Factory. Our observations with the Karl G. Jansky Very Large Array show that this event is radio-loud: PTF11qcj reached a radio peak luminosity comparable to that of the famous gamma-ray-burst-associated supernova 1998bw ( erg s-1 Hz-1). PTF11qcj is also detected in X-rays with the Chandra observatory, and in the infrared band with Spitzer. Our multi-wavelength analysis probes the supernova interaction with circumstellar material. The radio observations suggest a progenitor mass-loss rate of M⊙ yr km s-1), and a velocity of for the fastest moving ejecta (at d after explosion). However, these estimates are derived assuming the simplest model of supernova ejecta interacting with a smooth circumstellar wind, and do not account for possible inhomogeneities in the medium and asphericity of the explosion. The radio data show deviations from such a simple model, as well as a late-time re-brightening. The X-ray flux from PTF11qcj is compatible with the high-frequency extrapolation of the radio synchrotron emission (within the large uncertainties). A light echo from pre-existing dust is in agreement with our infrared data. Our pre-explosion data from the Palomar Transient Factory suggest that a precursor eruption of absolute magnitude mag may have occurred yr prior to the supernova explosion. Overall, PTF11qcj fits the expectations from the explosion of a Wolf-Rayet star. Precursor eruptions may be a feature characterizing the final pre-explosion evolution of such stars.
1 Introduction
Supernovae (SNe) of type Ib/c are believed to mark the death of massive stars that are stripped of their hydrogen (H), and possibly helium (He) envelopes before explosion (e.g., Filippenko, 1997). Since the discovery of an association between the low-luminosity, long-duration -ray burst (GRB) 980425 and SN 1998bw (Galama et al., 1998; Kulkarni et al., 1998; Pian et al., 1999), it has become evident that long duration GRBs are a rare sub-class of type Ib/c SNe (for a recent review, see Woosley & Bloom, 2006, and references therein). Their ejecta are highly energetic and collimated relativistic outflows, emitting in -rays, and likely powered by a central engine (an accreting black hole or a neutron star).
SN 1998bw showed that events with properties intermediate to “classic” high-energy, highly relativistic GRBs, and ordinary non-relativistic Ib/c SNe, do exist and could probably allow us to solve the mystery of the GRB-SN connection if more of them were to be discovered.
After GRB 980425/SN 1998bw, a few other GRBs have been reliably associated with nearby SNe (Woosley & Bloom, 2006), that are all of type Ic “broad-line” (BL), i.e. showing broad spectral features indicative of high photospheric velocities. After hundreds of Ib/c SNe have been monitored in radio in search for SN 1998bw-like events, SN 2009bb has marked the discovery of a Ic SN characterized by a relativistic (radio and X-ray emitting) ejecta, with no associated -rays (Soderberg et al., 2010).
Radio observations are a key to discover events just on the dividing line between GRBs and ordinary Ib/c SNe (Berger et al., 2003; Soderberg et al., 2006b). In fact, while the SN optical emission traces the slower explosion debris ( c), synchrotron emission from the fastest ejecta peaks in the radio band (on typical timescales of 10-30 d since explosion). Radio (and X-ray) emission, because it originates from the interaction between the high velocity SN ejecta and the low-velocity wind from the SN progenitor, can probe the density of the circumstellar medium (CSM), and constrain the wind properties of the SN progenitor. Since massive stars are speculated to undergo strong episodic mass-loss events, radio studies of type Ib/c SNe can help us understand the nature of their progenitors.
Here, we report on the discovery of a radio-loud SN, PTF11qcj, and on the results of our extensive, multi-wavelength follow-up campaign extending till 1.5 yr after optical detection. While further observations are on-going, the data gathered during the first year of our campaign allow us to set important constraints on the nature of this event. Our paper is organized as follows. In Section 2 we describe the optical discovery, spectral classification, and IR-to-X-ray follow-up observations of this event; in Section 3 we describe our multi-frequency analysis; finally, in Section 4 we present our summary.
2 Panchromatic observations
2.1 SN optical photometry
On 2011 November 01 (hereafter all times are given in UTC unless otherwise stated), we discovered PTF11qcj in an -band image from the 48-inch Samuel Oschin telescope at Palomar Observatory (P48), which is routinely used by the Palomar Transient Factory (PTF111http://ptf.caltech.edu/iptf/; Law et al., 2009; Rau et al., 2009). The SN was also detected by our autonomous discovery and classification framework called Oarical (Bloom et al., 2012). PTF11qcj is located at , (J2000), at an angular distance of from the nucleus of the galaxy SDSS222Sloan Digital Sky Survey (York et al., 2000) J131341.57+471757.2, at (Figure 1). Assuming km s-1 Mpc-1, , , this redshift correspond to a luminosity distance of Mpc. The SN was visible at a magnitude of in a previous exposure taken in -band on 2011 October 23. It was not detected in an -band image taken with the P48 on 2011 August 17.
Subsequent observations with the P48 were conducted with the Mould- and Gunn- filters (Figure 1). Photometry (Table LABEL:opt) was performed relative to the SDSS -band and -band magnitudes of stars in the field (York et al., 2000), using our custom pipeline which performs image subtraction followed by PSF photometry on stacks of PTF images extracted from the PTF Infrared Processing and Analysis Center (IPAC) archive (Maguire et al., 2012; Ofek et al., 2012; Ofek et al., 2013c). The flux residuals from individual subtracted images were binned, and then converted to magnitudes. The errors were estimated from the standard deviation of the photometric measurements in each bin (Figure 2).
Multi-color optical () optical light curves were also obtained using the Palomar 60-inch telescope (P60; Cenko et al., 2006) and the RATCAM optical imager on the robotic 2m Liverpool Telescope (LT; Steele et al., 2004) located at the Roque de Los Muchachos Observatory on La Palma. P60 and LT photometry was extracted using the same pipeline described above (Table LABEL:opt).
2.2 Spectral classification
After the discovery of PTF11qcj with P48, we triggered a spectroscopic follow-up campaign333All spectra will be made public via WISeREP (Yaron & Gal-Yam, 2012) (Figure 3). A first spectrum was taken on 2011 November 5 using OSIRIS on the Gran Telescopio Canarias444http://www.gtc.iac.es/instruments/osiris/ (GTC), with a 1″ long-slit and the R300R grism ( Å). The exposure time for this observation was s. Two other spectra were obtained on 2011 November 7 and on 2011 December 21 using ISIS on the William Herschel Telescope555http://www.ing.iac.es/Astronomy/instruments/isis/index.html (WHT), with a 1″ long-slit, the R300B grating plus Å central wavelength on the blue side; the R158R grating plus Å central wavelength on the red side. The exposure times were of 600 s and 1800 s, respectively for the two observations. On 2011 November 26 and 2011 December 31, we obtained two spectra using LRIS (Oke et al., 1995) mounted on the Keck-I 10 m telescope666http://www2.keck.hawaii.edu/inst/lris/. For both spectra we used a 1″ slit, with the 400/8500 grating plus Å central wavelength on the red side, and the 400/3400 grism on the blue side. The exposure times were 1200 s for the blue side and 720 s for the red side, on 2011 November 26; 900 s for the blue side and 840 s for the red side, on 2011 December 31. Finally, on 2012 March 20, we took a last spectrum with DEIMOS (Faber et al., 2003) mounted on the Keck-II 10m telescope, using a 0.8″ slit, and the 600ZD (600/7500) grism centered at Å . The wavelength coverage was Å , the exposure time was s, and the spectral resolution was Å.
Our first spectrum obtained on 2011 November 5 with the GTC (see Figure 3) is found to be most similar to a type Ic SN by the Superfit software (Howell et al., 2005). A comparison with template spectra shows relatively high velocities (around 22,000 km s-1 derived from the Ca II IR triplet minimum), that are driving superfit to find the BL SN 1998bw (at d post-maximum) as the best fit (Figure 3, red line). However, more normal type Ic SN spectra (e.g., SN 1994I, black line in Figure 3) could also provide an acceptable fit, provided these are artificially blue shifted by 5,000 km s-1 (dotted line in Figure 3). In fact, the absorption features profiles are more similar to SN 1994I than to SN 1998bw. Aside from nebular H emission from the host galaxy, no strong narrow lines are seen in this first spectrum.
The WHT spectrum taken two days later (Figure 4, black line) extends to bluer wavelengths. No narrow lines are seen except for common host galaxy lines (Balmer series, O[III] and O[II]), and the continuum shape is red (with a prominent decreasing trend beyond Å) as is common for SNe of type Ic. As the SN flux declines, most notably in the spectra taken on and after 2011 November 26, the SN signal is strongly mixed with underlying emission from the host galaxy.
2.3 Pre-explosion images and photometry
We searched for evidence of pre-explosion activity in the PTF images taken before the discovery date of PTF11qcj. To this end, we constructed a reference frame from 30 images taken over the period 2013 March - May 2013 ( months after the SN explosion, when PTF11qcj was no longer detected by P48). We geometrically resampled this reference image to the coordinate frame of every image of the PTF11qcj field taken before and during the SN explosion (hereafter, the “science images”). We matched the PSFs of the resampled reference image and of the science images using a non-parametric kernel (a process that usually results in the degradation of the reference image quality; e.g., Bramich, 2008), and subtracted the reference image from each science image. Note that in this process the science frames are never geometrically resampled. PSF photometry was then performed on the difference images at the position of PTF 11qcj, which was measured accurately from the difference images in which the SN is present, with the shape of the PSF measured from either the pre-subtraction science or reference images. This results in a flux and flux uncertainty computed at the position of PTF11qcj for every science image, regardless of whether the SN was present or not (see also Ofek et al., 2013c).

In Figure 5 we show the light curve data obtained for the pre-SN season of May 2009 - September 2010 (top panel), and for the post-SN season of January 2012 - January 2013 (bottom panel). In each of these Figures, the black circles show measurements made using PSF fitting at the SN position on the individual difference images; the green area shows the weighted-mean flux in time bins, and the extent of the error on the mean; finally, the blue area shows the typical range of PSF counts obtained by performing PSF photometry on other galaxies in the PTF11qcj field, having similar magnitude as the PTF11qcj host (2 mag), and at the same isophotal radius as the one at which PTF11qcj occurred in its own host. Thus, while the blue areas in these Figures track any global image subtraction problems, the green areas track departures in the mean flux from zero and allow us to asses the presence of any pre-SN activity.
As evident from Figure 5, during the pre-SN season (top panel) we find tentative evidence for periods of activities in between May 2009 and July 2009 (see also panel B in Figure 6), and between May 2010 and June 2010 (see also panel D in Figure 6). These active periods are separated by a period of non-detection, between November 2009 and May 2010 (see also panel C in Figure 6). Specifically, we note that during the active period of May 2009 - July 2009, the possible precursor from PTF11qcj is as bright as the SN was during April 2012 - May 2012 (this is also evident comparing panels B and F in Figure 6). We finally checked whether any evidence for excess flux was still present during the post-SN season (after the SN itself faded below the P48 detection limit). As evident from the bottom panel of Figure 5, at yr after explosion no excess flux is detected at the position of PTF11qcj. This further supports the evidence for precursor activity during the pre-SN season.
2.4 Radio observations
On 2011 November 15, we started a long-term monitoring campaign of PTF11qcj (along with calibrators J1327+4326 and 3C 286) with the Karl G. Jansky Very Large Array777The National Radio Astronomy Observatory is a facility of the National Science Foundation operated under cooperative agreement by Associated Universities, Inc.; https://public.nrao.edu/telescopes/vla (VLA; Perley et al., 2009) in its D, DnC, C, CnB, and A configurations, under our Target of Opportunity programs888VLA/11A-227, VLA/11B-034, VLA/11B-247, VLA/12B-195 - PI: A. Corsi. VLA data were reduced and imaged using the Common Astronomy Software Applications (CASA) package.
The light curves of PTF11qcj at frequencies of GHz, GHz, GHz, GHz, GHz, GHz are reported in Table LABEL:radioTab. The VLA measurement errors are a combination of the rms map error which measures the contribution of small unresolved fluctuations in the background emission and random map fluctuations due to receiver noise, and a basic fractional error (here estimated to be of ) which accounts for inaccuracies of the flux density calibration (see e.g., Weiler et al., 1986; Ofek et al., 2011).
We also observed the field of PTF11qcj (together with the test calibrator J1203+480) using the Combined Array for Research in Millimeter-wave Astronomy999http://www.mmarray.org/ (CARMA), at a frequency of GHz. Bad weather caused de-coherence which resulted in a limited follow-up of this source with CARMA. Nevertheless, the data collected on 2011 November 19 and 2011 November 26101010CARMA program #c0857; PI: A. Horesh both resulted in a detection of PTF11qcj (Table LABEL:radioTab).
2.5 X-ray observations
We have carried out an X-ray monitoring campaign of PTF11qcj with Chandra111111http://www.nasa.gov/mission_pages/chandra/main/index.html (Weisskopf et al., 2002) and Swift121212http://heasarc.nasa.gov/docs/swift/ (Gehrels et al., 2004). All our Swift-XRT observations yielded non detections (see Table LABEL:X), while Chandra detected PTF11qcj in three epochs131313DDT proposals #501793, #501794, #501797; PI: A. Corsi. The results of our X-ray follow-up are reported in Table LABEL:X.
We reduced Swift data adopting an on-source circular aperture of ″and assuming that 37% of the photons are within this aperture. In addition to the results obtained for single-epoch observations (see Table LABEL:X), we also provide the upper-limit obtained by co-adding all of the Swift non-detections.
For Chandra observations, we adopted a circular aperture of fixed on the optical position of PTF11qcj. The background has been estimated from nearby portions of the image. Net source counts have been derived by subtracting from the counts measured in the on-source region the number of counts measured in the background region, scaled by the ratio of the on-source to background region areas. We caution that the background estimated from nearby portions of the image does not include any diffuse or point sources associated with the host galaxy itself. In this sense, the count rates indicated in Table LABEL:X are upper-limits on the flux from PTF11qcj. Since the first epoch is brighter than the third, we can however be confident that we have seen some emission from PTF11qcj during the first epoch.
2.6 IR observations
We observed the position of PTF11qcj with Spitzer141414http://www.spitzer.caltech.edu/ (Fazio et al., 2004) on two epochs151515DDT proposal #31731; PI: A. Corsi (on 2012 March 28.747 and 2012 June 25.643; Table LABEL:spitzertab). Data were reduced using the standard Spitzer/IRAC pipeline. Subsequently, aperture photometry was performed using a radius of 4 pixels (i.e., ) for PTF11qcj, and an annulus of radii 8 to 16 pixels (i.e., to )for the sky background. Calibration and aperture corrections were as per the zero points listed in the Spitzer/IRAC handbook. However, there is clearly a host galaxy contribution at the position of PTF11qcj (see Figure 7): for this reason, we consider the flux measurement obtained with Spitzer as an upper-limit to the IR flux of PTF11qcj.
On 2012 March 28, we also observed the field of PTF11qcj in -band with the Palomar 200-inch telescope (P200). The contribution of the host galaxy is clearly evident at the position of PTF11qcj in the P200 image (Figure 1, lower-right panel). Performing aperture photometry with respect to two reference stars in the field (2MASS 13134736+4719100 and 13135239+4717152), we derive a -band photometric data point that, as for the Spitzer observations, we consider as an upper-limit to the SN flux in this band (Table LABEL:spitzertab).
3 Multi-wavelength analysis
3.1 Spectroscopic properties
As discussed in Section 2.2, our first spectrum of PTF11qcj shows relatively high velocities (around 22,000 km s-1). The spectral similarity between PTF11qcj at d after -band discovery (2011 November 5, or 55870 MJD), and the Ic-BL SN 1998bw at d after peak (Figure 3), suggests that we discovered PTF11qcj around peak time or shortly thereafter. We thus infer an explosion date of 55830 MJD MJD, assuming an explosion-to-peak timescale of d, as derived from well studied Ib/c SN samples (e.g., Figure 5 in Drout et al., 2011).
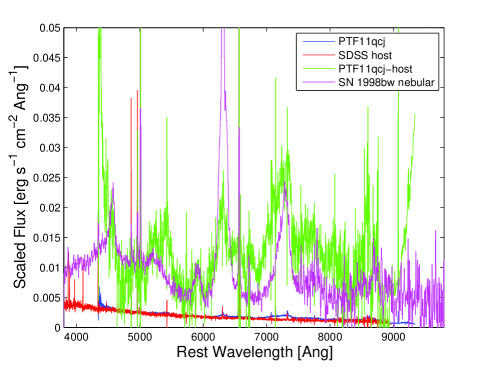
The continuum shape observed in the spectrum of PTF11qcj taken on 2011 November 26 (Figure 4, orange line), is flat or even rising toward the blue side down to Å. Indeed, this spectrum and the ones taken after 2011 November 26 show the SN signal strongly mixed with underlying emission from the host galaxy. We have attempted to subtract this contribution using a spectrum of the host galaxy obtained by the SDSS survey161616http://skyserver.sdss3.org/dr9/en/get/specById.asp?id=1642855417023326208. We scaled the host spectrum until the strong emission lines approximately matched in intensity the lines observed in our SN spectra, rebinning the spectra as needed to match the line width, and then subtracted the host spectrum (resampled onto the SN spectrum wavelength scale) from our observed spectra. These host-subtracted spectra are plotted in Figure 8.
We run the Superfit program on the host-subtracted spectra and find a reasonable match to spectra of SNe Ib/c of comparable ages. The earlier-epoch spectra seem to fit SNe of the Ic-BL class, while later-epoch ones are better matched by more normal SNe Ib/c. We stress that the host-subtraction procedure we attempted is quite rough due to the irregular nature of the host and an apparent bright star-forming knot seen in pre-explosion SDSS imaging, co-located with the SN. Still, in view of the matches found between the host-subtracted spectra and observations of other events, it is certainly reasonable to assume that PTF11qcj evolved in a similar way to other SNe Ib/c.
Finally, the late-time spectrum (2012 March 20; Figure 4, purple line) is nebular, with O I 6300 Å and Ca II emission lines. After subtracting the host contribution, this spectrum appears quite similar to late spectra of SN 1998bw, again within the large uncertainties related to host contamination (Figure 9).
In order to estimate the host-galaxy extinction toward the SN, we measured the Na D absorption doublet in our high signal-to-noise and high-resolution Keck/DEIMOS spectrum obtained on March 20, 2012. We detect weak features consistent with the Na D doublet at the host redshift, for which we measure the following equivalent width values using the IRAF/splot routine: EWÅ, and EWÅ. Since the 5890Å component is always stronger (opposite what we see), and the FWHM of the 5896Å component is almost 3 times larger than that of the 5890Å line, we assume that the 5896Å doublet component is probably contaminated by a noise fluctuation. Using the relation of Poznanski et al. (2012) (see their Figure 7) we estimate an extinction of EB-V=0.03 (A mag) using the 5890Å component. We thus apply this small correction, together with the correction for Galactic extinction, to our photometry plotted in Figure 2.
3.2 Pre-SN activity: a precursor from PTF11qcj progenitor?
In recent years pre-SN eruptions have been detected from type IIn SNe (e.g., Mauerhan et al., 2013; Prieto et al., 2013; Ofek et al., 2013c) and type Ibn SNe (e.g., Nakano et al., 2006; Pastorello et al., 2007; Foley et al., 2007). The total ejected mass in these outbursts is estimated to be a fraction of a solar mass (e.g., Immler et al., 2008; Ofek et al., 2013b, c). However, pre-SN eruptions were never detected before from other types of SNe.
Our pre-explosion images of PTF11qcj show tentative evidence for the existence of pre-explosion activity, particularly in terms of a precursor event reaching mag during May-July 2009, yrs before the SN discovery. Marginal evidence for further pre-SN activity ( mag) is found during May-June 2010, yrs before discovery.
At the distance of PTF11qcj ( Mpc), correcting for local (see Section 3.1) and Galactic ( mag; Schlafly & Finkbeiner, 2011) extinction at the SN position, mag ( mag) corresponds to mag ( mag). For comparison, the precursor observed 2 yr before explosion of the prototype Ibn SN 2006jc reached mag (Pastorello et al., 2007). Based on our pre-SN images, we can exclude a precursor as bright as the one observed for SN 2006jc during the epochs covered by our observations (see Figure 5).
3.3 SN optical light curve analysis
As discussed in Section 3.1, we likely discovered PTF11qcj around peak time. Based on our first detection with P48 ( mag), we can constrain the peak -band magnitude to be mag. Correcting for extinction (Galactic plus local), our upper-limit on the peak -band magnitude of PTF11qcj ( mag) corresponds to an absolute -band peak magnitude of mag. This limit is compatible with the average -band peak magnitudes found in recent systematic studies of Ib/c SNe (Drout et al., 2011).
In the 15 days following the P48 discovery, the P48 -band light curve of PTF11qcj decreased by mag. The optical light curve of the GRB-associated SN 1998bw dropped by 1.1 mag in the first 15 d after peak (McKenzie & Schaefer, 1999). Note that for PTF11qcj the 15-days magnitude drop is calculated with respect to the discovery time rather than the peak time; however, we likely discovered the PTF11qcj around peak. In Figure 2, we show a comparison between the PTF11qcj -band light curve, and the light curves of the Ic SN 1994I (Richmond et al., 1996), and the Ic-BL SN 1998bw (Clocchiatti et al., 2011), scaled to the distance of PTF11qcj. The explosion time of PTF11qcj is taken as d before peak, where the last is assumed to be coincident with our -band discovery (as suggested by our spectral analysis). A rise time of d is a factor of shorter than the rise time of SN 1998bw ( d). Indeed, the SN 1998bw -band light curve compressed by a factor of (Figure 2, orange dashed-line) seems to match the one of PTF11qcj.
The early-time ( d) evolution of Ib/c SNe is usually referred to as the photospheric phase. This phase is characterized by a high optical depth, and a post-maximum light curve decay rate slower than the 56Ni-to-56Co decay. During this phase, we can use the light curve properties to estimate the physical parameters of the SN explosion (Arnett, 1982): the 56Ni mass, the ejecta mass, and the kinetic energy. From Figure 22 in Drout et al. (2011), for mag and mag, we roughly estimate and . For a photospheric velocity of 22,000 km s-1 (Section 3.1), these values imply (e.g., Equations (1)-(2) in Drout et al., 2011) and erg. While these are very tentative estimates due to the uncertainties in the PTF11qcj peak-time and magnitude, these values are compatible with the ones observed for other Ib/c SNe. Particularly, the energy is consistent with what observed for BL-Ic and engine-driven events (Drout et al., 2011).
3.4 Radio emission modeling
Our radio monitoring campaign reveals that PTF11qcj is among the most radio-luminous Ib/c SNe. With a peak luminosity of erg s-1 Hz-1, PTF11qcj is comparable to the GRB-associated SN 1998bw (Figure 10; Kulkarni et al., 1998). From the presence of incoherent radio emission, assuming a non-relativistic source, we can derive a lower-limit on the size of the emitter (), by imposing that the brightness temperature does not exceed the equipartition value of K (Readhead, 1994; Kulkarni et al., 1998):
| (1) |
where is Boltzmann’s constant, is the observing frequency, is the observed flux density, and is the angular diameter of the emitting region. As evident from the above Equation, the largest lower limits are obtained for the lowest frequencies (and highest fluxes). Adopting the flux measured at GHz around day 100 (when the low-frequency radio flux is around peak), we get as. At the distance of PTF11qcj, this corresponds to a size of cm, or an average expansion speed c. We note that typical average speeds measured for the fastest moving ejecta of non GRB-associated Ib/c SNe are in the range (Berger et al., 2003; Wellons et al., 2012).
A remarkable feature of PTF11qcj is that its radio light curves do not show a smooth evolution (see Figure 10). This behavior, while difficult to model, is not completely unusual. Indeed, Soderberg et al. (2006b) found that of radio SNe show evidence for abrupt light curve variability, including abrupt steepening, abrupt rise, or episodic variations ( than a factor of 2 in flux) of the radio light curve. These are typically explained as inhomogeneities in the CSM. We caution, however, that data corresponding to the most abrupt flux variation observed for PTF 11qcj - a factor of in about 1 day between and MJD - were collected in 2012 while the VLA antennas were being moved from the D to the C configuration.


Radio SNe are known to emit non-thermal synchrotron radiation. According to the model proposed by Chevalier (1982), the relativistic electrons and amplified magnetic fields necessary for synchrotron emission are produced in the SN blast wave during the interaction with an ionized CSM. The last is usually assumed to be emitted via a constant mass-loss rate, constant velocity wind (i.e., ) from a massive progenitor. The observed radio emission is characterized by a smooth turn-on first at higher frequencies, and later at lower frequencies, usually explained as temporally decreasing self-absorption as the shock propagates toward lower density regions. The initial turn on may also be related to free-free absorption in the ionized CSM (Chevalier, 1998). While external free-free absorption from a homogeneous medium is predicted to cause an exponential rise of the low-frequency radio flux, a power-law is characteristic of self-absorption, internal absorption from thermal absorbing gas mixed into the synchrotron emitting gas, or free-free absorption from a clumpy external medium (Weiler et al., 1990).
In Figure 12 we show the observed spectral indices (with ) for PTF11qcj, as derived from VLA observations in adjacent sub-bands.


The observed spectral indices at early times do not exceed the limiting value of expected in the case of synchrotron self-absorption. In what follows, we thus assume the simplest “standard” synchrotron-self absorption model. However, we stress that alternative scenarios invoking internal free-free absorption, or free-free absorption from a clumpy CSM, may also explain such spectral indices and/or contribute to the attenuation mechanisms during the earlier part of our observations (Chevalier, 1998; Weiler et al., 1990).
To estimate the physical parameters of PTF11qcj, we follow the formulation by Soderberg et al. (2005) for synchrotron self-absorbed emission arising from sub-relativistic SN ejecta expanding in a smooth circumstellar medium with a power-law density distribution. Given the observed variability of PTF 11qcj, we do not expect smooth hydrodynamic models to provide a perfect fit to its radio observations. Nevertheless, we attempt such modeling to provide a tentative estimate of the bulk properties of PTF 11qcj and its surrounding environment. Hereafter, we consider all the data points collected with the VLA before 56101 MJD. On and after this epoch, a radio re-brightening is evident (possibly associated with an enhanced density CSM; Figure 11 and 13). Since late-time radio observations of PTF 11qcj aimed at confirming and tracking this phase of enhanced emission are on-going at the time of writing, here we concentrate on the interpretation of the earlier epochs.
Within the synchrotron self-absorbed model, at any time the observed synchrotron emission originates from a shell of shock-accelerated electrons, with radius and and thickness . The shell expands spherically while following a self-similar evolution in the interaction with a smooth CSM. The electrons are accelerated into a power-law energy distribution , with , and carry a fraction of the energy density of the ejecta. A fraction of such energy goes into magnetic fields. The temporal evolution of the radius (), magnetic field (), minimum Lorentz factor (), and of the electrons-to-magnetic field energy ratio (), is parametrized as follows (Soderberg et al., 2005, 2006a):
| (2) | |||||
| (3) |
where is an arbitrary reference time that we set to day 10 since explosion, and is the explosion time of the SN. In the above equations, (Chevalier, 1982, 1996), where n characterizes the density profile of the outer SN ejecta (), and characterizes the density profile of the radiating electrons within the shocked CSM ().
In the “standard” scenario (Chevalier, 1996), the magnetic energy density () and the relativistic electron energy density () are assumed to be a fixed fraction (i.e., ) of the total post-shock energy density (). With these assumptions (Soderberg et al., 2005, 2006a),
| (4) |
and
| (5) |
With the above parametrization, the flux density from the uniform shell of radiating electrons reads (Soderberg et al., 2005, 2006a):
| (6) |
where , and
| (7) |
is the characteristic synchrotron frequency of electrons with Lorentz factor ; and are integrals of the modified Bessel function of order 2/3 (see Equation (A11) in Soderberg et al., 2005); parametrizes the sharpness of the spectral break between optically thick and thin regimes (Soderberg et al., 2005, 2006a), and
| (8) |
As evident from Equations (6)-(8), the observed spectral and temporal evolution of the radio emission depends on the parameters . Note that the three parameters , , and are functions of the four normalization constants , , , 171717We refer the reader to Equations (6)-(8) in Soderberg et al. (2005) for the expression of , , , as functions of , , , . (and of the source distance ). Thus, while , , and can be determined by comparison with the data, another constraint is needed to derive , , , from the fitted values of , , and . Following common practice in radio SNe studies, we set (as expected for a wind density profile), , and GHz. This reduces the number of free parameters to five, , or four when the explosion date is known.
In the case of PTF11qcj, we first set MJD (as suggested by our optical observations; see Sections 3.1 and 3.3). Using a minimization procedure and the simplified four-parameter model described above, we obtain the results reported in Table 1 (Model 1). The model predictions are shown in Figures 11-13 (dotted lines). From our radio best fit results and by Equations (2-3) here and (6-8) in Soderberg et al. (2005), we derive the evolution of , , and (Table 1). The radial evolution is within the expected range of (Chevalier, 1996, 1998), and it implies an ejecta velocity of at day 10. A velocity of at day 10, is somewhat higher than the typical range of for normal Ib/c SNe (e.g., Berger et al., 2003), but significantly slower than SN 1998bw, for which the bulk Lorentz factor was estimated to be on a similar timescale (Kulkarni et al., 1998; Li & Chevalier, 1999). We also note that the implied velocity of at the time of our first spectrum of PTF11qcj, is consistent with the lower-limit estimate derived from the Ca triplet ( km s-1), while the implied size at day 100 ( cm) is consistent with the lower limit ( cm at day 100) derived in Equation (1).
The number density of the emitting electrons, progenitor mass loss rate, and total energy of the ejecta, then follow from the relations (Soderberg et al., 2005, 2006a):
| (9) |
| (10) |
| (11) |
for a nucleon-to-electron density ratio of 2 (as appropriate for W-R winds). The values derived for these quantities within Model 1 are also reported in Table 1.
| Model 1 (fixed ) | Model 2 (free ) | |
| (MJD) | 55842 | |
| (cm) | ||
| (G) | ||
| -1 | -1 | |
| -0.40 | -0.40 | |
| (cm-3) | ||
| () | ||
| 0 | 0 | |
| (erg) | ||
| 0.40 | 0.40 |
In terms of total energy in the radio emitting material, PTF11qcj ranks as one of the most energetic Ib/c SNe, comparable to the GRB-associated SN 1998bw (Kulkarni et al., 1998), and similar to other radio SNe that show evidence for CSM density variations (e.g., SN 2003bg; Soderberg et al., 2006a). The mass-loss rate estimates for GRBs and engine-driven SNe such as 1998bw are typically (Panaitescu & Kumar, 2002; Yost et al., 2003; Chevalier et al., 2004). PTF11qcj lies at the higher end of the range observed for local W-R stars, (Cappa et al., 2004), and is similar to normal type Ib/c SNe with prominent variations in the radio light curves (such as SNe 2004cc and 2004gq; Soderberg et al., 2006a; Wellons et al., 2012).
As underlined before, we do not expect the simplified model used in our analysis to provide a perfect fit to (nor to represent a complete physical interpretation of the) PTF11qcj radio emission. Indeed, our high d.o.f= is similar to what obtained in other analyses of complex radio SN light curves (e.g., Soderberg et al., 2006a; Krauss et al., 2012). So the results of our fit should be regarded as a tentative insight into the properties of the PTF11qcj fastest ejecta and CSM.
The match between Model 1 and data is most problematic during the earlier observations at the lowest frequencies ( GHz): we caution, however, that at such low frequencies the data are most affected by RFI, so the uncertainties on the measured fluxes may be underestimated.
We note that it is unlikely that the high value of the derived for the radio model is entirely dominated by interstellar scattering and scintillation (ISS). Indeed, considering the data collected at MJD (i.e., in between d since 55842 MJD), we derive a modulation index with respect to our best fit model flux predictions (),
| (12) |
(where are the measured flux densities and their measured uncertainties), of for GHz (with the highest modulation observed at the lowest frequencies). Using the maps provided by Walker (2001) and the PTF11qcj Galactic coordinates (, ), we roughly estimate GHz for the ISS transition frequency between the strong and weak scattering regimes (thus, our lowest frequency observations are in the strong scattering regime), and as for the Fresnel angle at the transition frequency. The expected value for the modulation index in the refractive strong scattering reads (e.g., Walker, 1998, 2001; Kulkarni et al., 1998; Cenko et al., 2013):
| (13) |
with
| (14) |
Using the above Equations, requires as around day 130, or cm, which is a factor of smaller than the radius at day 130 implied by our radio fits. Moreover, flux variations are observed up to the highest frequencies of our observations (16 GHz), that fall in the weak scattering regime (and so the observed modulations at such frequencies cannot be explained by ISS).
Due to the uncertainties in the explosion date of PTF 11qcj, we also performed a fit removing the constraint on the explosion time (Model 2; see Table 1 and the solid lines in Figures 11-13). In this case the fit drives around the discovery time of PTF 11qcj, MJD, and /d.o.f.=1717/89. We note, however, that in this last model the velocity of the fastest ejecta is rather high, at day 10. Assuming PTF11qcj exploded around MJD (see Section 3.1), the delayed onset of the radio emission may be interpreted as interaction with a shell whose inner radius is located at a distance km s d cm. This is comparable to the distances that may have been reached by material ejected during the pre-SN activity event probed by our P48 pre-discovery images (see Section 3.2), if such material was ejected at speeds v km s-1.
An element common to both the above fit results is the low value of , a parameter that measures the sharpness of the spectral break between optically thick and thin regimes. Indeed, we see that at the higher frequencies the late-time spectral index of PTF11qcj appears to remain , or show an abrupt increase (this is evident during our latest two VLA observations; Figure 12 and Figure 13) rather than transition toward a value of . Recently, Björnsson (2013) has shown that the broadening observed in the radio spectra and/or light curves of some type Ib/c SNe may be a direct indication of inhomogeneities in the CSM.
The increase in spectral index observed for PTF11qcj at d (during the re-brightening phase) in the 2.5-13 GHz range is reminiscent of cases like the normal type Ic SN 2004cc, for which light curve variations associated with an increase of the spectral peak have been observed (Wellons et al., 2012), or the Ic-BL SN 2007bg, for which an increase in the flux density accompanied by an increase in spectral index was observed around day 300 and interpreted as an absorption turn-on associated with a sharp CSM density enhancement presumably due to evolution of the progenitor wind (Salas et al., 2013). Indeed, this event seems most similar to PTF11qcj (see also Figure 10). According to our radio modeling of the earlier data, the re-brightening occurs at cm.
Finally, we note that Moriya et al. (2013) have recently investigated the link between LBV as SN progenitors and the appearance of episodic light curve modulations in the radio light curves of the SN events, showing how these early modulations have the potential to probe the progenitor’s mass loss history immediately before the SN explosion. A long-term monitoring campaign of PTF11qcj aimed at tracking the properties of its late-time re-brightening is on-going at the time of writing.
3.5 X-ray emission modeling
We performed a spectral fit of our three observations of PTF11qcj with Chandra (Figure 14). We used a power-law model with fixed , and power-law index (where ) free to vary but constrained to be the same across the three epochs. Flux normalizations were set free to vary for each epoch. This way, we derive ( confidence; Cstat/d.o.f.=5.18/3) for cm-2 (Galactic column density in the direction of PTF11qcj). We achieve satisfactory X-ray spectral fits for fixed and power-law photon index unchanging across the three epochs, as long as is less than a few cm-2. Even if the CSM is not ionized, this upper-limit on is consistent with the mass-loss (and radius at day 100) derived from our radio analysis. Indeed, for a given and , the implied (from to infinity) reads (e.g., Ofek et al., 2013a):
| (15) |
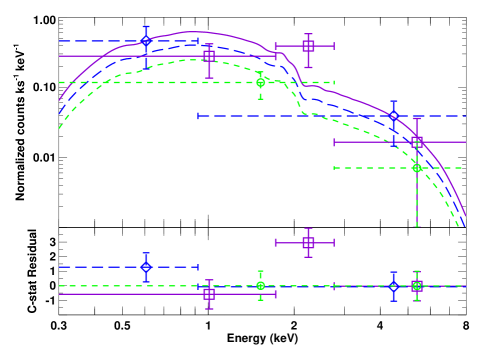
From the above spectral analysis, we derive the corresponding unabsorbed X-ray fluxes for the three epochs (see the last column in Table LABEL:X). If we conservatively assume that all the flux measured during the last of our Chandra observations is entirely due to the contribution of the host galaxy, and subtract such flux from the flux measured during the first epoch, then we get that the X-ray emission from PTF11qcj is erg cm-2 s-1, which corresponds to an X-ray luminosity erg s-1 (0.3-8 keV; cps-to-flux conversion computed assuming the best fit , and an cm-2).
Hereafter, we consider three main mechanism to explain PTF11qcj X-ray observations (Chevalier & Fransson, 2006): synchrotron emission; thermal (free-free) bremsstrahlung emission from material in the circumstellar shock or in the ejecta reverse shock; and inverse Compton scattering of photospheric emission photons by relativistic electrons.
The radio-to-X-ray spectral index estimated comparing the 16 GHz flux of PTF11qcj around the time of our first Chandra observation ( mJy) with the X-ray one ( mJy), is . The last is in agreement with both the X-ray spectral index derived from the analysis of our Chandra data, and the radio synchrotron self-absorbed model discussed in the previous section. Indeed, within the last model, the optically thin portion of the synchrotron spectrum is predicted to have a photon index of .
Based on the above considerations, synchrotron emission would seem to be the most straightforward interpretation of the PTF11qcj X-ray observations. A complication (not unique to the case of PTF11qcj) arises from the fact that the synchrotron cooling break is expected to steepen the spectral index between the radio and X-ray bands. For PTF11qcj, this would cause the X-ray flux extrapolated from our radio data to fall below the one measured by Chandra. However, Ellison et al. (2000) have suggested that a cosmic-ray dominated shock can flatten the synchrotron spectrum at high frequencies, and Chevalier & Fransson (2006) have invoked such a flattening to explain the X-ray emission of SN 1994I in the context of synchrotron emission.
Within the thermal emission hypothesis, X-rays are produced while the forward shock plows into the CSM and/or by the reverse shock heating the ejecta. Thus, the X-ray luminosity depends on the density of the emitting material, which then cools by free-free emission. For an wind density profile, the free-free luminosity can be estimated as (e.g., Chevalier & Fransson, 2001; Sutaria et al., 2003; Soderberg et al., 2005, 2006a; Ofek et al., 2013b):
| (16) |
where accounts for both the reverse and forward shock contribution181818The factor of 4 accounts for the fact that the density behind the forward shock () is 4 times larger than the CSM one; moreover, the expression for C takes into account the fact that (Chevalier & Fransson, 2001).. As evident from the above Equation, for typical values of (i.e., or ; Chevalier, 1982) and (as typically found in Ib/c SNe; Wellons et al., 2012), erg s-1 at 100 d requires r (100 d) cm. This is smaller than the r (100 d) cm derived from Equation 1, and r (100 d) cm derived from the radio modeling (see Table 1).
In the inverse Compton scenario, the X-ray luminosity can be estimated as follows (e.g., Björnsson & Fransson, 2004; Soderberg et al., 2005, 2006a):
| (17) |
where:
| (18) |
and (Soderberg et al., 2006a):
| (19) |
For PTF11qcj, using our late-time P48 photometry and applying a tentative bolometric correction of (for a SN temperature of K; Corsi et al., 2012), we estimate during the first Chandra epoch. Also, at this time, we estimate and G based on the radio model discussed in Section 3.4. Thus, we get erg cm-3 and erg cm-3, or . Since erg s-1 (based on the 16 GHz flux of mJy during the first Chandra observation), we derive erg s-1, which underestimates the observed X-ray luminosity by a factor of .
In conclusion, synchrotron emission seems to be the easiest explanation for the X-ray counterpart to PTF11qcj but, as discussed before, a mechanism flattening the spectrum at high frequencies (such as a cosmic-ray dominated shock) would be required. Free-free emission could explain the observed counterpart only for mass-loss rates in excess of the highest values found for SNe of type Ib/c (yr-1); the inverse Compton scenario seems hard to reconcile with the observed X-ray counterpart to PTF 11qcj, unless the magnetic field energy is much lower than what estimated from the radio fit (which assumes equipartition; see also Horesh et al., 2012).
3.6 Search for -rays
Given the radio and X-ray detections of PTF11qcj, we have searched the Fermi GRB catalog for GRBs with explosion date in between the time of our first detection of PTF11qcj, and a month earlier. No GRBs were found within such time frame, with positions compatible with PTF11qcj. The non-relativistic speeds suggested by the simplest radio model (Section 3.4) are in agreement with the lack of a GRB detection.
From a tentative comparison with the light curves of off-axis low-luminosity GRBs expanding in a constant density environment available in the literature (van Eerten & MacFadyen, 2011), we deduce that fitting the PTF11qcj radio and X-ray emission within the simplest off-axis GRB scenarios, may be difficult to achieve. Moreover, despite there is some amount of controversy in the literature concerning whether the contribution from a GRB counter jet could cause a late-time light curve bump (e.g., Li & Song, 2004; Wang et al., 2009; van Eerten & MacFadyen, 2011), the late-time radio re-brightening observed in PTF11qcj is a feature that challenges the simplest off-axis models.
3.7 IR echo
We detected an IR counterpart to PTF11qcj in both the Spitzer (Figure 7) and P200 (Figure 1) images. The extrapolation from the visible light spectral energy distribution suggests that a late-time IR excess may be associated with PTF11qcj (Figure 15). A continuum IR emission can be expected from hot dust - either newly formed hot dust, or pre-existing dust in the CSM that is heated by the SN. Several heating mechanisms are possible. Pre-existing dust, for example, may be collisionally heated by hot shocked gas, or radiatively heated by either the peak SN luminosity or the late-time optical emission from circumstellar interaction (e.g., Draine & Salpeter, 1979; Draine, 1981; Dwek, 1983, 1985).

Detailed modeling of the dust components and heating mechanisms is hard to accomplish with only upper limits. Nonetheless, we can get some tentative insight into the properties of the dust using our Spitzer and P200 observations. The following analysis should be considered as an order of magnitude estimate of the dust properties around PTF11qcj, rather than an accurate measurement.
The simplest scenario usually invoked to explain IR echos observed in type II SNe is that of radiative heating of pre-existing dust by the SN optical emission. The SN peak luminosity is expected to vaporize the dust out to a vaporization radius , and heat the inside of this shell to a temperature roughly equal to the vaporization temperature, K for graphite (hereafter, we limit our discussion to graphite grains only since our data do not allow us to distinguish between e.g. graphite and silicate). Alternatively, the dust may be formed at a radius larger than the vaporization radius, and heated to a temperature .
For simple dust populations composed entirely of graphite with a single grains size, we can estimate the echo (vaporization) radius () of a dust shell at ( K), using the estimated peak bolometric luminosity of PTF11qcj (), and the fact that the equilibrium dust temperature is set by balancing the energy absorbed by a spherical dust grain of radius (Fox et al., 2010):
| (20) |
and the energy emitted by the dust:
| (21) |
In the above Equations we have assumed wavelength dependent emissivities/absorption (Draine & Lee, 1984; Laor & Draine, 1993); is the Planck black-body function; is the Stefan-Boltzmann constant; K is the effective SN temperature; and the effective SN emitting radius. The equality condition yields (Fox et al., 2010):
| (22) |
where is the mass absorption coefficient, and g cm-3 (Smith et al., 2008) is the assumed dust density.
To estimate PTF11qcj peak bolometric luminosity we use the observed P48 peak magnitude corrected for Galactic and local host galaxy extinction, and apply a bolometric correction of mag (for a SN temperature of K; Corsi et al., 2012). This way we get (but note that our observations do not allow us to precisely constrain the optical peak). Thus, from Equation (22):
| (23) |
The above range is calculated for dust grains of sizes m, and the smaller are for the larger dust grains (note that in Equation (22) ).
In the radiative heating scenario, the shock radius () sets a lower limit for the dust radius (since any dust within this radius would be independently heated or destroyed by the forward shock). At the time of our first Spitzer observation:
| (24) |
The smallest value above is calculated assuming an average speed of km s-1 as indicated by the optical spectra of PTF11qcj (Section 3.1), while the largest value is derived from the radio model (radio emission probes the fastest ejecta; see Section 3.4). Moreover, if the dust shell is located at or beyond the vaporization radius, light travel time effects cause the thermal radiation from the dust grains to reach the observer over an extended period of time (thus the term “IR echo”). So the duration of the IR echo sets a scale for the dust radius (Fox et al., 2010, 2011):
| (25) |
Using the fact that in the case of PTF11qcj d, we deduce cm (which is indeed larger than, or at the least comparable to, - this assures self-consistency of the IR echo scenario).
Since , we conclude that the dust should be at in order for the IR echo scenario to be self-consistent. Using again Equation (22), and setting the condition cm, we derive the maximum temperatures that the dust can reach when heated by PTF11qcj optical peak:
| (26) |
where the smallest temperature is for dust of size m located at a dust echo radius of cm, while the largest temperature is for dust grains of m located at cm. We note that temperatures in the range of 500-770 K are typically found in modeling type IIn SNe emission with graphite dust grains of sizes m (Fox et al., 2011).
For optically thin dust with mass , located at a distance from the observer, and thermally emitting at a single equilibrium temperature (note that the IR emission of SNe such as SN 2006jd and SN 2005ip was best fit by a multi-component dust model as opposed to a single component one; here we limit our discussion to a single component - a similar approach has been used for other SNe with limited data-sets; see e.g. Fox et al. (2011)), the total flux reads (see e.g. Fox et al., 2010):
| (27) |
where is defined in Equation (21). As shown in Figure 15, for dust grains of sizes m we tentatively estimate dust masses in the range M⊙. For comparison, dust masses in the range are typically invoked for type IIn SNe with IR emission (Fox et al., 2011).
The estimates derived in this section are subject to the large uncertainties related to the limitation of our IR data-set. However, a light echo scenario from pre-existing dust, presumably emitted by the SN progenitor before the SN itself, seems to offer a consistent explanation.
4 Summary
We have presented panchromatic follow-up observations of SN PTF11qcj, that span an epoch of up to yr since optical discovery. While longer-time follow-up at radio wavelengths is still on-going at the time of writing, the radio (VLA and CARMA), IR (Spitzer and P200), optical (P48, P60, LT, WHT, and Keck), and X-ray (Swift and Chandra) data presented here allow us to estimate the mass-loss, energy, and mean expansion velocity of this interacting SN. PTF11qcj is as radio-luminous as the GRB-associated SN 1998bw, and comparably energetic. However, its fastest-moving ejecta are slower, and appear to be expanding in a CSM of density substantially higher than usually observed in engine-driven SNe, but comparable to other Ib/c SNe showing prominent radio light curve variations.
Our X-ray observations likely suffer from some contamination from PTF11qcj host galaxy. We have conservatively set a lower-limit to PTF11qcj X-ray emission by subtracting the flux measured during the third epoch of our Chandra observations to the one observed during the first epoch. All the models we considered to explain PTF11qcj X-ray observations tend to predict an X-ray flux that falls below our lower-limit to PTF11qcj X-ray counterpart. Synchrotron emission may offer a viable explanation of our X-ray measurements if a mechanism flattening the spectrum at high frequencies (such as a cosmic-ray dominated shock) is invoked. Free-free emission could explain the observed counterpart only for mass-loss rates in excess of the highest values found for SNe of type Ib/c (yr-1).
The IR excess detected at the location of PTF11qcj suggests an IR echo associated with radiative heating of pre-existing dust by the SN optical emission. The order-of-magnitude estimates derived for the values of dust mass and temperature, seem to be compatible with those of type IIn SNe. However, these estimates are subject to the large uncertainties related to the contamination from the SN host galaxy. Observations of the PTF11qcj host galaxy aimed at better estimating the level of contamination to the IR counterpart of PTF11qcj will be the subject of a future paper.
Our optical observations of the PTF11qcj field about 2 yr before discovery, show tentative evidence for a precursor eruption that could have emitted the material with which the SN is observed to interact. However, we can exclude a precursor as bright as the one observed 2 yr before the Ibn SN 2006jc. Given the relatively large amount of mass-loss rate deduced from the radio modeling (yr-1), it may be possible that some of this mass was lost in an eruptive process. Indeed, our radio observations presumably require a non-smooth density profile that can be explained by periods of higher-than average mass-loss rates (via eruptions) from the PTF11qcj progenitor.
Overall, PTF11qcj seems to be consistent with the explosion of a massive W-R star. Future data from our long-term monitoring campaign of this source will allow us to further constrain the properties of this rare SN.
References
- Arnett (1982) Arnett, W. D. 1982, ApJ, 253, 785
- Begelman & Sarazin (1986) Begelman, M. C., & Sarazin, C. L. 1986, ApJ, 302, L59
- Berger et al. (2003) Berger, E., Kulkarni, S. R., Frail, D. A., & Soderberg, A. M. 2003, ApJ, 599, 408
- Björnsson (2013) Björnsson, C.-I. 2013, ApJ, 769, 65
- Björnsson & Fransson (2004) Björnsson, C.-I., & Fransson, C. 2004, ApJ, 605, 823
- Bloom et al. (2012) Bloom, J. S., et al. 2012, PASP, 124, 1175
- Bramich (2008) Bramich, D. M. 2008, MNRAS, 386, L77
- Cappa et al. (2004) Cappa, C., Goss, W. M., & van der Hucht, K. A. 2004, AJ, 127, 2885
- Cenko et al. (2006) Cenko, S. B., et al. 2006, PASP, 118, 1396
- Cenko et al. (2013) Cenko, S. B., et al. 2013, ApJ, 769, 130
- Chevalier (1982) Chevalier, R. A. 1982, ApJ, 259, 302
- Chevalier (1996) Chevalier, R. A. 1996, in Astronomical Society of the Pacific Conference Series, Vol. 93, Radio Emission from the Stars and the Sun, ed. A. R. Taylor & J. M. Paredes, 125
- Chevalier (1998) Chevalier, R. A. 1998, ApJ, 499, 810
- Chevalier & Fransson (2001) Chevalier, R. A., & Fransson, C. 2001, ArXiv: astro-ph/0110060
- Chevalier & Fransson (2006) Chevalier, R. A., & Fransson, C. 2006, ApJ, 651, 381
- Chevalier et al. (2004) Chevalier, R. A., Li, Z.-Y., & Fransson, C. 2004, ApJ, 606, 369
- Clocchiatti et al. (2011) Clocchiatti, A., Suntzeff, N. B., Covarrubias, R., & Candia, P. 2011, AJ, 141, 163
- Clocchiatti et al. (1996) Clocchiatti, A., Wheeler, J. C., Brotherton, M. S., Cochran, A. L., Wills, D., Barker, E. S., & Turatto, M. 1996, ApJ, 462, 462
- Corsi et al. (2012) Corsi, A., et al. 2012, ApJ, 747, L5
- Draine (1981) Draine, B. T. 1981, ApJ, 245, 880
- Draine & Lee (1984) Draine, B. T., & Lee, H. M. 1984, ApJ, 285, 89
- Draine & Salpeter (1979) Draine, B. T., & Salpeter, E. E. 1979, ApJ, 231, 77
- Drout et al. (2011) Drout, M. R., et al. 2011, ApJ, 741, 97
- Dwek (1983) Dwek, E. 1983, ApJ, 274, 175
- Dwek (1985) Dwek, E. 1985, ApJ, 297, 719
- Ellison et al. (2000) Ellison, D. C., Berezhko, E. G., & Baring, M. G. 2000, ApJ, 540, 292
- Faber et al. (2003) Faber, S. M., et al. 2003, in Society of Photo-Optical Instrumentation Engineers (SPIE) Conference Series, Vol. 4841, Society of Photo-Optical Instrumentation Engineers (SPIE) Conference Series, ed. M. Iye & A. F. M. Moorwood, 1657
- Fazio et al. (2004) Fazio, G. G., et al. 2004, ApJS, 154, 10
- Filippenko (1997) Filippenko, A. V. 1997, ARA&A, 35, 309
- Filippenko & Sargent (1986) Filippenko, A. V., & Sargent, W. L. W. 1986, AJ, 91, 691
- Foley et al. (2007) Foley, R. J., Smith, N., Ganeshalingam, M., Li, W., Chornock, R., & Filippenko, A. V. 2007, ApJ, 657, L105
- Fox et al. (2010) Fox, O. D., Chevalier, R. A., Dwek, E., Skrutskie, M. F., Sugerman, B. E. K., & Leisenring, J. M. 2010, ApJ, 725, 1768
- Fox et al. (2011) Fox, O. D., et al. 2011, ApJ, 741, 7
- Gal-Yam et al. (2002) Gal-Yam, A., Ofek, E. O., & Shemmer, O. 2002, MNRAS, 332, L73
- Galama et al. (1998) Galama, T. J., et al. 1998, Nature, 395, 670
- Gehrels et al. (2004) Gehrels, N., et al. 2004, ApJ, 611, 1005
- Horesh et al. (2012) Horesh, A., et al. 2012, ArXiv e-prints 1209.1102
- Howell et al. (2005) Howell, D. A., et al. 2005, ApJ, 634, 1190
- Immler et al. (2008) Immler, S., et al. 2008, ApJ, 674, L85
- Krauss et al. (2012) Krauss, M. I., et al. 2012, ApJ, 750, L40
- Kulkarni et al. (1998) Kulkarni, S. R., et al. 1998, Nature, 395, 663
- Laor & Draine (1993) Laor, A., & Draine, B. T. 1993, ApJ, 402, 441
- Law et al. (2009) Law, N. M., et al. 2009, PASP, 121, 1395
- Li & Song (2004) Li, Z., & Song, L. M. 2004, ApJ, 614, L17
- Li & Chevalier (1999) Li, Z.-Y., & Chevalier, R. A. 1999, ApJ, 526, 716
- Maguire et al. (2012) Maguire, K., et al. 2012, MNRAS, 426, 2359
- Mauerhan et al. (2013) Mauerhan, J. C., et al. 2013, MNRAS, 430, 1801
- Mazzali et al. (2002) Mazzali, P. A., et al. 2002, ApJ, 572, L61
- Mazzali et al. (2008) Mazzali, P. A., et al. 2008, Science, 321, 1185
- McKenzie & Schaefer (1999) McKenzie, E. H., & Schaefer, B. E. 1999, PASP, 111, 964
- Moriya et al. (2013) Moriya, T. J., Groh, J. H., & Meynet, G. 2013, ArXiv e-prints
- Nakano et al. (2006) Nakano, S., Itagaki, K., Puckett, T., & Gorelli, R. 2006, Central Bureau Electronic Telegrams, 666, 1
- Ofek et al. (2013a) Ofek, E. O., et al. 2013a, ApJ, 763, 42
- Ofek et al. (2011) Ofek, E. O., Frail, D. A., Breslauer, B., Kulkarni, S. R., Chandra, P., Gal-Yam, A., Kasliwal, M. M., & Gehrels, N. 2011, ApJ, 740, 65
- Ofek et al. (2012) Ofek, E. O., et al. 2012, PASP, 124, 62
- Ofek et al. (2013b) Ofek, E. O., Lin, L., Kouveliotou, C., Younes, G., Göǧüş, E., Kasliwal, M. M., & Cao, Y. 2013b, ApJ, 768, 47
- Ofek et al. (2013c) Ofek, E. O., et al. 2013c, Nature, 494, 65
- Oke et al. (1995) Oke, J. B., et al. 1995, PASP, 107, 375
- Panaitescu & Kumar (2002) Panaitescu, A., & Kumar, P. 2002, ApJ, 571, 779
- Pastorello et al. (2007) Pastorello, A., et al. 2007, Nature, 447, 829
- Patat et al. (2001) Patat, F., et al. 2001, ApJ, 555, 900
- Perley et al. (2009) Perley, R., et al. 2009, IEEE Proceedings, 97, 1448
- Pian et al. (1999) Pian, E., et al. 1999, A&AS, 138, 463
- Poznanski et al. (2012) Poznanski, D., Prochaska, J. X., & Bloom, J. S. 2012, MNRAS, 426, 1465
- Prieto et al. (2013) Prieto, J. L., Brimacombe, J., Drake, A. J., & Howerton, S. 2013, ApJ, 763, L27
- Rau et al. (2009) Rau, A., et al. 2009, PASP, 121, 1334
- Readhead (1994) Readhead, A. C. S. 1994, ApJ, 426, 51
- Richmond et al. (1996) Richmond, M. W., et al. 1996, AJ, 111, 327
- Salas et al. (2013) Salas, P., Bauer, F. E., Stockdale, C., & Prieto, J. L. 2013, MNRAS, 428, 1207
- Schlafly & Finkbeiner (2011) Schlafly, E. F., & Finkbeiner, D. P. 2011, ApJ, 737, 103
- Smith et al. (2008) Smith, N., Foley, R. J., & Filippenko, A. V. 2008, ApJ, 680, 568
- Soderberg et al. (2008) Soderberg, A. M., et al. 2008, Nature, 453, 469
- Soderberg et al. (2010) Soderberg, A. M., et al. 2010, Nature, 463, 513
- Soderberg et al. (2006a) Soderberg, A. M., Chevalier, R. A., Kulkarni, S. R., & Frail, D. A. 2006a, ApJ, 651, 1005
- Soderberg et al. (2005) Soderberg, A. M., Kulkarni, S. R., Berger, E., Chevalier, R. A., Frail, D. A., Fox, D. B., & Walker, R. C. 2005, ApJ, 621, 908
- Soderberg et al. (2006b) Soderberg, A. M., Nakar, E., Berger, E., & Kulkarni, S. R. 2006b, ApJ, 638, 930
- Steele et al. (2004) Steele, I. A., et al. 2004, in Society of Photo-Optical Instrumentation Engineers (SPIE) Conference Series, Vol. 5489, Society of Photo-Optical Instrumentation Engineers (SPIE) Conference Series, ed. J. M. Oschmann, Jr., 679
- Sutaria et al. (2003) Sutaria, F. K., Chandra, P., Bhatnagar, S., & Ray, A. 2003, A&A, 397, 1011
- van Eerten & MacFadyen (2011) van Eerten, H. J., & MacFadyen, A. I. 2011, ApJL, 733, L37
- Walker (1998) Walker, M. A. 1998, MNRAS, 294, 307
- Walker (2001) Walker, M. A. 2001, MNRAS, 321, 176
- Wang et al. (2009) Wang, X., Huang, Y. F., & Kong, S. W. 2009, A&A, 505, 1213
- Weiler et al. (1990) Weiler, K. W., Panagia, N., & Sramek, R. A. 1990, ApJ, 364, 611
- Weiler et al. (1986) Weiler, K. W., Sramek, R. A., Panagia, N., van der Hulst, J. M., & Salvati, M. 1986, ApJ, 301, 790
- Weisskopf et al. (2002) Weisskopf, M. C., Brinkman, B., Canizares, C., Garmire, G., Murray, S., & Van Speybroeck, L. P. 2002, PASP, 114, 1
- Wellons et al. (2012) Wellons, S., Soderberg, A. M., & Chevalier, R. A. 2012, ApJ, 752, 17
- Woosley & Bloom (2006) Woosley, S. E., & Bloom, J. S. 2006, ARA&A, 44, 507
- Yaron & Gal-Yam (2012) Yaron, O., & Gal-Yam, A. 2012, PASP, 124, 668
- York et al. (2000) York, D. G., et al. 2000, The Astronomical Journal, 120, 1579
- Yost et al. (2003) Yost, S. A., Harrison, F. A., Sari, R., & Frail, D. A. 2003, ApJ, 597, 459
| Date | Telescope | Band | Exposure Time | Magnitude |
|---|---|---|---|---|
| (MJD) | (s) | [AB] | ||
| 55857.543 | P48 | 60 | ||
| 55859.538 | P48 | 60 | ||
| 55862.530 | P48 | 60 | ||
| 55864.524 | P48 | 60 | ||
| 55865.520 | P48 | 60 | ||
| …191919This Table is published in its entirety in the electronic version of this paper; a portion is shown here for guidance regarding its form and content. | … | … | … | … |
| MJD | Observatory | Central freq. | Flux Density |
|---|---|---|---|
| (GHz) | (mJy/beam) | ||
| 55880.538 | VLA - D | 6 | |
| 55880.538 | VLA - D | 5 | |
| 55884.803 | CARMA | 93 | |
| 55887.508 | VLA - D | 7.4 | |
| 55887.508 | VLA - D | 5 | |
| 55891.640 | CARMA | 93 | |
| …202020This Table is published in its entirety in the electronic version of this paper; a portion is shown here for guidance regarding its form and content. | … | … | … |
| Date | Instrument | Band | Exposure Time | Count Rate | Flux (0.3-8 keV, unabs) |
|---|---|---|---|---|---|
| (MJD) | (keV) | (ks) | (s-1) | (erg cm-2 s-1) | |
| 55883.00 | Swift-XRT | 0.2-10 | 4.352 | ||
| 55916.71 | Swift-XRT | 0.2-10 | 4.937 | ||
| 55923.59 | Swift-XRT | 0.2-10 | 1.216 | ||
| 55930.02 | Swift-XRT | 0.2-10 | 1.538 | ||
| 55937.63 | Swift-XRT | 0.2-10 | 4.750 | ||
| 55949.07 | Swift-XRT | 0.2-10 | 9.231 | ||
| 55956.02 | Swift-XRT | 0.2-10 | 2.951 | ||
| 55957.09 | Swift-XRT | 0.2-10 | 2.402 | ||
| 55930 (mean) | Swift-XRT | 0.2-10 | 31.380 | ||
| 55939.05 | Chandra-ACIS | 0.3-8 | 9.836 | ||
| 55983.37 | Chandra-ACIS | 0.3-8 | 9.931 | ||
| 56028.36 | Chandra-ACIS | 0.3-8 | 19.930 |
| MJD | Observatory | Wavelength (m) | Flux density (Jy) |
|---|---|---|---|
| 56014.063 | P200 | 2.159 | |
| 56014.747 | Spitzer | 3.550 | |
| 56014.747 | Spitzer | 4.493 | |
| 56103.643 | Spitzer | 3.550 | |
| 56103.643 | Spitzer | 4.493 |