Evolution of Magnetism in Single-Crystal Honeycomb Iridates
Abstract
We report the successful synthesis of single-crystals of the layered iridate, (Na1-xLix)2IrO3, , and a thorough study of its structural, magnetic, thermal and transport properties. The new compound allows a controlled interpolation between Na2IrO3 and Li2IrO3, while maintaing the novel quantum magnetism of the honeycomb Ir4+ planes. The measured phase diagram demonstrates a suppression of the Néel temperature, , at an intermediate indicating that the magnetic order in Na2IrO3 and Li2IrO3 are distinct. X-ray data shows that for when is suppressed the most, the honeycomb structure is least distorted, suggesting at this intermediate doping that the material is closest to the spin liquid that has been sought after in Na2IrO3 and Li2IrO3. By analyzing our magnetic data with a single-ion theoretical model we also show that the trigonal splitting, on the Ir4+ ions changes sign from Na2IrO3 to Li2IrO3.
pacs:
75.10.Jm, 75.25.Dk, 75.40.CxIntroduction: – The iridates have recently been recognized as a unique arena for the study of new phases of matter that arise from simultaneously strong electron-electron and spin-orbit interactions. Thus far, the most novel manifestation of this interplay in this family of materials is the , Mott insulating state, originally experimentally observed in the layered perovskite, Sr2IrO4 Kim et al. (2008); Moon et al. (2008); Kim et al. (2009). The iridates have inspired a large body of theoretical and experimental work Witczak-Krempa et al. (2014), since the levels have mixed spin and orbital character, which may result in a host of exciting quantum ground states Wan et al. (2011).
The interest in this field received a major boost when a theoretical analysis Jackeli and Khaliullin (2009) showed that the oxygen mediated superexchange processes between the Ir4+ moments in the honeycomb iridates Na2IrO3 and Li2IrO3 result in the celebrated “Kitaev” model (KM) for the degrees of freedom, , where denotes a different Pauli matrix for each direction of bond on the honeycomb lattice and acts on the states on site . The KM can be solved exactly and its ground state is an exotic magnetically disordered quantum “spin liquid” Kitaev (2006). However, it is experimentally established that both honeycomb Iridate compounds order magnetically: Na2IrO3 orders at K Singh and Gegenwart (2010), and Li2IrO3 orders at K Kobayashi et al. (2003); Singh et al. (2012). There are many theoretical proposals for the interactions supplementary to the Kitaev model that would cause magnetic ordering including, additional exchange processes Chaloupka et al. (2010); Choi et al. (2012); Kimchi and You (2011); Singh et al. (2012); Price and Perkins (2012); Chaloupka et al. (2013); Kim et al. (2013), strong trigonal fields Bhattacharjee et al. (2012), or weak coupling instabilities Mazin et al. (2012); currently there is no consensus on which of these is correct.
On the experimental side, there are now fairly thorough studies of Na2IrO3 using both momentum resolved resonant inelastic X-ray and neutron scattering techniques that establish the pattern of magnetic ordering to be of an unusual zigzag type Liu et al. (2011); Ye et al. (2012); Choi et al. (2012); Gretarsson et al. (2013). This has been possible in part due to the availability of large single crystals of Na2IrO3. Because of various difficulties in chemical synthesis, no such single crystals are available for Li2IrO3 and the detailed magnetic ordering pattern of this compound is still unknown. It is noted that an early study on polycrystal Li2IrO3 exhibited no magnetic order above 5 K Felner and Bradaric (2002), but more recent measurements show a magnetic transition at K Singh et al. (2012). The conspicuous absence of single crystals of Li2IrO3 is clearly a major roadblock in a complete characterization of this material.
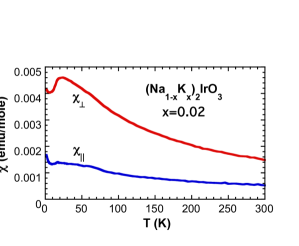
In this work we fill the gap in our understanding by the successful synthesis and study of single crystals of (Na1-xLix)2IrO3.111For comparison only, we also present some new results on the (Na1-xKx)2IrO3 (with ); the pure compound K2IrO3has not been synthesized yet. The central findings of our work are as follows: As is tuned we find from X-ray data that the lattice parameters evolve monotonically from Na to Li, retaining the basic Mott insulating honeycomb structure of the Ir4+ planes for all . Even so, there is a non-monotonic dramatic change in Néel temperature with , in which initially decreases from 18 K at to 1.2 K at before it rises to 7 K at , indicating that the magnetic ground states at and are not related linearly, as had been previously suggested Singh et al. (2012). X-ray structure data shows that the Ir4+ honeycomb lattice is least distorted at . Interesting, we find the lowest and highest frustration parameter also at . In addition, the high-temperature anisotropy in the magnetic susceptibility is simultaneously reversed and enhanced upon Li doping, and as a result, the in-plane magnetic susceptibility becomes significantly greater than the perpendicular-to-plane susceptibility, or for , which sharply contrasts with the the weaker magnetic anisotropy for where . Using a single ion theoretical model, we show that the anisotropy arises from a trigonal crystal field oriented perpendicular to the honeycomb layers, and the anisotropy change is the result of sign change in the local trigonal field between the Na and Li compounds. We thus conclude that the magnetic ground states of the pure Na and Li compounds are distinct and are separated by a quantum phase transition that is driven by the evolution of the crystal structure as is varied.
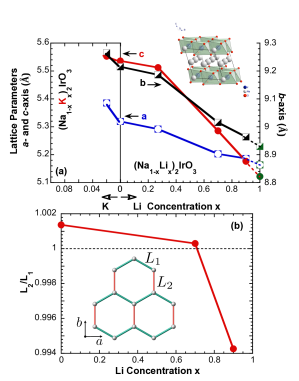
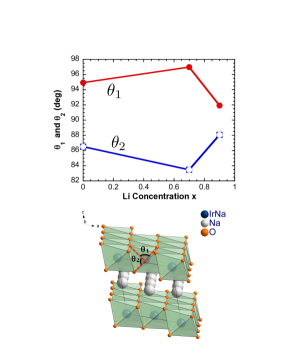
Measurements: – The methods by which our single crystals are grown and the measurements are carried out are described in the Supplementary Materials. Li doping retains the space group of C2/m that Na2IrO3 adopts but induces a systematic decrease in the lattice parameters since the ionic radius of the Li ion is approximately 25% smaller than that of the Na ion. The lattice parameters are shown in Fig. 1(a). An important feature of this change is that the lattice parameter is more severely compressed than the and . For example, for , the decrease in the , and is 2.5%, 2.7% and 6.5%, respectively. The corresponding angle between the -axis and the basal plane, , increases to 109.58∘ for from 108.67∘ for . In Fig. 1(b), we show how the distortion of the - honeycomb lattice on which the Ir4+ moments reside evolves with . The ratio, (defined in the inset), clearly shows the lattice anisotropy reversal from Na to Li.
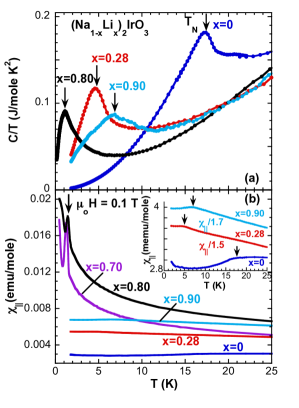
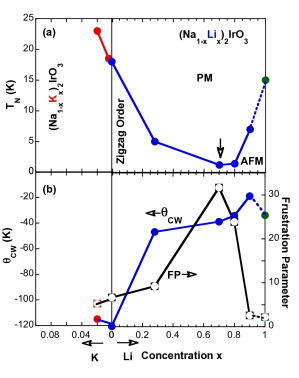
We extract by locating the low temperature peak in the specific heat , shown in Fig. 2(a), as well as the in-plane susceptibility, , shown in Fig. 2(b). The pronounced peaks in unambiguously signal a continuous magnetic phase transition for all . As shown in the main panel and inset of Fig. 2(b) we find consistent values for extracted from . Interesting is not a smooth interpolation between the already known and limits. It is initially suppressed from 18 K for to 5 K for and then to 1.2 K for before it rises to 1.4 K for and finally 7 K for . We note that the trend of increasing again in our single crystal is consistent with previous measurements on polycrystalline samples of Li2IrO3 Singh et al. (2012). A phase diagram that summarizes and the Curie-Weiss scale as a function of is shown in Fig. 3(a,b). A natural conclusion based on the strongly suppressed value of is that it goes to zero for some and one encounters at least one quantum phase transition in the evolution from Na2IrO3 to Li2IrO3 at , implying that the magnetic ground states of Na2IrO3 and Li2IrO3 are not adiabatically connected. It is interesting to note that at when is suppressed the most, the honeycomb plane is closest to ideal (i.e., in Fig. 1(b)). Finally, we note that the dominant role of Li doping is to tune the chemical pressure, which in turn causes an evolution of the lattice structure. This can be verified by noting that if we dope in K instead of Li, increases, as shown in Fig. 3 (a). This is consistent with K doping achieving negative chemical pressure because the ionic radius of K is larger than Na.
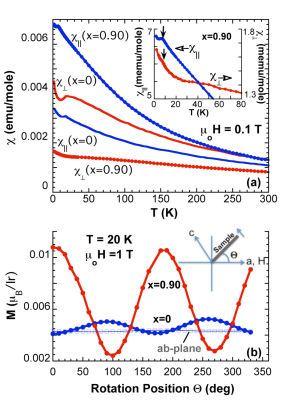
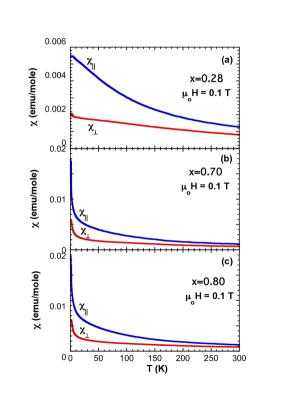
Anisotropy in : – There are a number of striking features observed in our measurements of the direction dependent susceptibility in our single crystal samples, data for and are shown in Fig. 4. Firstly, there are large anisotropies in the susceptibility even when ; indeed the Curie constant, itself depends on the direction of the applied field. We define the Curie-constant by the usual definition, . It is natural to attribute such anisotropies to the spin-orbit coupling (we study this in detail below). Secondly, the anisotropy between and is reversed upon Li doping: for , but for , .
In order to understand the origin of this change, we calculate the from the Hamiltonian for a single Ir ion with a configuration with spin orbit coupling , a trigonal distortion and an external field :
| (1) |
where are the usual spin-1 matrices and are the usual spin-1/2 matrices, satisfying and . We have made use here of the well-known, description of the states Abragam and Bleaney (1970). The trigonal distortion vector must point along a body diagonal of a cube that circumscribes the oxygen octahedra. In the material (see inset of Fig. 1(a)) the direction perpendicular to the honeycomb planes indeed points along a body diagonal for all the oxygen octahedra and is the natural direction to associate with (we will verify this assumption from an analysis of the magnetic data below; structural data included in the SM also verifies this assertion). We calculate , which in our theoretical calculation (see Supplementary Materials for details) only depends on , these are plotted in Fig. 5(a). We make the following observations from our model calculations: because of the rotational symmetry, is the same for all directions perpendicular to ; when the response is rotationally invariant (i.e. ) even when ; the anisotropy between and is reversed as the sign of changes; and, as expected for the system becomes rotationally invariant again.
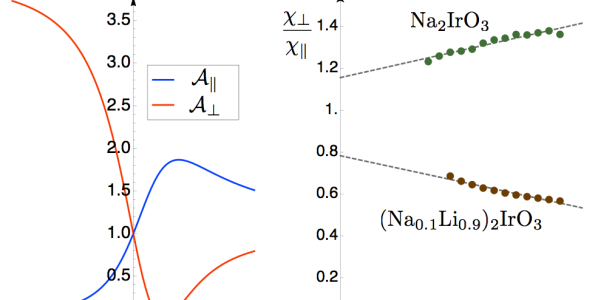
At high temperatures (), the Ir ions contribute to the susceptibility independently and one can hence use the high- experimental data to extract the Curie constants, . First of all, we find that the experimentally measured is the same within our errors of analysis for different directions in the honeycomb plane, but is clearly different for the direction perpendicular to the honeycomb layers (shown for by the rotation experiments in Fig. 4(b)); this fact substantiates our claim that the vector is along the direction perpendicular to the honeycomb layers. Next, as noted above the anisotropy in the susceptibility requires a finite , indicating that this paramater cannot be neglected in models of these materials. From Fig. 5, it is clear that the change in anisotropy between and indicates that the sign of changes between Na2IrO3 and Li2IrO3. Quantitatively, we extract the ratio by extrapolating as a function of , as shown in Fig. 5(b). For Na2IrO3 we can do this reliably. We estimate the for Na2IrO3, which we note is smaller than previous estimates Mazin et al. (2012); Gretarsson et al. (2013). Based on our data, we conclude that for Li2IrO3 the sign of changes and its magnitude is somewhat larger: our best estimate gives, .
In summary we present the first evidence that Na2IrO3 and Li2IrO3 have distinct magnetic orders, by studying the evolution of structural, thermodynamic and magnetic properties of (Na1-xLix)2IrO3 with across a phase transition at . Two possible tuning parameters for the phase transition that we have identified are the crystal field splitting, and the anisotropy of the distortion of the honeycomb layers, both of which change sign from the Na to Li compounds. It is likely that a competition between the two is required to explain the magnetic ordering. Exploring these issues is an exciting direction for future theoretical research.
The authors are thankful to Natasha Perkins and Feng Ye for useful discussions. This work was supported by the National Science Foundation under grants DMR-0856234, EPS-0814194, DMR-1265162, and DMR-1056536 (RKK,MT). GC also acknowledges the hospitality of the China High Magnetic Field Laboratory of the Chinese Academy of Sciences.
References
- Kim et al. (2008) B. J. Kim, H. Jin, S. J. Moon, J.-Y. Kim, B.-G. Park, C. S. Leem, J. Yu, T. W. Noh, C. Kim, S.-J. Oh, et al., Phys. Rev. Lett. 101, 076402 (2008), URL http://link.aps.org/doi/10.1103/PhysRevLett.101.076402.
- Moon et al. (2008) S. J. Moon, H. Jin, K. W. Kim, W. S. Choi, Y. S. Lee, J. Yu, G. Cao, A. Sumi, H. Funakubo, C. Bernhard, et al., Phys. Rev. Lett. 101, 226402 (2008), URL http://link.aps.org/doi/10.1103/PhysRevLett.101.226402.
- Kim et al. (2009) B. J. Kim, H. Ohsumi, T. Komesu, S. Sakai, T. Morita, H. Takagi, and T. Arima, Science 323, 1329 (2009), URL http://www.sciencemag.org/content/323/5919/1329.abstract.
- Witczak-Krempa et al. (2014) W. Witczak-Krempa, G. Chen, Y. B. Kim, and L. Balents, Annu. Rev. Cond. Mat. Phys. (2014), URL http://arxiv.org/abs/1305.2193.
- Wan et al. (2011) X. Wan, A. M. Turner, A. Vishwanath, and S. Y. Savrasov, Phys. Rev. B 83, 205101 (2011), URL http://link.aps.org/doi/10.1103/PhysRevB.83.205101.
- Jackeli and Khaliullin (2009) G. Jackeli and G. Khaliullin, Phys. Rev. Lett. 102, 017205 (2009), URL http://link.aps.org/doi/10.1103/PhysRevLett.102.017205.
- Kitaev (2006) A. Kitaev, Annals of Physics 321, 2 (2006), URL http://www.sciencedirect.com/science/article/pii/S00034916050%02381.
- Singh and Gegenwart (2010) Y. Singh and P. Gegenwart, Phys. Rev. B 82, 064412 (2010), URL http://link.aps.org/doi/10.1103/PhysRevB.82.064412.
- Kobayashi et al. (2003) H. Kobayashi, M. Tabuchi, M. Shikano, H. Kageyama, and R. Kanno, J. Mater. Chem. 13, 957 (2003), URL http://dx.doi.org/10.1039/B207282C.
- Singh et al. (2012) Y. Singh, S. Manni, J. Reuther, T. Berlijn, R. Thomale, W. Ku, S. Trebst, and P. Gegenwart, Phys. Rev. Lett. 108, 127203 (2012), URL http://link.aps.org/doi/10.1103/PhysRevLett.108.127203.
- Chaloupka et al. (2010) J. c. v. Chaloupka, G. Jackeli, and G. Khaliullin, Phys. Rev. Lett. 105, 027204 (2010), URL http://link.aps.org/doi/10.1103/PhysRevLett.105.027204.
- Choi et al. (2012) S. K. Choi, R. Coldea, A. N. Kolmogorov, T. Lancaster, I. I. Mazin, S. J. Blundell, P. G. Radaelli, Y. Singh, P. Gegenwart, K. R. Choi, et al., Phys. Rev. Lett. 108, 127204 (2012), URL http://link.aps.org/doi/10.1103/PhysRevLett.108.127204.
- Kimchi and You (2011) I. Kimchi and Y.-Z. You, Phys. Rev. B 84, 180407 (2011), URL http://link.aps.org/doi/10.1103/PhysRevB.84.180407.
- Price and Perkins (2012) C. C. Price and N. B. Perkins, Phys. Rev. Lett. 109, 187201 (2012), URL http://link.aps.org/doi/10.1103/PhysRevLett.109.187201.
- Chaloupka et al. (2013) J. c. v. Chaloupka, G. Jackeli, and G. Khaliullin, Phys. Rev. Lett. 110, 097204 (2013), URL http://link.aps.org/doi/10.1103/PhysRevLett.110.097204.
- Kim et al. (2013) H.-S. Kim, C. H. Kim, H. Jeong, H. Jin, and J. Yu, Phys. Rev. B 87, 165117 (2013), URL http://link.aps.org/doi/10.1103/PhysRevB.87.165117.
- Bhattacharjee et al. (2012) S. Bhattacharjee, S.-S. Lee, and Y. B. Kim, New Journal of Physics 14, 073015 (2012), URL http://stacks.iop.org/1367-2630/14/i=7/a=073015.
- Mazin et al. (2012) I. I. Mazin, H. O. Jeschke, K. Foyevtsova, R. Valentí, and D. I. Khomskii, Phys. Rev. Lett. 109, 197201 (2012), URL http://link.aps.org/doi/10.1103/PhysRevLett.109.197201.
- Liu et al. (2011) X. Liu, T. Berlijn, W.-G. Yin, W. Ku, A. Tsvelik, Y.-J. Kim, H. Gretarsson, Y. Singh, P. Gegenwart, and J. P. Hill, Phys. Rev. B 83, 220403 (2011), URL http://link.aps.org/doi/10.1103/PhysRevB.83.220403.
- Ye et al. (2012) F. Ye, S. Chi, H. Cao, B. C. Chakoumakos, J. A. Fernandez-Baca, R. Custelcean, T. F. Qi, O. B. Korneta, and G. Cao, Phys. Rev. B 85, 180403 (2012), URL http://link.aps.org/doi/10.1103/PhysRevB.85.180403.
- Gretarsson et al. (2013) H. Gretarsson, J. P. Clancy, X. Liu, J. P. Hill, E. Bozin, Y. Singh, S. Manni, P. Gegenwart, J. Kim, A. H. Said, et al., Phys. Rev. Lett. 110, 076402 (2013), URL http://link.aps.org/doi/10.1103/PhysRevLett.110.076402.
- Felner and Bradaric (2002) I. Felner and I. Bradaric, Physica B: Condensed Matter 311, 195 (2002), ISSN 0921-4526, URL http://www.sciencedirect.com/science/article/pii/S09214526010%10389.
- Abragam and Bleaney (1970) A. Abragam and B. Bleaney, Electron Paramagnetic Resonance of Transition Ions (Clarendon Press, Oxford, 1970).
- Sheldrick (2008) G. M. Sheldrick, Acta Cryst. 64, 112 (2008).
- Price and Perkins (2013) C. Price and N. B. Perkins, (to appear) (2013), URL http://arxiv.org/abs/1304.7744.
I SUPPLEMENTARY MATERIALS
I.1 Methods
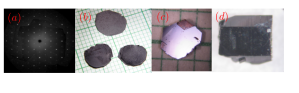
Single crystals of (Na1-xLix)2IrO3 were grown using a self-flux method from off-stoichiometric quantities of IrO2, Na2CO3 and Li2CO3. Similar technical details are described elsewhere Ye et al. (2012). The pure Na2IrO3 crystals have a circular basal area corresponding to the honeycomb plane with diameters of more than 10 mm and thickness 0.1 mm whereas (Na1-xLix)2IrO3 crystals are cylindrical-like with a hexagonal basal plane having diameters of 2 mm and thickness 2 mm (see Fig. 6). The structures of (Na1-xLix)2IrO3 were determined using a Nonius Kappa CCD X-Ray Diffractometer with sample temperature controlled using a nitrogen stream; they were refined by full-matrix least-squares method using the SHELX-97 programs Sheldrick (2008). Chemical compositions of the single crystals were determined using both data of the single-crystal X-Ray diffraction and energy dispersive X-ray analysis (EDX) (Hitachi/Oxford 3000). Electrical resistivity, magnetization and specific heat were measured using a Quantum Design MPMS7 SQUID Magnetometer and a Quantum Design Physical Property Measurement System with 14 T field capability.
I.2 Electrical Resistivity & Other Measurements
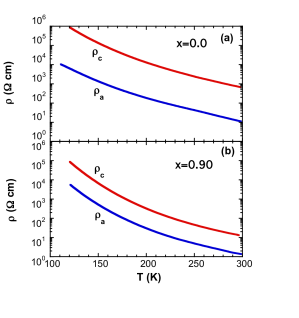
Transport: Although not central to the results we have presented in the main text, we have also done simple transport studies on our samples. The anisotropy in the electrical resistivity is reduced, as shown in Fig. 7. is reduced by one order of magnitude whereas the -axis resistivity remains essentially unchanged when increases from to . The stronger -axis compression clearly facilitates a greater -electron hopping between neighboring hexagons, and this explains the reduced . In contrast, the nearly unchanged suggests that the highly anisotropic Ir-O-Ir hopping within hexagons stays the same despite the shortened - and -axis.
Specific Heat: It deserves to be mentioned that for , an additional anomaly in is discerned at K that is then followed by the zigzag magnetic order at K [Fig. 2 (a)]. This additional anomaly could be an experimental manifestation of a two-phase transition predicated in a finite-temperature phase diagram of the classical Kitaev-Heisenberg model on the hexagonal lattice Price and Perkins (2012, 2013). Between and there lies an intermediate phase with algebraically decaying correlations of the order parameter. is not obviously discernable in for Li doped Na2IrO3.
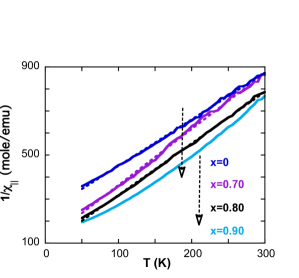
Susceptibility: We include a figure of plotted as vs to show the evolution of the , see Fig. 8. We also show the and for the K-doped sample, Fig. 9.
I.3 Calculation of Curie Constants
Here we provide a quick sketch of the calculation of the Curie constants, in Fig. 5 (a). Starting with Eq. (1), we can diagonlize the Hamiltonian with . Since there are five electrons in total, the topmost Kramers degenerate pair will be singly occupied,
| (2) |
where and the kets on the right are the eigenstates of the form . Calculating the matrix elements of the magnetization operator, in these states, then gives us the effective -factors from which we find,
| (3) |
where is the Curie constant along the direction and is the susceptibility perpendicular to the direction. We note here that the anisotropy of the Curie constants can equivalently be interpreted as arising from the -factor becoming direction dependent (i.e., becoming a -tensor).