Andreev Reflection Like Enhancement Above Bulk in Electron Underdoped Iron Arsenides
Abstract
We use point contact spectroscopy (PCS) to probe the superconducting properties of electron doped () and hole doped . PCS directly probes the low energy density of states via Andreev reflection, revealing two distinct superconducting gaps in both compound families. Apart from the electron underdoped , the excess current due to Andreev reflection for the compounds follows the typical BCS temperature dependence. For underdoped , the temperature dependence of the excess current deviates from that of BCS, developing a tail at higher temperatures and surviving above bulk . Possible explanations for this anomalous behavior are explored.
pacs:
Point contact spectroscopy (PCS) Naidyuk and Yanson proves to be an extremely useful spectroscopic technique for studying conventional and unconventional superconductors since it is sensitive to the magnitude and symmetry of the superconducting order parameter. A point contact junction consists of a nanoscale metallic contact with a superconductor, with transport across the junction dominated by Andreev reflection Andreev (1964). The density of states may be directly extracted from the conductivity using the Blonder-Tinkham-Klapwijk (BTK) model Blonder et al. (1982). PCS was instrumental in determining the precise location of the line nodes for the heavy fermion compound Park et al. (2008), and in providing direct evidence for the multi-gap nature of the superconductor Gonnelli et al. (2002).
A number of research groups have utilized PCS to study the iron based superconductors. The results are well summarized in a recent review article by Daghero et al Daghero et al. (2011). For the and families, measurements on near optimal and overdoped samples have revealed the existence of multiple gaps consistent with s-wave pairing Samuely et al. (2009); Tortello et al. (2010). To our knowledge, no results have been reported for underdoped compounds, which constitute the most fascinating region of the 122 family phase diagram. Underdoped compounds exhibit a coexistence of magnetism and superconductivity at low temperatures Johnston (2010) as well as nematic fluctuations in their normal state Fisher et al. (2011).
In this paper we present Andreev reflection data indicating multiple s-wave superconducting gaps for electron underdoped () and hole underdoped . We also present data on near optimal electron doped () that is in agreement with the published PCS literature.
We fit our lowest temperature data using the extended BTK model with two s-wave superconducting gaps Brinkman et al. (2002). All the point contact junctions show split Andreev peaks and none of the compounds have a maximum at zero bias voltage. This indicates that the superconducting order parameter does not have any nodes and the Fermi surfaces are fully gapped.
We define the superconducting transition by two temperatures: , for when the resistive transition starts, and , for when it falls by 90 of the value at . The electron underdoped compounds show an Andreev reflection-like conductance enhancement between and which we argue most likely arises from inhomogenous doping effects. For the rest of the compounds, the temperature evolution of the excess current due to Andreev reflection appears to follow the standard BCS like behavior and disappears at .
Single crystals of are grown out of FeAs flux Sebastian et al. (2008); Gillett et al. (x = 0.05, 0.055, 0.07, 0.08). crystals are grown in Sn flux Chung et al. . Metallic junctions are formed on freshly cleaved c-axis crystal surfaces and across each junction is measured using a standard four-probe lock-in technique. Junctions are constructed via the soft PCS method Arham et al. (2012).
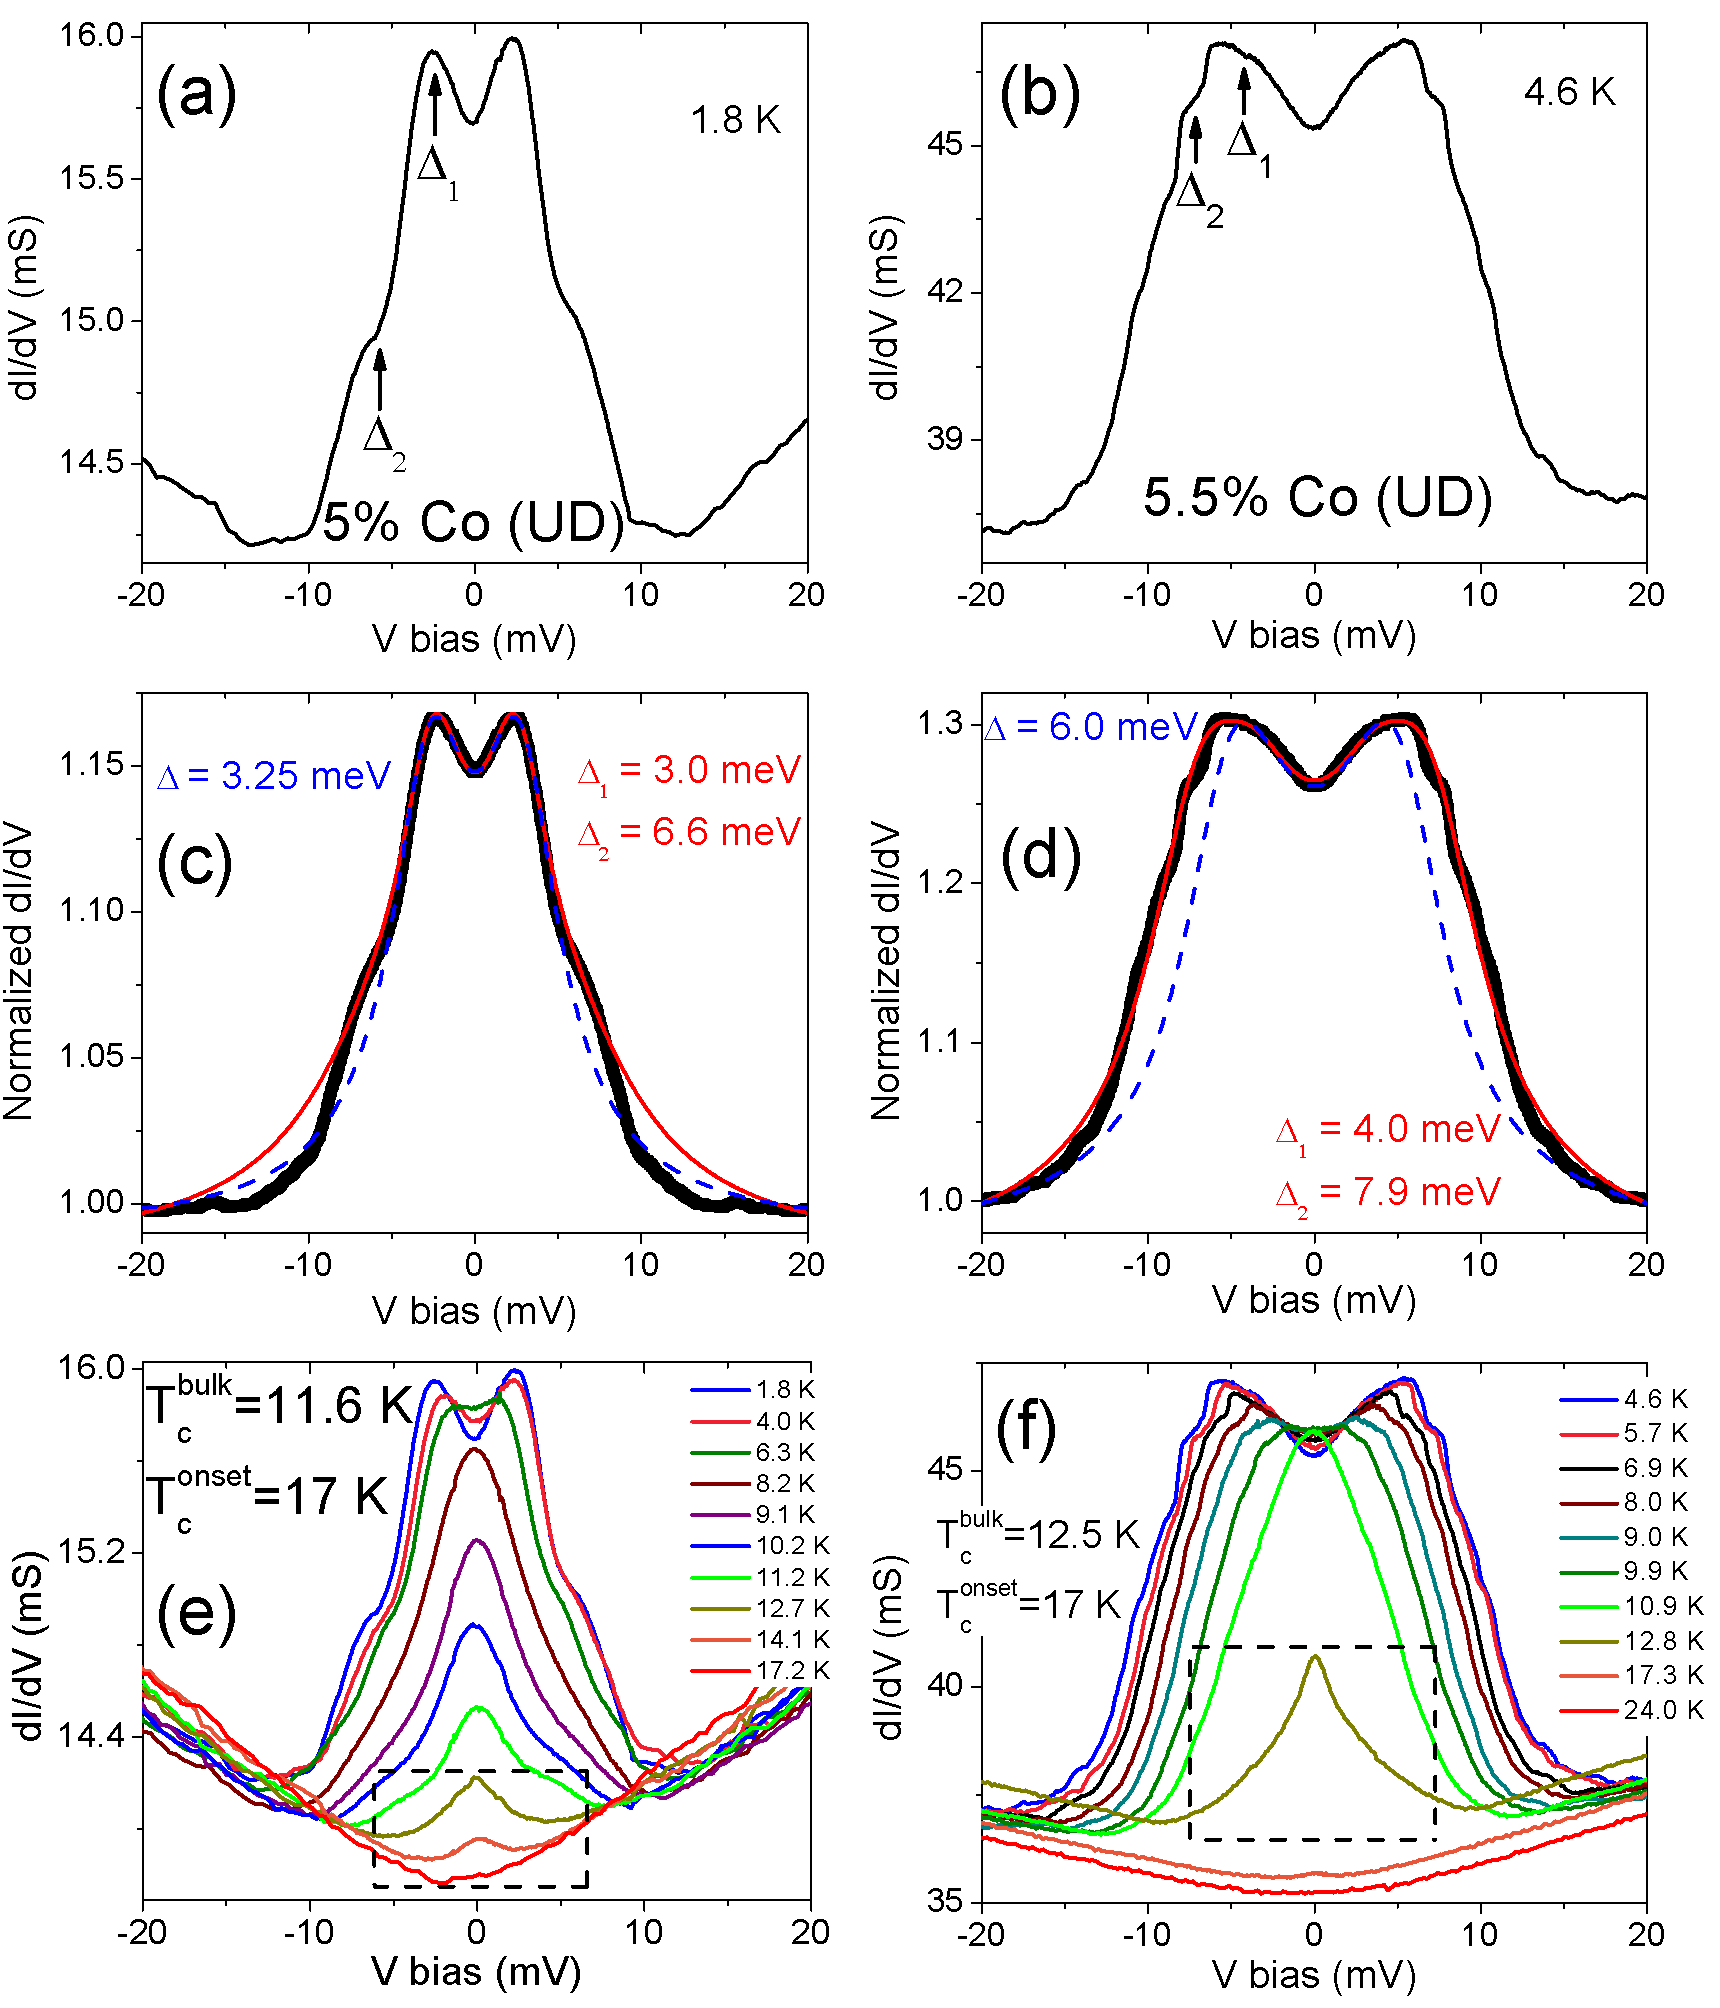
Fig. 1 presents curves for (left column, = 11.6 K, = 17 K) and (right column, = 12.5 K, = 17 K). Fig. 1a and 1b show the raw data at the lowest temperatures attained. The Andreev spectra clearly points to the presence of two superconducting gaps, as indicated with arrows. Fig. 1c and 1d show BTK fits to the normalized data from Fig. 1a and 1b, respectively. The dotted blue line is an isotropic s-wave single band BTK fit. While it provides a good fit to the features corresponding to the smaller gap, it cannot account for the features corresponding to the larger gap. A two band BTK approach, solid red line, is required to accurately describe the experimental data. The parameters in the fit are the two superconducting gaps and , the Dynes lifetime broadening parameter for these gaps and Dynes et al. (1978), the transparency of the junction for each gap and , and the weight of the first gap . (The weight of the second gap becomes ). For the best fits, and are close to each other but not identical. This might be due to the different Fermi velocities for the different Fermi surfaces resulting in unequal effective barrier strengths. The ratio for both gaps are also similar.
The parameters for all our fits are given in Table 1. For meV and meV while for meV and meV. Fig. 1e and 1f show the raw temperature evolution curves of the Andreev spectra for these two junctions. The dashed black rectangle is highlighting the conductance enhancement that is detected between and .
| Crystal | w | ||||||||||
|---|---|---|---|---|---|---|---|---|---|---|---|
| (e UD) | 3.0 meV | 6.6 meV | 0.395 | 0.40 | 0.56 | 0.62 | 0.67 | 17 K | 11.6 K | 78 K | 70 K |
| (e UD) | 4.0 meV | 7.9 meV | 0.31 | 0.35 | 0.25 | 0.30 | 0.10 | 17 K | 12.5 K | 75 K | 63 K |
| (e OD) | 4.0 meV | 7.0 meV | 0.28 | 0.30 | 0.20 | 0.15 | 0.20 | 23 K | 21.7 K | - | - |
| (e OD) | 4.99 meV | 9.95 meV | 0.39 | 0.435 | 0.36 | 0.23 | 0.50 | 25 K | 24.5 K | - | - |
| (h UD) | 2.2 meV | - | 0.373 | - | 0.18 | - | 1 | 26 K | 15 K | 90 K | 90 K |
| (h UD) | 2.7 meV | 7.5 meV | 0.32 | 0.45 | 0.57 | 0.53 | 0.37 | 26 K | 15 K | 90 K | 90 K |
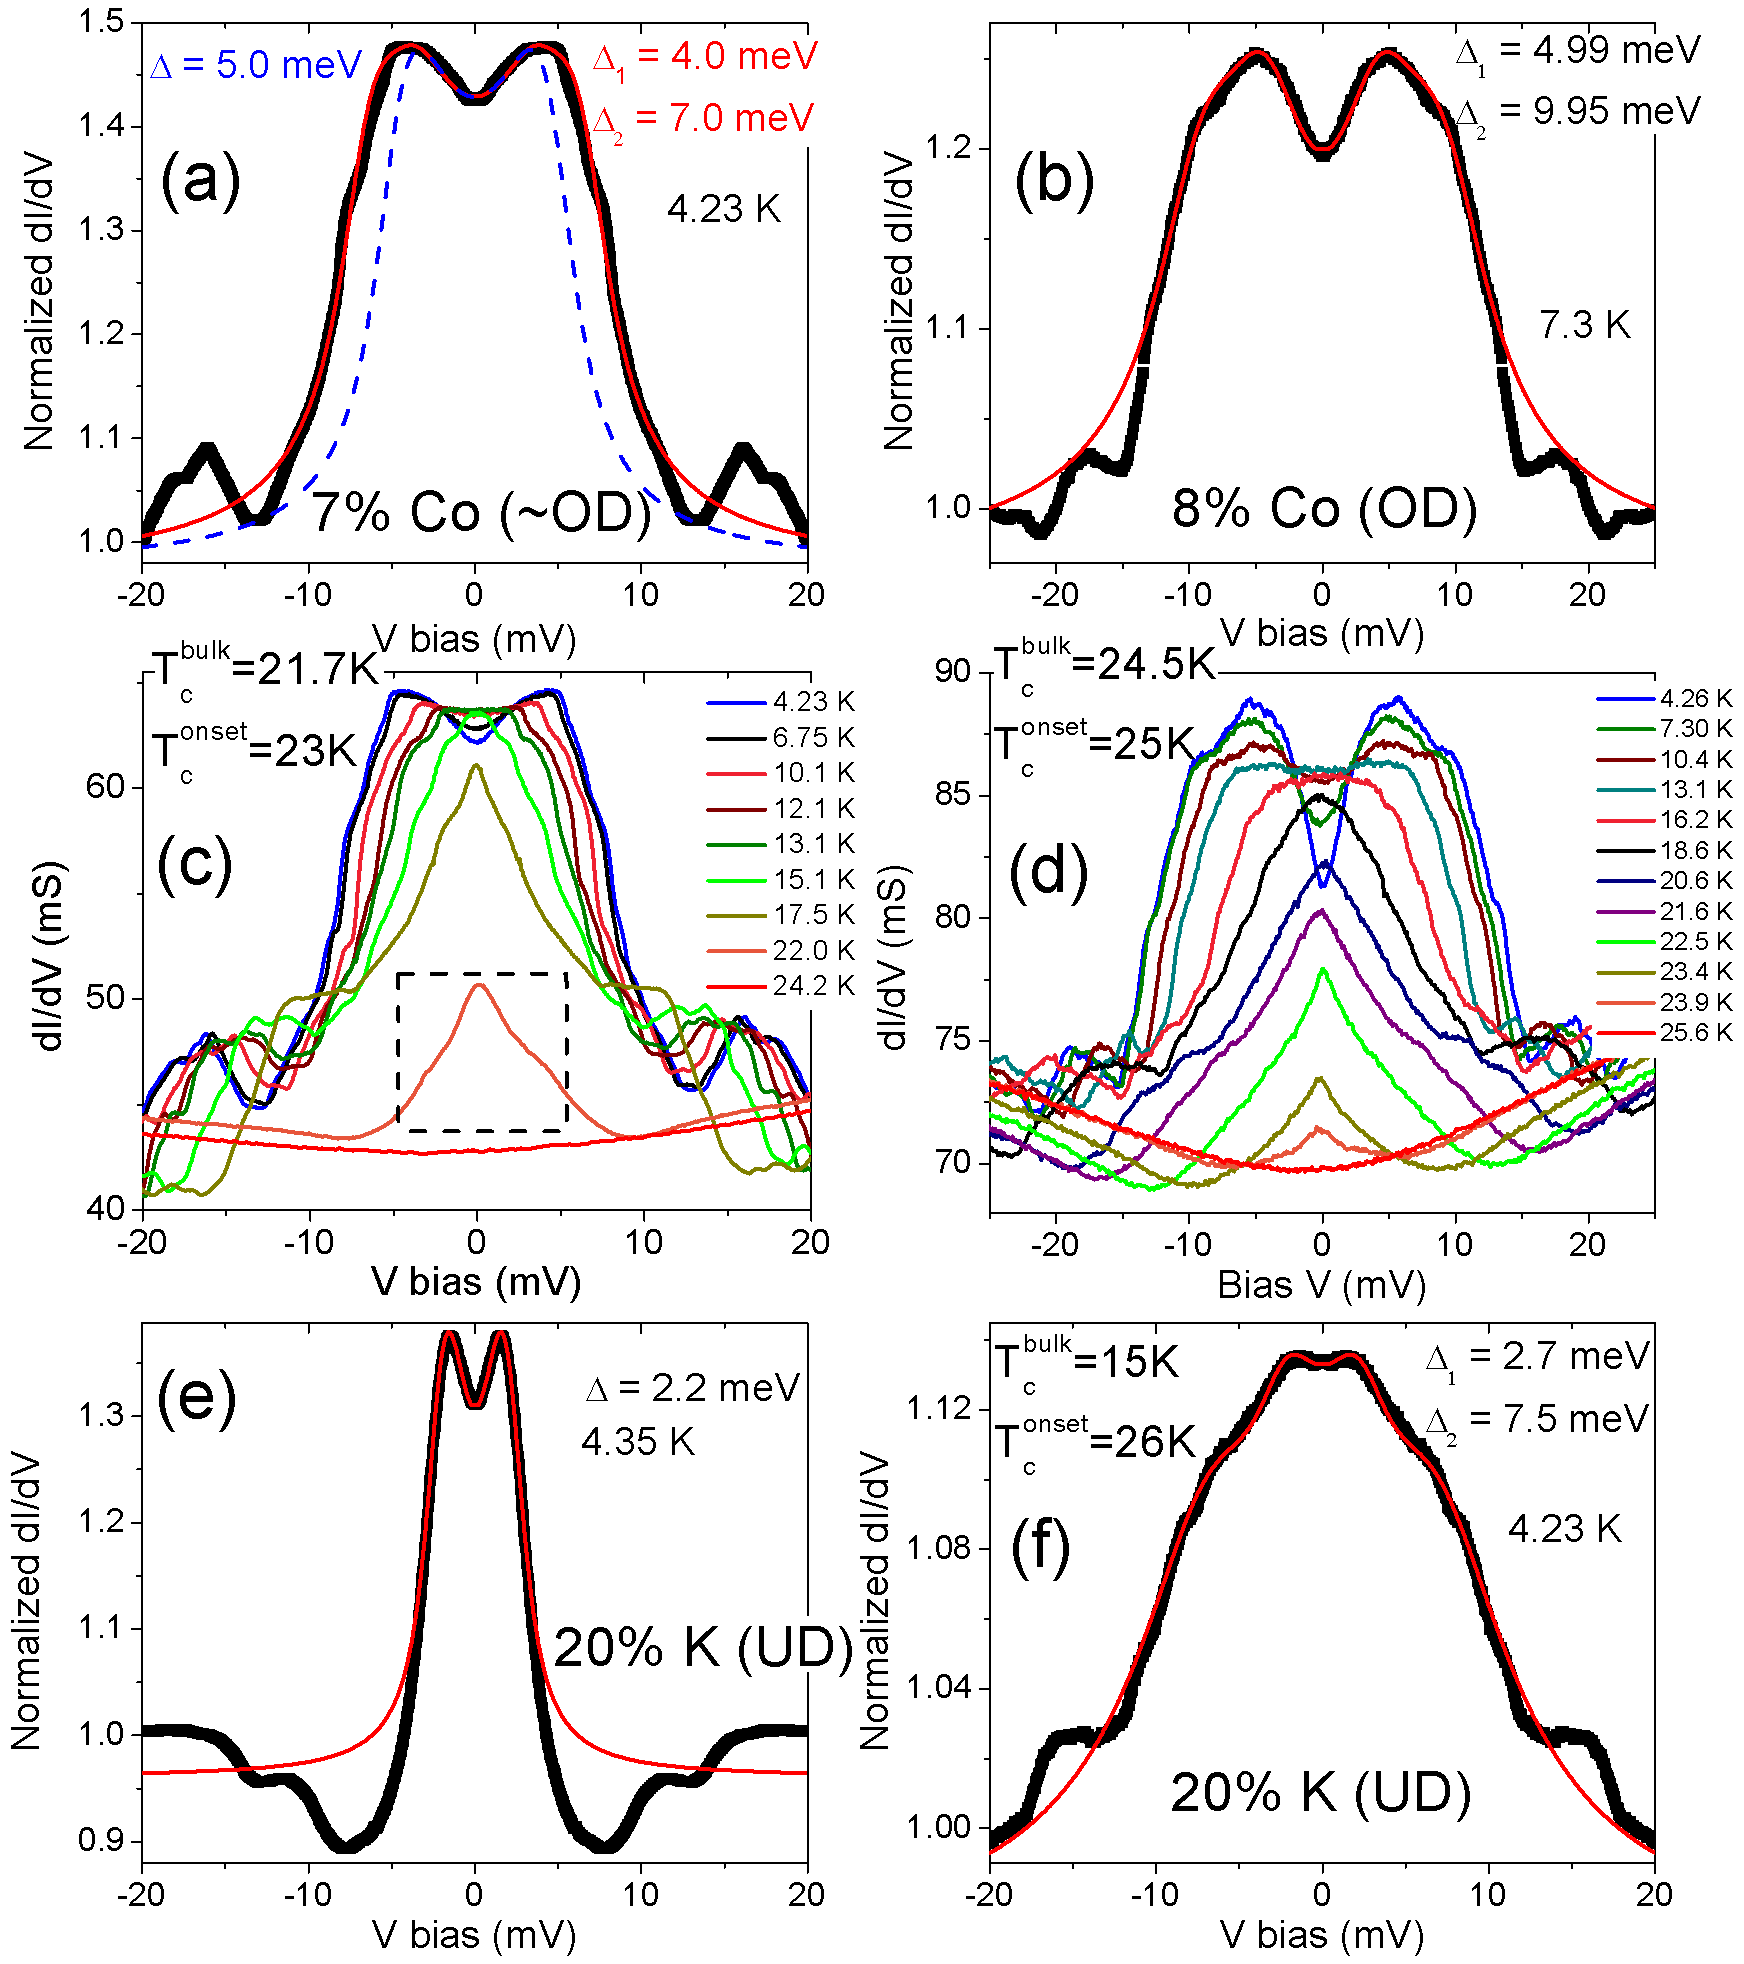
Fig. 2a and c show data and BTK fits for ( = 21.7 K, = 23 K). The two band BTK model (solid red line meV, meV) provides a closer fit to the experimental data shown as opposed to the one band BTK model (dotted blue line). Note here also a conductance enhancement just above .
For ( = 24.5 K, = 25 K) the two band BTK fit (solid red line Fig. 2b) gives meV, meV. Fig. 2d shows the temperature evolution of the Andreev spectra of this junction.
For near optimal doped our gap values are in good agreement with those reported in the literature for PCS Tortello et al. (2010); Daghero et al. (2011), scanning tunneling microscopy Teague et al. (2011), and angle resolved photoemission spectroscopy Terashima et al. (2009).
Fig. 2e and f show for two different junctions on . The superconducting transition is very broad, with = 26 K and = 15 K. Fig. 2e shows the data can be fit with a single superconducting gap ( meV), while Fig. 2f shows clear features corresponding to two superconducting gaps ( meV, meV).
The Fermi surfaces of these compounds are quasi two dimensional sheets with elliptical electron pockets centered at and and near circular hole pockets at the point Basov and Chubukov (2011). For , a small energy gap is observed on hole pocket while nearly equal large energy gaps are found on hole pocket and electron pocket Ding et al. (2008). However, the Fermi surface of is 46 times larger than that of and . It is plausible that on occasion our point contacts pick up the gap only from causing our spectra to be a good fit to the single gap BTK model.
All the fits we have shown in the paper assume isotropic s-wave superconducting gaps. We have also not included any coupling between the two bands in the multi-gap fits. Extensions to the BTK theory have been proposed to incorporate interference and phase difference between the two superconducting bands Golubov et al. (2009); Sperstad et al. (2009). A single band BTK fit has three free parameters (, , ) while an independent two band BTK fit has seven (, , , , , , w). The independent two band BTK model is giving quite good fits to the experimental data, albeit the values of the parameters are somewhat degenerate, the gap sizes can be influenced within 0.5 mV by changing the relative weight of the bands. We have found that adding interference and a phase difference between the bands adds two more free parameters and increase uncertainty in the extracted results without improving fit quality. In the transparent junction (low Z limit) data presented here, the spectra predicted by the independent and interfering band models do not differ greatly. The interfering band models would be useful to differentiate between and symmetry if the barrier strength Z for the same junction could be varied systematically from the metallic to the tunneling regime. However, this is very hard to achieve experimentally.
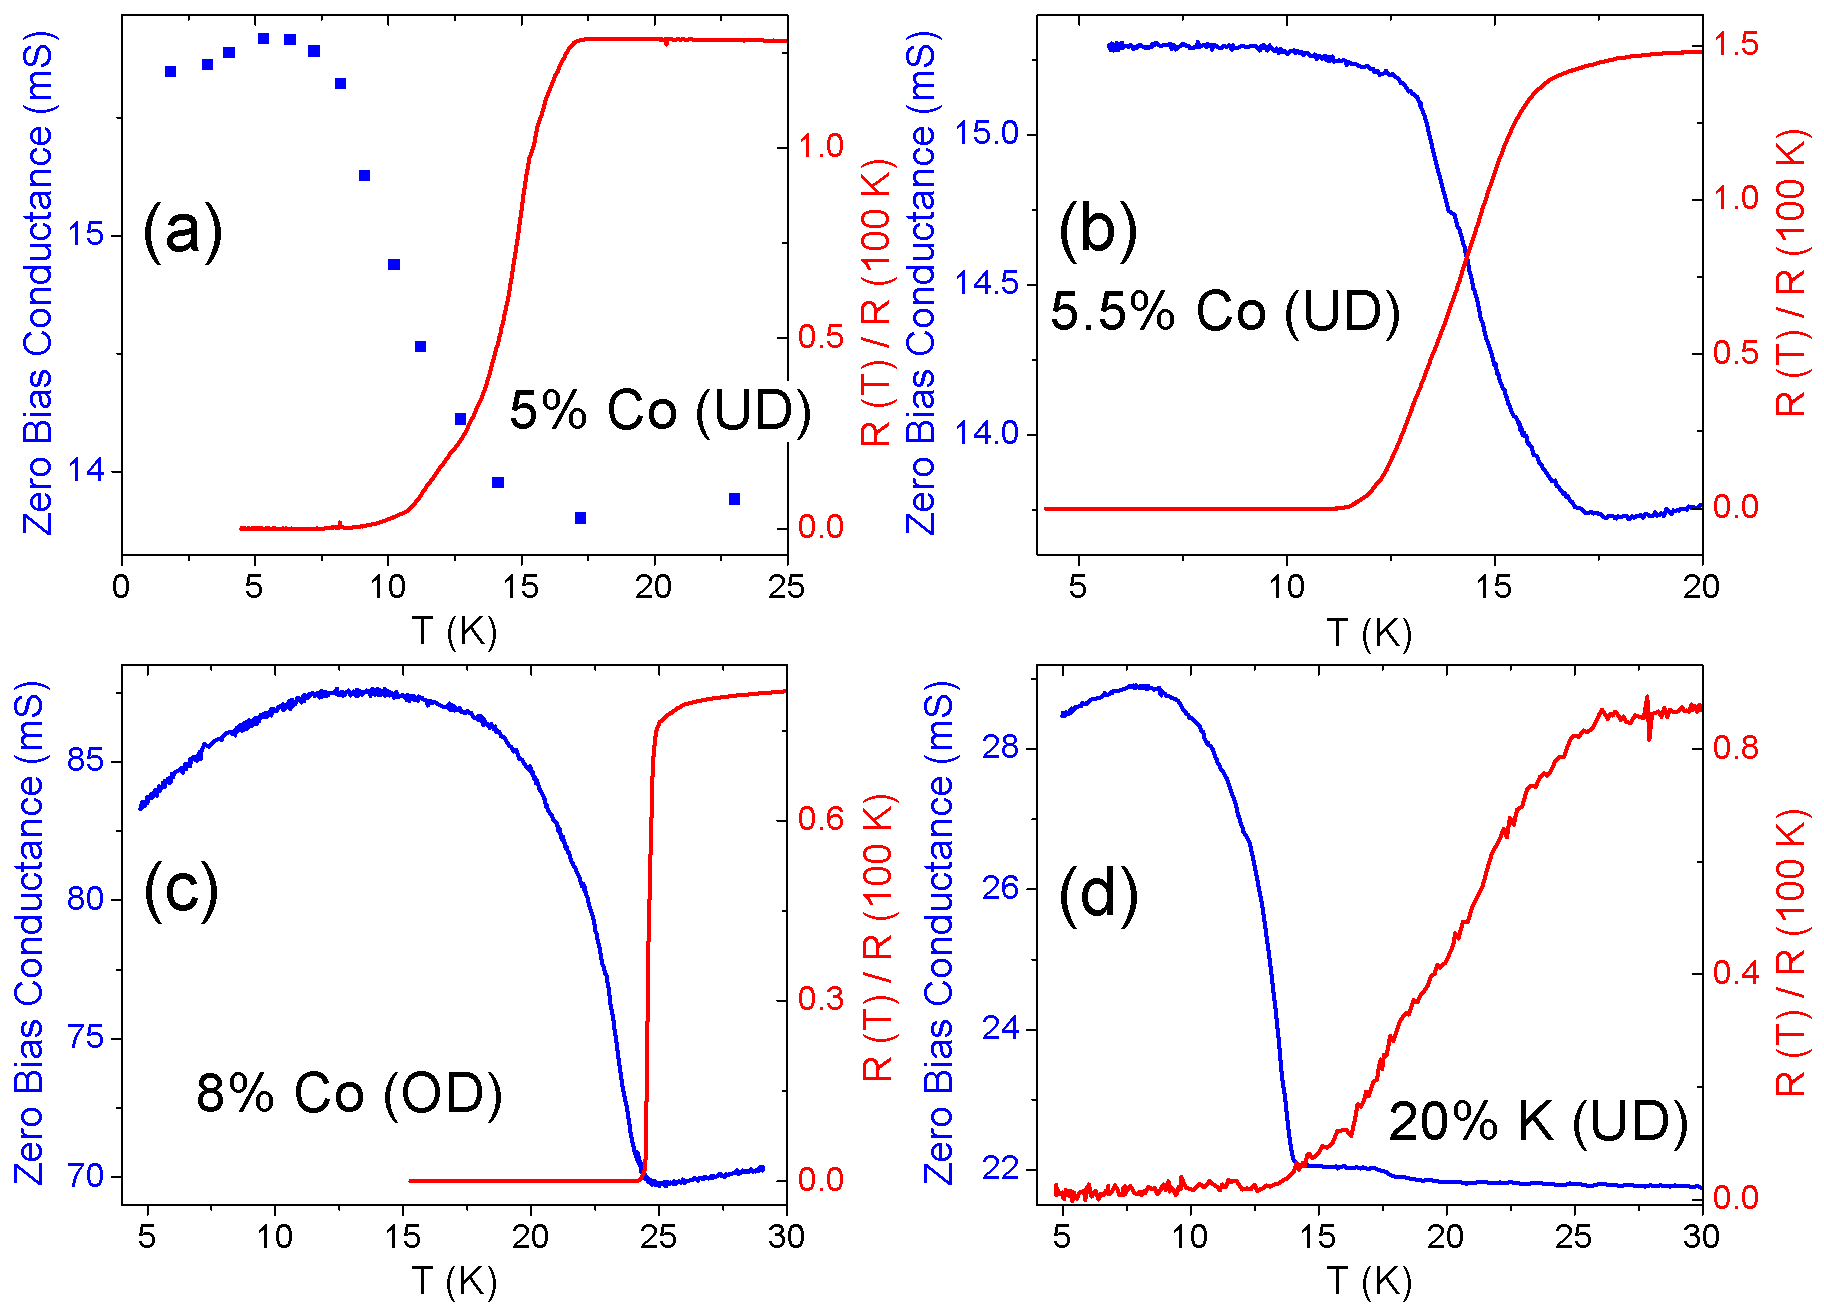
In Fig. 3 we plot the zero bias conductance and bulk resistivity on the same temperature scale for some of our junctions. For underdoped , (Fig. 3a, b), the superconducting transitions are broad and the zero bias conductances of the point contacts start rising near . For the near optimal doped sample, (Fig. 3c), the superconducting transition is narrow. For underdoped , (Fig. 3d), the transition is again broad. However, in this case, the zero bias conductance starts to rise closer to as opposed to .
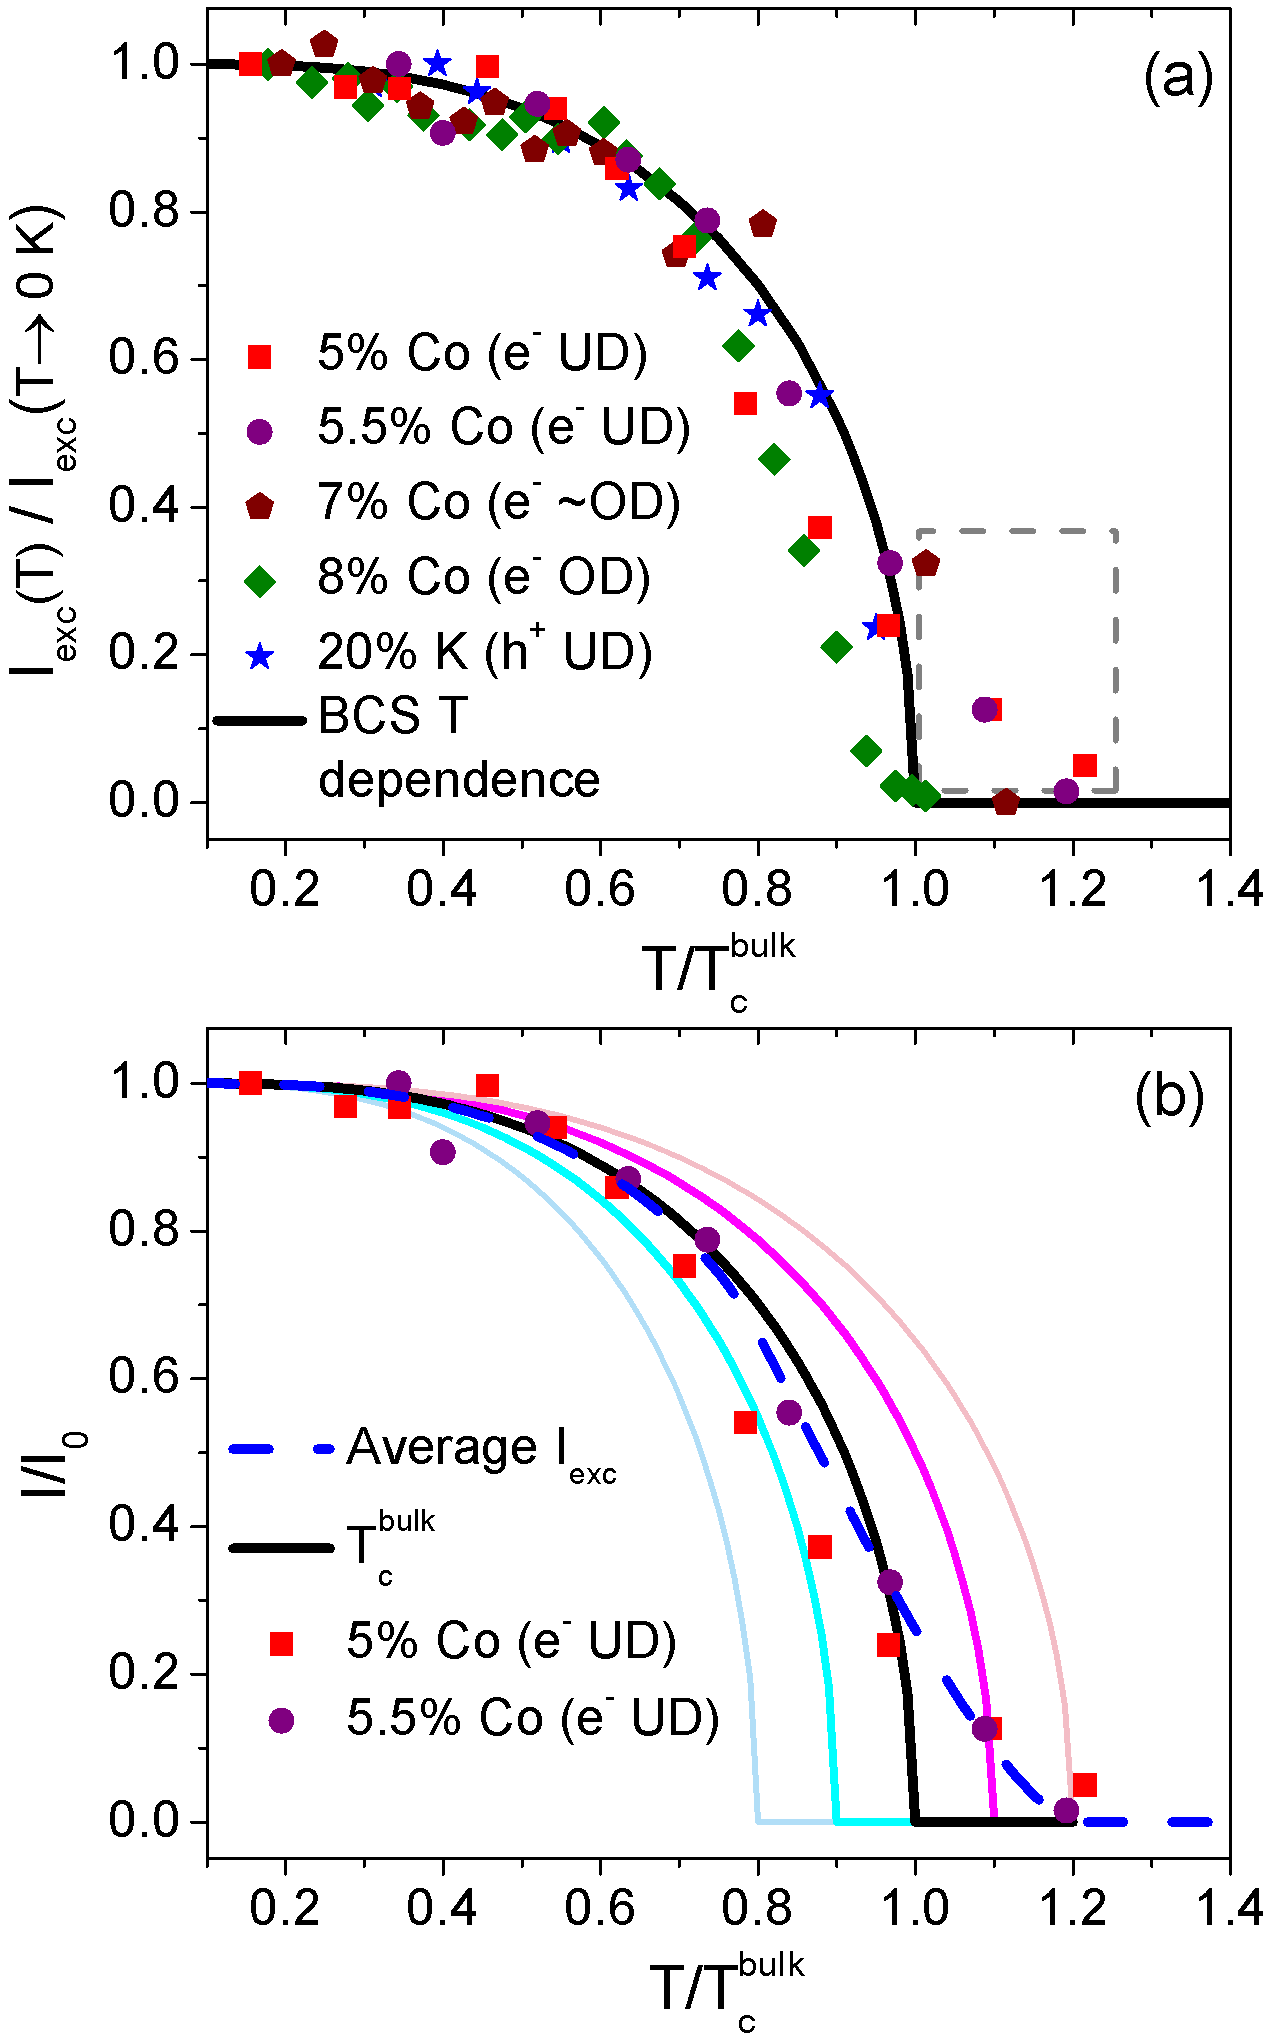
The approximate temperature dependence of the energy gap for weakly coupled s-wave BCS superconductors may be given by . As the temperature is increased, the Andreev reflection signal decreases with a concomitant increase in the thermal broadening in the curves. The gap values extracted by BTK fits develop larger and larger error bars and the smaller gap becomes especially hard to distinguish. Instead of plotting the temperature evolution of the extracted values, we therefore focus on the excess current, , due to Andreev reflection. From the BTK theory Blonder et al. (1982) for s-wave superconductors, has the same temperature dependence as (). We calculate by integrating the normalized curves over Arham et al. . Fig. 4a shows vs. . To compare each doping, we normalize and low temperature to 1. The near optimally doped , and hole underdoped crystals show a reasonable agreement with a BCS temperature dependence.
Analysis of the data taken on the electron underdoped and crystals is more complex. While Andreev spectra on the optimally and hole underdoped crystals exhibit close to , the data on electron underdoped compounds (5 and 5.5 Co doping) exhibit at . The superconducting transition for these crystals is broad; 4.5-5 K. In Fig. 4a the solid black line is the BCS behavior vs. temperature normalized to . Data from (purple circles) follows the fit up to after which remains enhanced up to . (red squares) follows a similar trend.
Microscopic variations in the Co doping may be used to explain why the electron underdoped crystals show above their bulk . Our soft PCS junctions are comprised of multiple point contacts and the conductivity from each adds to give the measured . We assume a Gaussian distribution function for the local of the point contacts centered at Arham et al. and calculate the resulting (Figure 4b). The simulated curve (dashed blue line) reproduces the experimentally observed above quite well. The solid lines are those calcualated for multiple point contacts (with different values) whose weighted sum gives the total .
An alternate explanation is that this enhancement above bulk is due to a novel scattering mechanism. Such scenarios have previously been reported in (spin fluctuations) Park et al. and (phase-incoherent superconducting pairs) Sheet et al. (2010). Data on underdoped crystals show orbital fluctuations in their normal state, while those on optimally doped and crystals do not Arham et al. (2012); Lee and Phillips (2012). Compounds exhibiting orbital fluctuations above the structural phase transition show above .
To conclude, we have presented Andreev reflection PCS data for () and . All junctions are made along the c-axis. Our spectra provide clear evidence for multiple, nodeless, s-wave superconducting gaps. The values of the two gaps may be extracted by using the independent multiband BTK model. Apart from underdoped , the temperature evolution of the excess current for the crystals is well described by the BCS temperature dependence. The excess current for underdoped exhibits excess conductance at higher temperatures that survives above the bulk . The shape of vs. T can be simulated assuming microscopic inhomogeneity in the Co doping in the crystals.
We acknowledge W. K. Park for useful discussions. This work is supported as part of the Center for Emergent Superconductivity, an Energy Frontier Research Center funded by the US Department of Energy, Office of Science, Office of Basic Energy Sciences under Award No. DE-AC0298CH1088. University of Cambridge is supported by EPSRC, Trinity College, the Royal Society and the Commonwealth Trust.
References
- (1) Y. G. Naidyuk and I. K. Yanson, 2005 Point-Contact Spectroscopy (New York: Springer) .
- Andreev (1964) A. F. Andreev, Sov. Phys. JETP 19, 1228 (1964).
- Blonder et al. (1982) G. E. Blonder, M. Tinkham, and T. M. Klapwijk, Phys. Rev. B 25, 4515 (1982).
- Park et al. (2008) W. K. Park, J. L. Sarrao, J. D. Thompson, and L. H. Greene, Phys. Rev. Lett. 100, 177001 (2008).
- Gonnelli et al. (2002) R. S. Gonnelli, D. Daghero, G. A. Ummarino, V. A. Stepanov, J. Jun, S. M. Kazakov, and J. Karpinski, Phys. Rev. Lett. 89, 247004 (2002).
- Daghero et al. (2011) D. Daghero, M. Tortello, G. A. Ummarino, and R. S. Gonnelli, Rep. Prog. Phys. 74, 124509 (2011).
- Samuely et al. (2009) P. Samuely, Z. Pribulova, P. Szabo, G. Pristas, S. L. Bud ko, and P. C. Canfield, Physica C 469, 507 (2009).
- Tortello et al. (2010) M. Tortello, D. Daghero, G. A. Ummarino, V. A. Stepanov, J. Jiang, J. D. Weiss, E. E. Hellstrom, and R. S. Gonnelli, Phys. Rev. Lett. 105, 237002 (2010).
- Johnston (2010) D. C. Johnston, Advances in Physics 59, 803 (2010).
- Fisher et al. (2011) I. R. Fisher, L. Degiorgi, and Z. X. Shen, Rep. Prog. Phys. 74, 124506 (2011).
- Brinkman et al. (2002) A. Brinkman, A. A. Golubov, H. Rogalla, O. V. Dolgov, J. Kortus, Y. Kong, O. Jepsen, and O. K. Andersen, Phys. Rev. B 65, 180517(R) (2002).
- Sebastian et al. (2008) S. E. Sebastian, J. Gillett, N. Harrison, P. H. C. Lau, D. J. Singh, C. H. Mielke, and G. G. Lonzarich, J. Phys.: Cond. Matt. 20, 422203 (2008).
- (13) J. Gillett, S. D. Das, P. Syers, A. K. T. Ming, J. I. Espeso, C. M. Petrone, and S. E. Sebastian, arXiv:1005.1330v1 .
- (14) D. Y. Chung et al., unpublished .
- Arham et al. (2012) H. Z. Arham, C. R. Hunt, W. K. Park, J. Gillett, S. D. Das, S. E. Sebastian, Z. J. Xu, J. S. Wen, Z. W. Lin, Q. Li, G. Gu, A. Thaler, S. Ran, S. L. Bud’ko, P. C. Canfield, D. Y. Chung, M. G. Kanatzidis, and L. H. Greene, Phys. Rev. B 85, 214515 (2012).
- Dynes et al. (1978) R. C. Dynes, V. Narayanamurti, and J. P. Garno, Phys. Rev. Lett. 41, 1509 (1978).
- Teague et al. (2011) M. L. Teague, G. K. Drayna, G. P. Lockhart, P. Cheng, B. Shen, H.-H. Wen, and N.-C. Yeh, Phys. Rev. Lett. 106, 087004 (2011).
- Terashima et al. (2009) K. Terashima, Y. Sekiba, J. H. Bowen, K. Nakayama, T. Kawahara, T. Sato, P. Richard, Y.-M. Xu, L. J. Li, G. H. Cao, Z.-A. Xu, H. Ding, and T. Takahashi, PNAS 106, 7330 (2009).
- Basov and Chubukov (2011) D. N. Basov and A. V. Chubukov, Nature Physics 7, 272 (2011).
- Ding et al. (2008) H. Ding, P. Richard, K. Nakayama, K. Sugawara, T. Arakane, Y. Sekiba, A. Takayama, S. Souma, T. Sato, T. Takahashi, Z. Wang, X. Dai, Z. Fang, G. F. Chen, J. L. Luo, and N. L. Wang, Europhys. Lett. 83, 47001 (2008).
- Golubov et al. (2009) A. A. Golubov, A. Brinkman, Y. Tanaka, I. I. Mazin, and O. V. Dolgov, Phys. Rev. Lett. 103, 077003 (2009).
- Sperstad et al. (2009) I. B. Sperstad, J. Linder, and A. Sudbo, Phys. Rev. B 80, 144507 (2009).
- (23) H. Z. Arham et al., See Supplemental Material at [URL will be inserted by publisher] for discussion on Excess Current Calculation and Inhomogeneous Doping Model .
- (24) W. K. Park, C. R. Hunt, H. Z. Arham, Z. J. Xu, J. S. Wen, Z. W. Lin, Q. Li, G. D. Gu, and L. H. Greene, arXiv:1005.0190 .
- Sheet et al. (2010) G. Sheet, M. Mehta, D. A. Dikin, S. Lee, C. W. Bark, J. Jiang, J. D. Weiss, E. E. Hellstrom, M. S. Rzchowski, C. B. Eom, and V. Chandrasekhar, Phys. Rev. Lett. 105, 167003 (2010).
- Lee and Phillips (2012) W.-C. Lee and P. W. Phillips, Phys. Rev. B 86, 245113 (2012).