∎
22email: binil.aryal@uibk.ac.at 33institutetext: 1R. Pandey 44institutetext: 44email: panduram466@hotmail.com 55institutetext: W. Saurer 66institutetext: Institute of Astrophysics, Innsbruck University
Technikstrasse 25/8, A-6020 Innsbruck, Austria
66email: walter.saurer@uibk.ac.at
A Study of chiral property of field galaxies
Abstract
We present an analysis of the chiral property of 1 621 field galaxies having radial velocity 3 000 km s-1 to 5 000 km s-1. A correlation between the chiral symmetry breaking and the preferred alignment of galaxies in the leading and trailing structural modes is studied using chi-square, auto-correlation and the Fourier tests. We noticed a good agreement between the random alignment of the position angle (PA) distribution and the existence of chirality in both the leading and trailing arm galaxies. Chirality is found stronger for the late-type spirals (Sc, Scd, Sd and Sm) than that of the early-types (Sa, Sab, Sb and Sbc). A significant dominance (17% 8.5%) of trailing modes is noticed in the barred spirals. In addition, chirality of field galaxies is found to remain invariant under the global expansion. The PA-distribution of the total trailing arm galaxies is found to be random, whereas preferred alignment is noticed for the total leading arm galaxies. It is found that the rotation axes of leading arm galaxies tend to be oriented perpendicular the equatorial plane. A random alignment is noticed in the PA-distribution of leading and trailing spirals.
Keywords:
spiral galaxies Hubble sequence chirality clusters: individual (Local Supercluster)1 Introduction
An object that is not superimposable on its mirror image is termed as chiral object. Chiral objects do not show reflection symmetry, but may exhibit rotational symmetry. They are not necessarily asymmetric, because they can have other types of symmetry. An object is achiral (non-chiral) if and only if it has an axis of improper rotation (rotation by 360∘/) followed by a reflection in the plane perpendicular to this axis. Thus, an object is chiral if and only if it lacks such an axis.
Chiral symmetry breaking or restoration is a key ingredient in different problems of theoretical physics: from nonperturbative quantum cromodynamics to highly doped semiconductors (Garcia-Garcia & Cuevas 2006). For a pseudoscalar meson, it is found that the chiral symmetry breaking decreases with increasing current-quark mass (Chang et al. 2007). Bagchi et al. (2006) studied the large color approximation of the compact strange stars and discussed the chiral symmetry restoration. They claimed that the chiral symmetry restoration can be understood by exploring the possible existence of strange stars in the Universe. In principle, microscopic process have triggered huge astrophysical large scale structure (Liddle & Lyth 2000). It is therefore interesting to study the breaking or restoration of chiral symmetry not only in microscopic phenomena (L-neutrino, mesons, L-aminoacids, D-sugars, etc), but also in macroscopic ones (stars, molecular clouds, galaxies). According to the basic concepts of cosmology, initial quantum fluctuations have been hugely enhanced during the inflationary epoch, leading the formation of the large scale structure in the Universe (Peacock 1999, Liddle & Lyth 2000). Thus, the macroscopic chirality should be related to some primordial microscopic process which led to the today’s observed large scale structures (Fall 1982).
Differential rotation in a galaxy’s disc generate density waves in the disc, leading to spiral arms. According to gravitational theory, the spiral arms born as leading and subsequently transform to trailing modes. With the passage of time, the spiral pattern deteriorates gradually by the differential rotation of the equatorial plane of the galaxy, but the bar structure persists for a long time (Oort 1970a). This structure can again regenerate spiral pattern in the outer region. Thus, a close relation between the origin of the arms in the spirals and barred spirals can not be denied (Oort 1970b).
By considering the group of transformations acting on the configuration space, Capozziello & Lattanzi (2006) revealed that the spiral galaxies possesses chiral symmetry in the large scale structure. In addition, they predicted that the progressive loss of chirality might have some connection with the rotationally-supported (spirals, barred spirals) and randomized stellar systems (lenticulars, ellipticals). Aryal, Acharya & Saurer (2007) carried out a study to test the Capozziello and Lattanzi’s (2006) prediction regarding the progressive loss of chirality in the large scale structure. They analysed the distribution of leading and trailing arm galaxies in the Local Supercluster (LSC) and concluded the existence of chiral symmetry for both the spirals and the barred spirals. However, the Virgo cluster galaxies show a preferred alignment: the galactic rotation axes of leading and trailing structures are found to lie in the equatorial plane. Aryal & Saurer (2005a) noticed a preferred alignment for the late-type spirals and barred spirals in the Local Supercluster. In addition, they found that the spin vector projections of early- and late-type galaxies show opposite alignment. Their results hint the existence of the chiral characterization.
In this work, we present an analysis of chiral property of field galaxies having radial velocity (RV) 3 000 km s-1 to 5 000 km s-1. We intend to study the importance of chiral symmetry in order to understand the structural modes of the galaxy. In addition, we expect to study the following: (1) Does chirality exist for the spirals and barred spirals in the field? (2) Is there any correlation between the chirality and preferred alignment of galaxies? (3) Does the group of galaxies exhibit chiral characterization? and finally, (4) What can we say about the chiral and achiral (non-chiral) properties of the large scale structure?
This paper is organized as follows: in Sect. 2 we describe the method of data reduction. In Sect. 3 we give a brief account of the methods and the statistics used. Finally, a discussion of the statistical results and the conclusions are presented in Sects. 4 and 5.
2 The sample: data reduction


The method of data compilation and the identification of the structural modes of the galaxies were the same as in Aryal, Acharya & Saurer (2007). We describe the selection criteria and the data reduction process in brief here. A galaxy had to fulfill the following selection criteria in order to be selected: (1) the RV should lie in the range 3 000 km s-1 to 5 000 km s-1, (2) the morphology should be known, (3) should not be the cluster galaxy, (4) the diameters, magnitude and the position angle should be given and, (5) the arms should be visible.
There were two clusters Abell 0426 ((J2000) = 03h18m 36.4s, (J2000) = +41∘30’54”) and Abell 3627 ((J2000) = 16h15m32.8s, (J2000) = –60∘54’30”) in our region. These clusters have mean RVs 5 366 km s-1 (75 5 Mpc) and 4 881 km s-1 (63 4 Mpc), respectively (Abell, Corwin & Olowin 1989, Struble & Rodd 1999). We removed the galaxies belong to the cluster Abell 0426 using the catalog established by Brunzendorf & Meusinger (1999). For the cluster Abell 3627 galaxies, we used Photometric Atlas of Northern Bright Galaxies (Kodaira, Okamura, & Ichikawa 1990) and Uppsala Galaxy Catalogue (Nilson 1973). There were 174 galaxies belongs to these clusters in our database.
The RVs were compiled from Las Campanas Redshift Survey (Shectman 1996). The PAs and the diameters of galaxies were added from the Uppsala Galaxy Catalogue (Nilson 1973), Uppsala obs. General Catalogue, Addendum (Nilson 1974), Photometric Atlas of Northern Bright Galaxies (Kodaira, Okamura, & Ichikawa 1990), ESO/Uppsala Survey of the European Southern Observatory (Lauberts 1982), Southern Galaxy Catalogue (Corwin et al. 1985) and Third Reference Catalogue of Bright Galaxies (de Vaucouleurs et al. 1991).
In the NED (NASA/IPAC extragalactic database, http: //nedwww.ipac.caltech.edu/), 6 493 galaxies having RVs 3 000 km s-1 to 5 000 km s-1 were listed until the cutoff date (October 2006). The diameters were given for 5 324 (82%) galaxies. Both the diameters and PAs were listed for 3 971 (61%) galaxies. Morphological information was given in the catalogues for 3 276 (50%) galaxies. We inspected the DSS images of 3 276 galaxies using NED and ALADIN2.5 softwares. There were 2 107 (32%) galaxies having distinct spiral arms in our database.
In order to understand true structural modes (leading or trailing) of spiral galaxies, we need to know the direction of the spiral pattern (S- or Z-shaped), the approaching and receding sides and the near and far parts, since galaxies are commonly inclined in space to the line of the sight. The S and Z-patterns can be determined from the image of the galaxy. Similarly, the approaching and receding sides can be defined if spectroscopy data on rotation is available. The third one is fairly hard to established. For this, Pasha (1985) used ‘tilt’ criteria and studied the sense of winding of the arms in 132 spirals. He found 107 spirals to have trailing arm. It should be remembered that the classical ‘tilt’ criteria is based on the visible asymmetry of a dust matter distribution. Now it is well known that the dark matter halo dominates the dynamics of the galaxies throughout. In our own galaxy, the observed rotation of the stars and gas clouds indicates that the visible matter is surrounded by a halo of this dark matter containing the major portion of the total galaxy mass and extending very far beyond the visible matter. The nature of dark matter in the galactic halo of spiral galaxies is still undetermined. Thomasson et al. (1989) studied theoretically and performed -body simulations in order to understand the formation of spiral structures in retrograde galaxy encounters. Interestingly, they noticed the importance of halo mass. They concluded that the spirals having halos with masses larger than the disk mass exhibit leading pattern. Thus, the makeup of galactic haloes is important to cosmology in order to understand the evolution of galaxies.
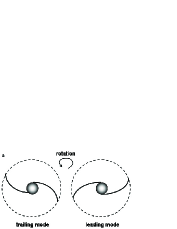
Sugai & Iye (1995) used statistics and studied the winding sense of galaxies (S- and Z-shaped) in 9 825 spirals. No significant dominance from a random distribution is noticed. Aryal & Saurer (2005a) studied the spatial orientations of spin vectors of 4 073 galaxies in the Local Supercluster. No preferred alignment is noticed for the total sample. These results hint that the distribution of angular momentum of galaxies is entirely random in two- (S- and Z-shaped) and three-dimensional (spin vector) analysis provided the database is rich. Thus, choice of rotation (approaching or receding, near or far parts) of individual galaxy might be random for a observer. We used computer and gave random direction to our galaxies. Each galaxy got a virtual direction by the computer. After then, the arm patterns (S- or Z-type) the galaxies were studied visually by one of the authors (PL) in order to maintain homogeneity. The Digitized Sky Survey (DSS) image and the contour maps of the galaxies were studied in order to identify their structural modes. For this, we use MIDAS software. The leading mode is one whose outer tip points towards the direction of galactic rotation (see Fig. 1a). Similarly, the outer tip of trailing mode directs in the direction opposite to the galactic rotation. The re-examination of the arms using IRAF software resulted the rejection of more than 23% of the objects. These rejected galaxies were nearly edge-on galaxies. As expected, it was relatively easier to identify the structural modes of nearly face-on than that of nearly edge-on galaxies.
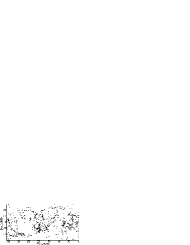
In this way, we compiled a database of 1 621 galaxies showing either leading or trailing structural mode. For individual galaxies, these structural modes might be incorrect. As a gross, it might reveal the results in the subjective sense. There were 807 leading and 821 trailing patterns in our database. All sky distribution of leading and trailing arm galaxies is shown in Fig. 1b. The symbols “” and “” represent the positions of the trailing and the leading arm galaxies, respectively. Several groups and aggregations of the galaxies can be seen in the figure. The inhomogeneous distribution of the positions of the galaxies might be the selection effects for the galaxy orientation study (Aryal & Saurer 2000).
The morphology, radial velocity, axial ratio and the magnitude distributions of leading and the trailing arm field galaxies are shown in Figs. 1c,d,e,f. The spirals (47%) dominate our database in the morphological distribution (Fig. 1c). However, a significant dominance of trailing modes are noticed in the barred spirals whereas a weak dominance of leading modes are found in the spirals. The galaxies in the RV distribution (RV = 5 00 km s-1) were nearly equal (Fig. 1d). The axial ratio distribution shows a good agreement with the expected cosine curve in the limit 0.2 / 0.9 (Fig. 1e). The absolute magnitude lie between 13 and 16 for 82% galaxies in our database (Fig. 1f).
We classified the database into 34 subsamples for both the leading and trailing modes on the basis of the morphology, radial velocity, area and the group of the galaxies. A statistical study of these subsamples are given in Table 1 and discussed in Sect. 3.1.
3 Method of analysis
Basic statistics is used to study the dominance of leading and trailing modes. At first, morphology and RV dependence is studied concerning the chiral property of galaxies. Secondly, sky is divided into 16 equal parts in order to observe the violation of chirality locally. Several galaxy groups are identified in the all-sky map where the structural dominance are noticed. Finally, we study the dominance of leading or trailing arm galaxies in these groups.
We assume isotropic distribution as a theoretical reference and studied the equatorial PA-distribution in the total sample and subsamples. In order to measure the deviation from isotropic distribution we have carried out three statistical tests: chi-square, auto-correlation and the Fourier.
We set the chi-square probability P() = 0.050 as the critical value to discriminate isotropy from anisotropy, this corresponds to a deviation from isotropy at the 2 level (Godlowski 1993). Auto correlation test takes account the correlation between the number of galaxies in adjoining angular bins. We expect, auto correlation coefficient C0 for an isotropic distribution. The critical limit is the standard deviation of the correlation coefficient C.
If the deviation from isotropy is only slowly varying with angles (in our case: PA) the Fourier test can be applied.
A method of expanding a function by expressing it as an infinite series of periodic functions (sine and cosine) is called Fourier series. Let denote the total number of solutions for galaxies in the sample, k the number of solutions in the kth bin, 0 the mean number of solutions per bin, and 0k the expected number of solutions in the kth bin. Then the Fourier series is given by (taking first order Fourier mode),
| (1) |
Here the angle k represents the polar angle in the kth bin. The Fourier coefficients and are the parameters of the distributions. We obtain the following expressions for the Fourier coefficients and ,
| (2) |
| (3) |
The standard deviations (()) and (()) can be estimated using the expressions,
| (4) |
| (5) |
The probability that the amplitude
| (6) |
greater than a certain chosen value is given by the formula
| (7) |
with standard deviation
| (8) |
The Fourier coefficient gives the direction of departure from isotropy. The first order Fourier probability function () estimates whether (smaller value of () or not (higher value of () a pronounced preferred orientation occurs in the sample.
4 Results
First we present the statistical result concerning the distribution of leading and trailing modes of galaxies in the total sample and subsamples. Then, we study the distribution of the leading and trailing arm galaxies in the unit area of the sky and the groups. The equatorial PA-distribution of galaxies in the total sample and subsamples is presented. At the end, a general discussion and a comparison with the previous results will be presented.
4.1 Distribution of leading and trailing structures
A statistical comparison between the total sample and subsamples of the leading and trailing arm field galaxies is given in Table 1. Fig. 2 shows this comparison in the histogram. The (%) in Table 1 and Fig. 2 represent the percentage difference between the number of trailing and leading arm galaxies. We studied the standard deviation () of the major diameters () of galaxies in the total sample and subsamples for both the leading and trailing modes. In Table 1, represents the difference between the standard deviation of the major diameters of leading and the trailing arm galaxies.
An insignificant difference (0.4% 0.2%) between the total number of trailing and the leading arm galaxies are found (Table 1). The difference between the standard deviation of the major diameters () of the trailing and leading arm galaxies is found less than 0.019 (seventh column, Table 1). Interestingly, the sum of the major diameters of total trailing and leading arm galaxies coincide. This result strongly suggests the existence of chirality of field galaxies having RV 3 000 km s-1 to 4 000 km s-1.
In Fig. 2, the slanting-line (grey-shaded) region corrosponds to the region showing 10% (5%) value. Almost all subsamples lie within this region, suggesting the existence of chirality within 10% error limit. We present the distribution of the subsamples of leading and trailing arm galaxies classified according as their morphology, RVs, area and the groups below.
4.1.1 Morphology
In the spirals, leading structural modes are found 3.7% 1.8% more than that of trailing modes. The chirality is found stronger for the late-type spirals (Sc, Scd, Sd and Sm) than that of early-type (Sa, Sab, Sb and Sbc): value turned out to be 9.5% ( 4.8%) and 1.8% ( 1.0%) for early- and late-types (Table 1). Thus, the late-type spirals are the best candidate of the chiral object in our database.


The dominance of trailing structural modes are significant (17% 8.5%) in spiral barred galaxies. The value is found 9% for both early- (SBa, SBab, SBb and SBbc) and late-type (SBc, SBcd, SBd, SBm) barred spirals. Thus, we suspect that the field SB galaxies are not the best candidates of chiral objects. Similar result (i.e., 8%) is found for the irregulars and the morphologically unidentified galaxies.
One interesting similarity is noticed between the late-type spirals and barred spirals. The value for both the late-types are found less than that of early-types (see Table 1). Thus, the chirality is favourable for the late-types rather than the early-types.
The difference between the standard deviation of the major diameters () for trailing and leading arm galaxies is found less than 0.050 arc minute for the total sample, spirals and the late-type spirals (seventh column, Table 1). These samples showed value 5% (grey-shaded region, Fig. 2a). Thus, we found a good correlation between the (%) and value. Probably, this result hints the fact that the size of the non-superimposable mirror images should lie within a limit. In our database, this limit should not exceed 0.050 arc minute for .
The difference between the sum of the major diameters (in percentage) are found greater than 10% for the barred spirals and early-type barred spirals. Interestingly, these two subsamples showed value greater than 15% (Fig. 2a). We suspect that the SB galaxies possess chiral symmetry breaking.
Thus, we found that the chirality between the total leading and trailing arm galaxies exist in our database. This behavior is found prominent for the spirals, mainly for early-type spirals.
4.1.2 Radial velocity
A very good correlation between the number of leading and trailing arm galaxies can be seen in the RV classifications (Fig. 1d). All 4 subsamples show the and value less than 5% and 0.050, respectively (Table 1). In addition, () is found to be 5%. This result is important in the sense that the statistics in these subsamples is rich (number of galaxies 170) enough. Thus, we could not observe the violation of chirality in the low and high RV galaxies in our database.
A difference is noticed: dominance of leading and trailing modes in low (RV1) and high (RV3, RV4) RV subsamples, respectively. However, this dominance is not significant (i.e., 5%). An equal number of leading and trailing arm galaxies are found in the subsample RV2 (3 500 RV (km s-1) 4 000) (Table 1). This might be a coincidence. In order to check the binning effect, we further classify the total galaxies in 6 (RV = 333 km s-1) and 8 bins (RV = 250 km s-1) and study the statistics. No significant dominance of either trailing or leading structural modes are noticed.
Thus, it is found that the chirality of field galaxies remain invariant with the global expansion (i.e, expansion of the Universe). This is an important result. We further discuss this result below.
4.1.3 Area
We study the distribution of leading and trailing arm galaxies by dividing the sky into 16 equal parts (Fig. 3a). The area of the grid (G) is 90∘ 45∘ (RA Dec). The area distribution of leading and trailing arm galaxies are plotted, that can be seen in Fig. 3a’. The statistical parameters are given in Table 1.
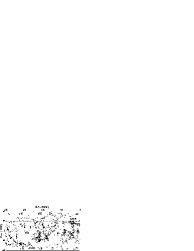


A significant dominance (2) of trailing structures is noticed in grid 3 (RA: 0∘ to 90∘, Dec: 0∘ to 45∘ (J2000)) (Fig. 3a,a’). An elongated subcluster like structure can be seen in this grid. In this grid, , and are found to be 12% 6%, 0.076 and 9.3%, respectively. These figures suggest that the galaxies in G3 lost their chiral property. Probably, this might be due to the apparent subgroupings or subclusterings of the galaxies.
The trailing arm galaxies dominate in the grids G8 and G9 (Fig. 3a’). However, the statistics is poor ( 40) in these grids (Table 1). In addition, no groupings or subclustering are noticed. Thus, we conclude nothing for these area grids.
A dominance (1.5) of leading structures is noticed in G10 (RA: 180∘ to 270∘, Dec: –45∘ to 0∘ (J2000)) and G13 (RA: 270∘ to 360∘, Dec: –90∘ to –45∘ (J2000)) (Fig. 3a,a’). In both the grids, a large aggregation of the galaxies can be seen. A subcluster-like aggregation can be seen in G10. An elongated structure can be seen in G13. In both the grids, value is found to be greater than 5% (Table 1). Thus, we suspect that the galaxies in these grids (G10, G13) are loosing chiral symmetry. This result might reveal the effects of the cluster evolution on chiral symmetry of galaxies.
No dominance of either leading or trailing structures is noticed in the groups G1, G2, G4, G5, G6, G7, G11, G12, G14, G15 and G16. Thus, the chirality is found intact in 80% area of the sky. We suspect that the groupings or subclusterings of the galaxies lead the violation of chirality in the grids G3, G10 and G13. We study the existence of chirality in the groups below.
4.1.4 Galaxy groups
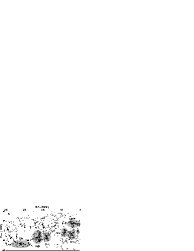
In all-sky map, several groups of galaxies can be seen (Fig. 3a). It is interesting to study the existence of chirality in these groups. For this, we systematically searched for the groups fulfilling following selection criteria: (a) major diameter 30∘, (b) cutoff diameter 2 times the background galaxies, (c) number of galaxies 50. We found 6 groups fulfilling these criteria (Fig. 3b). All 6 groups (Gr) are inspected carefully. In 3 groups (Gr2, Gr5 and Gr6), subgroups can be seen. The number of galaxies in the groups Gr2 and Gr5 are found more than 100.
The clusters Abell 0426 and Abell 3627 are located close to the groups Gr2 and Gr6. The symbol “” represents the cluster center in Fig. 3b. The mean radial velocities of these clusters are 5 366 km s-1 and 4 881 km s-1, respectively. However, we have removed the member galaxies of these clusters from our database.
A significant dominance (2) of trailing structures is noticed in the group Gr2 (Fig. 3b,b’). The , and values are found to be 18.6% 9.4%, 0.097 and 12.6%, respectively (Table 1). These values indicate that the galaxies in this group might lost their chiral symmetry. We suspect that the galaxies in this group is under the influence of the cluster Abell 0426, due to which apparent subclustering of the galaxies can be seen in this group. This subclustering lead the violation of chiral symmetry.
The galaxies in Gr5 shows an opposite preference: a significant dominance of the leading arm galaxies (2) (Fig. 3b,b’). In this group, , and are found to be 11.5% 5.7%, 0.089 and 11.2%, suggesting the violation of chirality (Table 1).
No humps or dips can be seen in the groups Gr1, Gr3, Gr4 and Gr6 (Fig. 3.2b,b’). Thus, the galaxies in these groups show chiral property. It is interesting that the number of galaxies in these groups are less than 100. The groups Gr2 and Gr5, which showed a significant difference between the number of leading and trailing arm galaxies, have a very good statistics (i.e., 100). Thus, we conclude that the large aggregation of the galaxies lead the violation of chirality.
In the group 6, we could not notice the influence of the cluster Abell 3627. This might be due to the off location of the cluster center from the group center.
4.2 Anisotropy in the position angle distribution


We study the equatorial position angle (PA) distribution of trailing and leading arm galaxies in the total sample and the subsamples. A spatially isotropic distribution is assumed in order to examine non-random effects in the PA-distribution. In order to discriminate the deviation from the randomness, we use three statistical tests: chi-square, auto correlation and the Fourier. The bin size was chosen to be 20∘ (9 bins) in all these tests. The statistically poor bins (number of solution 5) are omitted in the analysis. The conditions for anisotropy are the following: the chi-square probability P() 0.050, correlation coefficient / 1, first order Fourier coefficient /) 1 and the first order Fourier probability P()0.150 as used by Godlowski (1993, 1994). Table 2 lists the statistical parameters for the total samples and subsamples.
In the Fourier test, 0 (i.e., negative) indicates an excess of galaxies with the galactic plane parallel to the equatorial plane. In other words, a negative suggests that the rotation axis of galaxies tend to be oriented perpendicular with respect to the equatorial plane. Because the galactic plane is perpendicular to the rotation axis of the galaxy. Similarly, 0 (i.e., positive) indicates that the rotation axis of galaxies tend to lie in the equatorial plane.
In the histograms (see Figs. 4-7), a hump at 90∘45∘ (grey-shaded region) suggests that the galactic planes of galaxies tend to lie in the equatorial plane. In other words, the rotation axes of galaxies tend to be oriented perpendicular with respect to the equatorial plane when there is excess number of solutions in the grey-shaded region in the histograms.
All three statistical tests show isotropy in the total trailing arm galaxies. Thus, no preferred alignment is noticed for the total trailing arm field galaxies (solid circles in Fig. 4a). Interestingly, all three statistical tests show anisotropy in the total leading arm galaxies. The chi-square and Fourier probabilities (P, P()) are found 1.5% ( 5% limit) and 8.5% ( 15% limit), respectively (Table 2). The auto correlation coefficient (C/C()) turned –3.2 (1). The /) value is found to be negative at 2 level, suggesting that the rotation axes of leading arm galaxies tend to be oriented the equatorial plane. Three humps at 50∘ (1.5), 90∘ (2) and 130∘ (1.5) can be seen (Fig. 4a). All these humps lie in the grey-shaded region. We checked the binning biasness in the statistics by increasing the number of bins to 12 and 16. A similar statistical result is found for both structural modes. Fig. 4b shows the PA-distribution histogram for the total sample in 18 bins. The leading arm galaxies show three significant humps in the grey-shaded region, supporting the above mentioned result.
Thus, we conclude isotropy for trailing whereas anisotropy for leading arm galaxies in the total sample.
4.2.1 Morphology
In the spirals, the chi-square and auto correlation tests show isotropy for both the trailing and leading modes. The first order Fourier probability is found greater than 35%, suggesting no preferred alignment. However, the value exceeds 1 limit (–1.2) in the trailing spirals. A hump at 90∘ is not enough to turn the /) 1.5 (Fig. 5a). Similarly, a hump at 150∘ is not enough to make the /) 1.5 in the leading spirals. Hence, the preferred alignment is not profounded in both the leading and trailing spirals. Thus, we conclude a random orientation of trailing and leading arm spirals.


Early- and late-type trailing arm spirals show isotropy in all three statistical tests (Table 2). No humps and the dips are seen in the histograms (solid circles in Fig. 5b,c). Thus, the trailing arm spirals show a random alignment in the PA-distribution. In the subsample SE, all three statistical tests show anisotropy (Table 2). Two significant humps at 150∘ cause the first order Fourier coefficient () +2.5 (hollow circle in Fig. 5b). Thus, a preferred alignment is noticed in the early-type leading arm spirals: the galactic rotation axes tend to lie in the equatorial plane. The late-type leading spirals show a random alignment.
The spiral barred galaxies show a random alignment in both the trailing and leading modes. In Fig. 5d, no deviation from the expected distribution can be seen. All three statistical tests support this result (Table 2). A similar result is found for the early-type SB galaxies in both structural modes (Table 2, Fig. 5e).
The P and P() are found less than 5%, suggesting a preferred alignment for the late-type SB galaxies having trailing arm (Table 2). The auto correlation coefficient (C/C()) and the hump at 150∘ support this result (Fig. 5f). The /) is found to be positive at 1.7 level, suggesting that the trailing arm SBL galaxies tend to lie in the equatorial plane. Thus, the late-type trailing and the leading arm SB galaxies show preferred and random alignments, respectively.
4.2.2 Radial velocity
The subsamples RV1 and RV2 show isotropy in all three statistical tests (Table 2). No humps or dips can be seen in Figs. 6a,b. Thus, the galaxies having radial velocity in the range 3 000 km s-1 to 4 000 km s-1 show a random alignment for both the leading and the trailing structural modes.
The humps at 90∘ (2) and 110∘ (2) are found in the leading and trailing arm RV3 galaxies, respectively (Fig. 6c). These two significant humps lead the subsample show anisotropy in the statistical tests (Table 2). The values are found negative at 1.5 level, suggesting a similar preferred alignment for both modes: the galaxy rotation axes tend to be directed perpendicular to the equatorial plane.


A hump at 70∘ (1.5) and a dip at 150∘ (2) cause the trailing arm RV4 galaxies to show anisotropy in all three statistical tests (Fig. 6d). Thus, the trailing arm galaxies having radial velocity in the range 4 500 km s-1 to 5 000 km s-1 show a similar alignment as shown by the subsample RV3: galactic planes of galaxies tend to lie in the equatorial plane. The leading arm galaxies in the subsample RV4 show a random alignment (Table 2, Fig. 6d).
4.2.3 Groups
We do not study PA-distribution of leading and trailing arm galaxies in the groups Gr1, Gr3, Gr4 and Gr6 because of poor statistics (number 50). Fortunately, a very good correlation between the leading and trailing arm galaxies are noticed in these groups. In other words, we noticed that the chirality is not violated in these groups.
We study the PA-distribution of leading and the trailing arm galaxies in the groups Gr2 and Gr5, where the chiral symmetry seem to be violated. In addition, the statistics is relatively better in these two groups.


In the group Gr2, leading arm galaxies dominate the trailing arm galaxies. In this group, the leading arm galaxies show a preferred alignment whereas trailing arm galaxies show a random alignment in the PA-distribution. All three statistical tests suggest anisotropy in the leading arm galaxies (Table 2). The humps at 150∘ cause the value to be positive at 1.5 level (Fig. 7a), suggesting that the rotation axes of leading arm galaxies in Gr2 tend to be oriented parallel the equatorial plane.
The trailing arm galaxies dominate in the group Gr5. Interestingly, a preferred alignment of trailing arm galaxies is noticed in the PA-distribution. In Fig. 7b, two significant humps at 90∘ (2) and 110∘ (2) can be seen. These humps lead the subsample (trailing Gr5) to show anisotropy in the statistical tests (Table 2). No preferred alignment is noticed in the leading arm galaxies in this group.
Thus, the structural modes (leading or trailing) whose population dominates in the groups show a preferred alignment in the PA-distribution. This is an interesting result.
4.3 Discussion
Fig. 8a shows a comparison between the number () and position angle (/)) distribution of leading and trailing arm galaxies in the total sample and subsamples. This plot deals the possible correlation between the chirality (non-chirality) and the random (preferred) alignment in the subsamples. The grey-shaded region represents the region of isotropy and chirality for the /) and (%), respectively.
Twenty five (out of 39, 64%) subsamples lie in the grey-shaded region (Fig. 8a), suggesting a good agreement between the chiral property and the random alignment of the rotation axes of galaxies. In four subsamples (SE, SBL, Gr2 and Gr5), a good correlation between the preferred alignment and the achiral (i.e., non-chiral) property is noticed (Fig. 8a). Thus, It is found that the random alignment of the PAs of galaxies lead the existence of chiral property of galaxies.

Here we discuss our results with the results obtained by Aryal et al. (2007). Aryal et al. (2007, hereafter Paper 1) compiled a database of 667 leading and trailing arm galaxies in the LSC (RV 3 000 km s-1) and studied the chiral property in the total sample and 17 subsamples. In the present study, the database is compiled from the field galaxies having RV in the range 3 000 to 5 000 km s-1. Thus, we are moving deep inside the sky and studying the existence of chiral property in the present work.
The distribution of the total trailing and leading structures in the LSC (Paper 1) as well as in the field galaxies (present work) are found homogeneous (Fig. 8b). The difference between the leading and trailing arm galaxies are turned well within 5% error limit. This result indicate the fact that the chiral property is a global phenomenon rather than a local phenomenon.
For the spirals, we noticed no deviation from the chirality. However, Paper 1 found a slight deviation because of the presence of the Virgo cluster. Interestingly, we noticed the violation of chirality in the barred spirals (SB) whereas Paper 1 concluded the SB galaxies as a chiral object. For other morphological types (irregulars, morphologically unidentified galaxies), our result is similar to that of the previous result.
In the PA-distribution, we noticed a random alignment for the trailing arm galaxies whereas Paper 1 concludes no preferred alignments for the leading arm galaxies. In this work, a preferred alignment is noticed for the leading arm galaxies. In contrast to this, a preferred alignment for the trailing arm galaxies is concluded in Paper 1. This contradiction is interesting in the sense that the nature of the databases are different in the past (LSC galaxies having RV 3 000 km s-1) and the present (field galaxies having 3 000 RV (km s-1) 5 000) study. The preferred alignment in both the studies are obviously different. For leading arm LSC galaxies, they found that the galactic rotation axes tend to lie in the equatorial plane. In our case, we noticed that the rotation axes of the trailing arm galaxies tend to be oriented perpendicular the equatorial plane.
Paper 1 concludes a similar preferred alignment in the leading and trailing structures in the Virgo cluster galaxies: the galactic rotation axes tend to lie in the equatorial plane. We noticed a similar result for the early-type spirals (leading mode), late-type barred spirals (trailing mode) and the group Gr2 (leading mode).
An important similarity is found in the past and present study: late-type galaxies show chiral property, whereas this property is found to be violated in the early-type galaxies.
In this way, we noticed few inconsistencies in the present and the previous work. It should be remembered that these inconsistencies are profounded either due to the poor statistics or because of the bias in the sample classification.
We combined the database of the Paper 1 and the present work, and studied the basis statistics. A strong chirality ( 1%, 0.010 and 5%) is found in the total and the spiral galaxies. However, the value is found to be greater than 10% for the barred spirals. Thus, the total and the spiral galaxies having RVs less than 5 000 km s-1 strongly exhibit chiral symmetry. It seems that the chirality loss sequence (spiral barred spiral elliptical) as predicted by Capozziello and Lattanzi (2006) might be true.
Aryal & Saurer (2004, 2005b, 2006) and Aryal, Paudel & Saurer (2007) studied the spatial orientation of galaxies in 32 Abell clusters of BM type I (2004), BM type III (2005b), BM type II-III (2006) and BM type II (2007) and found a significant preferred alignment in the late-type cluster (BM type II-III, BM type III). They concluded that the randomness decreases systematically in galaxy alignments from early-type (BM type I, II) to late-type (BM type II-III, III) clusters. Thus, the existance of chirality in BM type I cluster, as predicted by Capozziello and Lattanzi (2006) might be true. Because we noticed a very good correlation between the randomness and the chirality. Probably, this result reveals the fact that the progressive loss of chirality might have some connection with the rotationally supported (spirals, barred spirals) to the randomized (lenticulars, ellipticals) system. Thus, we suspect that the dynamical processes in the cluster evolution (such as late-type clusters) give rise to a dynamical loss of chirality. In other word, a good correlation between the achirality and anisotropy can be suspected for the late-type clusters. It would be interesting to test this prediction by analysing the chiral property of spirals in the late-type clusters in the future.
5 Conclusion
We studied the chiral property of 1 621 field galaxies having radial velocity (RV) in the range 3 000 km s-1 to 5 000 km s-1. The distribution of leading and trailing structural modes is studied in the total sample and 34 subsamples. To examine non-random effects, the equatorial position angle (PA) distribution of galaxies in the total sample and subsamples are studied. In order to discriminate anisotropy from the isotropy we have performed three statistical tests: chi-square, auto-correlation and the Fourier. Our results are as follows:
-
1.
The homogeneous distribution of the total trailing and the total leading arm galaxies is found, suggesting the existence of chiral symmetry in the field galaxies having RVs 3 000 km s-1 to 5 000 km s-1. The PA-distribution of trailing arm galaxies is found to be random, whereas preferred alignment is noticed for leading arm galaxies. It is found that the galactic rotation axes of leading structural modes tend to be oriented perpendicular the equatorial plane.
-
2.
Leading structural modes are found 3.7% 1.8% more than that of the trailing modes in the spirals whereas a significant dominance (17% 8.5%) of trailing modes are noticed in the barred spirals. This difference is found 8% for the irregulars and the morphologically unidentified galaxies. A random alignment is noticed in the PA-distribution of leading and trailing spirals. Thus, it is noticed that the random alignment of the PAs of galaxies lead the existence of chiral property of galaxies. In other words, a good correlation between the preferred alignment and the chiral symmetry breaking is found. This result verifies the previous result (Paper 1).
-
3.
The chirality is found stronger for the late-type spirals (Sc, Scd, Sd and Sm) than that of early-type (Sa, Sab, Sb and Sbc). Similar result is found for the late-type barred spirals. Thus, the late-type galaxies are the best candidates for the chiral objects than that of the early-types.
-
4.
A very good correlation between the number of leading and trailing arm galaxies are found in the RV subsamples. All 4 subsamples show the value less than 5%. Thus, we conclude that the chirality of field galaxies remain invariant with the global expansion.
-
5.
The galaxies having RVs 3 000 km s-1 to 4 000 km s-1 show a random alignment for both the leading and the trailing structural modes. The rotation axes of leading and trailing arm galaxies having 4 000 RV (km s-1) 4 500 tend to be oriented perpendicular the equatorial plane.
-
6.
The galaxies possesses the chiral symmetry in 80% area of the sky. This property is found to be violated in few groups of galaxies. Two such groups (Gr2 and Gr8) are identified. In these groups, the structural dominance and the preferred alignments of galaxies are found to oppose each other.
Aryal et al. (2007) studied the chiral property of the Local Supercluster galaxies (RV 3 000 km s-1). If we include their database, we found a strong ( 1%) chiral behavior by the total and the spiral galaxies. However, the value is found to be greater than 10% for the barred spirals. Hence, the total and the spiral galaxies having RV 5 000 km s-1 show chiral property. Thus, the chirality-loss sequence (spiral barred spiral elliptical) as proposed by Capozziello and Lattanzi (2006) might be true.
The true structural mode of a galaxy must involve a determination of which side of the galaxy is closer to the observer (Binney and Tremaine 1987). Three-dimensional determination of the leading and the trailing arm patterns in the galaxies is a very important problem. We intend to address this problem in the future.
Acknowledgments
This research has made use of the NASA/IPAC Extragalactic Database (NED) which is operated by the Jet Propulsion Laboratory, California Institute of Technology, under contract with the National Aeronautics and Space Administration. We acknowledge Prof. Udayraj Khanal and Prof. Mukunda Mani Aryal for insightful discussions. One author (RP) acknowledge Central Department of Physics, Tribhuvan University, Kirtipur, for providing various forms of support for their masters thesis.
References
- (1) Abell, G.O., Corwin, H.G., Olowin, R.P.: Astrophys. J. Supp. 70, 1 (1989)
- (2) Aryal, B., Paudel, S., Saurer, W.: Astronom. Astrophys. 479, 397 (2008)
- (3) Aryal, B., Acharya, S., Saurer, W.: Astrophys. Space Sci., Bib. Co. tmp.4A, in press (2007)(Paper 1)
- (4) Aryal, B., Saurer, W.: Monthly Notices Royal Astron. Soc. 366, 438 (2006)
- (5) Aryal, B., Saurer, W.: Astronom. Astrophys. 432, 841 (2005a)
- (6) Aryal, B., Saurer, W.: Astronom. Astrophys. 432, 431 (2005b)
- (7) Aryal, B., Saurer, W.: Astronom. Astrophys. 425, 871 (2004)
- (8) Aryal, B., Saurer, W.: Astronom. Astrophys. lett. 364, L97 (2000)
- (9) Bagchi, M. et al.: Astronom. Astrophys. 450, 431 (2006)
- (10) Binney J., Tremaine, S.: Galactic Dynamics, Princeton Univ. press, Princeton, New Jersey (1987)
- (11) Brunzendorf, J., Meusinger H.: Astronom. Astrophys. Supp. Ser. 139, 141 (1999)
- (12) Capozziello, S., Lattanzi, A.: Astrophys. Space Sci. 301, 1-4, 189 (2006)
- (13) Chang, L. et al.: Phy. Rev. C., 75, id015201 (2007)
- (14) Corwin, H.G., de Vaucouleurs, A., de Vaucouleurs, G.: Univ. Texas Monogr. Astron. 4, 1 (1985)
- (15) de Vaucouleurs, G., de Vaucouleurs, A., Corwin, et al.: Third Reference Catalogue of Bright Galaxies, Springer-Verlag, New York (1991)
- (16) Fall, S.M.: in: Progress in Cosmology, Proc. of the Oxford Intl. Symp., Oxford, Dordrecht, D. Reidel Publishing Co., 347-356 (1982)
- (17) Garcia-Garcia, A.M., Cuevas, E.: Phy. Rev. B., 74, id113101 (2006)
- (18) Godlowski, W.: Monthly Notices Royal Astron. Soc. 265, 874 (1993)
- (19) Godlowski, W.: Monthly Notices Royal Astron. Soc. 271, 19 (1994)
- (20) Kodaira, K., Okamura, S., Ichikawa, S.: Photometric Atlas of Northern Bright Galaxies, Univ. of Tokyo Press, Tokyo (1990)
- (21) Lauberts, A.: ESO/Uppsala Survey of the ESO B Atlas, Garching bei Muenchen (1982)
- (22) Liddle, A.R., Lyth, D.H.: Cosmological Inflation and Large-Scale Structure, Cambridge Univ. Press, Cambridge (2000)
- (23) Nilson, P.: Uppsala General Catalogue of Galaxies, Nova Acta Uppsala University, Ser. V:A, Vol.1 (1973)
- (24) Nilson, P.: Upps. Astron. Obs. Rep., 5 (1974)
- (25) Oort, J.H.: Science, 170, 1363 (1970a)
- (26) Oort, J.H.: Astronom. Astrophys., 7, 405 (1970b)
- (27) Peacock, J.A.: Cosmological Physics, Cambridge Univ. Press, Cambridge (1999)
- (28) Pasha, I.I.: Sov. Astron. Lett., 11, 1 (1985)
- (29) Shectman, S.A., Landy, S.D., Oemler, A. et al.: 1996, Astrophys. J. 470, 172 (1996)
- (30) Struble, M.F., Rodd, H.J.: Astrophys. J. Supp. 125, 355 (1999)
- (31) Sugai, H. & Iye, M.: Monthly Notices Royal Astron. Soc. 276, 327 (1995)
- (32) Thomasson, M. et al.: Astronom. Astrophys., 211, 25 (1989)