TEXIVE: Detecting Drivers Using Personal Smart Phones by Leveraging Inertial Sensors
Abstract
In this work, we address a fundamental and critical task of detecting the behavior of driving and texting using smartphones carried by users. We propose, design, and implement TEXIVE that leverages various sensors integrated in the smartphone and realizes our goal of distinguishing drivers and passengers and detecting texting using rich user micro-movements and irregularities that can be detected by sensors in the phone before and during driving and texting. Without relying on external infrastructure, TEXIVE has an advantage of being readily implemented and adopted, while at the same time raising a number of challenges that need to be carefully addressed for achieving a successful detection with good sensitivity, specificity, accuracy, and precision. Our system distinguishes the driver and passengers by detecting whether a user is entering a vehicle or not, inferring which side of the vehicle s/he is entering, reasoning whether the user is siting in front or rear seats, and discovering if a user is texting by fusing multiple evidences collected from accelerometer, magnetometer, and gyroscope sensors. To validate our approach, we conduct extensive experiments with several users on various vehicles and smartphones. Our evaluation results show that TEXIVE has a classification accuracy of 87.18%, and precision of 96.67%.
1 Introduction
Distracted driving diverts driver’s attention away from driving, which will endanger the safety of driver, passenger, and even pedestrian [1]. One recent study indicates that every year, at lease of all motor vehicle crashes or million crashes involve using cell phones and texting [3]. In United States, on a hand-held cell phone while driving is considered illegal in states and the District of Columbia [2, 22], and over states and District of Columbia forbid texting message while driving.
The prevalence of cell phone and severe negative impact of driving and texting on safety have stirred numerous researches and innovations on detecting and preventing the behaviors of driving and texting. The majority effort has been on detecting this behavior using various technologies, such as mounting a camera to monitor the driver [33, 12], relying on acoustic ranging through car speakers [36], or leveraging sensors and cloud computing to determine driver [9]. Another line of innovations is to prevent driver from using phones [31] via signal jammer. Recently, a number of apps have been developed to report driving and texting, e.g., Rode Dog [4]. These apps could not distinguish between the driver and passengers. These techniques have been shown to perform well under various circumstances and assumptions, but not without some limitations, e.g., using extra infrastructures such as cameras or radio interceptor [33, 12, 31], requiring special vehicles (Bluetooth and special layout of speakers [36]), or collaboration of multiple phones in the vehicle and cloud computing [9].
In this work, we address the fundamental and critical task of detecting the behavior of driving and texting by leveraging the smartphones carried by users. Our system leverages various sensors (e.g., accelerometer, gyroscope, magnetometer sensor) integrated in the smartphone and realizes our goal of distinguishing drivers and passengers and detecting texting using rich user micro-movements and irregularities that can be detected by these sensors before and during driving and texting. Our system distinguishes the driver and passengers by performing the following tasks by fusing multiple evidences collected from accelerometer, magnetometer, and gyroscope sensors: 1)detecting whether a user is entering a vehicle or not, 2)inferring which side of the vehicle s/he is entering, 3)reasoning whether the user is siting in front or rear seats, and 4)discovering if a user is texting. Without relying on external infrastructure, our system has an advantage of being readily implemented and adopted, while at the same time raising a number of challenges that need to be carefully addressed for achieving a successful detection with good sensitivity, specificity, accuracy, and precision. A common challenge is to minimize or even remove the negative impact of the inherent noise of the data collected by these sensors. Another challenge is to increase the sensitivity, accuracy, and precision of detection, which is extremely difficult because of the potential pattern similarities among different user activities and the vast possibilities of how a user will drive and text (e.g., how a user will carry the phones, where the user will put the phone, how a user will enter the car, how will a user sit in the car). The third challenge is to design a real-time activity detection and recognition with high accuracy and energy efficiency.
To detect whether a user starts entering a vehicle as a driver, or is doing some other activities (such as walking, siting, or entering a public transportation), we collected the data from accelerometer and magnetometer when users are performing various activities and observed some unique patterns (by converting the signal to the frequency domain using DCT and wavelet). To infer whether a user enters the vehicle from left side or right side of the vehicle, or sits in front or rear seats, we exploit the unique patterns in the accelerometer and magnetometer data observed from respective actions and make cognitive decision based on machine learning techniques. Our system carefully exploits some unique external phenomena: 1) when vehicle engine is started, the data from magnetometer exhibits different patterns when users sit in front or back seats; 2) the accelerometer data experiences different curves when the phone is placed in the front seats and back seats when the vehicle passes through a bump or pothole; 3) the accelerometer data showed different and distinguishable patterns when user enters the vehicle from different sides even the user has the phone in different pockets. To validate our approaches, we conduct extensive experiments of our system with several kinds of vehicles and smartphones. Our evaluation results show that our approach had a classification accuracy of 87.18%, and precision of 96.67%.
The rest of paper is organized as follows. In Section LABEL:sec:related we briefly review the exiting work on distinguishing driver and passengers, and in general activity detection and recognition using inertial sensors. We present the system design in Section LABEL:sec:design by discussing how we tackle several critical tasks for detecting texting by driver. Section LABEL:sec:energy presents the energy consumption strategy of TEXIVE. We report our extensive evaluation in Section LABEL:sec:evaluation and conclude the paper in Section LABEL:sec:conclusion.
2 State of the Art
A number of innovative systems have been proposed and developed in the literature to distinguish between the driver and passenger, or prevent the driver from using the cellphone. The first line of work is to use some external devices to detect whether the driver is distracted or whether the driver is using a phone [36, 30, 10]. Bergasa et al. [7] designed a feasible prototype to detect the driver distraction using special wearable equipment, a circuit equipped with a camera to monitor the driver’s vigilance in real time. Kutila et al. [15] developed another smart human-machine interface to measure the driver’s momentary state by fusing stereo vision and lane tracking data [15]. Although these two systems could detect the driver’s distraction, they do not take the hand held devices into account, and the detection accuracy is approximately on average. Salvucci [29] built a cognitive architecture to predict the effects of in-car interface on driver’s behavior based on cell phone. With the increasing number of accidents caused by using cell phone while driving, many efforts focus on reducing the dangerous driving distraction, but allowing drivers to deal with the devices with less effort, such as Blind Sight [19], Negotiator [34], Quiet Calls [25], and Lindqvist [20]. Most of the aforementioned designs require extra equipments or modifying cars to assist detecting the drivers’ activity, which will increase the system cost and coordination difficulty, or fail to take the presence of hand held smartphones into account.
Other existing solutions for distinguishing driver and passenger rely on specific mechanisms to determine the location of the smartphones. For example, recently, Yang et al. [36] present an innovative method by leveraging the high frequency beeps from smartphone over Bluetooth connection through car’s stereo system, and calculate the relative delay between the signal from speakers to estimate the location of smartphone [36]. However, a possible obstacle to this system is the requirement of using Bluetooth, which may be not available in most old cars as well as new models either. Even with Bluetooth, because of the varying cabin sizes and stereo configurations, the accuracy may be compromised in some extent. Chu et al. [10] presented a phone based sensing system to determine if a user in a moving vehicle is a driver or a passenger without relying on additional wearable sensors or custom instrumentation in the vehicle. They relied on collaboration of multiple phones to process in-car noise and used a back-end cloud service in differentiating the front seat driver from a back seat passenger. Compared with these systems, our system will only use the smartphone carried by the driver and does not require special devices in the car.
Our approaches involve a number of activity detection and recognition using inertial sensors integrated in smartphones, which has been studied for various different purposes [16]. Bao et al. [6] performed activity recognition based on multiple accelerometer sensors, deployed on specific parts of human body, such as wrist, arm, ankle, or thigh. Parkka et al. [26] proposed a system embedded with different wearable sensors to recognize activities. Tapia et al. [32] presented a real-time algorithm to recognize not only physical activities, but also their intensities using five accelerometers and a wireless heart rate monitor. Krishnan et al. [14] demonstrated that putting accelerometers in certain parts is inadequate to identify activities, such as sitting, walking, or running. Mannini et al. [21] introduced multiple machine learning methods to classify human body postures and activities, including lying, sitting, running, and climbing, based on accelerometers attached to certain positions on the body. Lee et al. [18] introduced a novel system to identify user’s location and activities through accelerometer and angular velocity sensor in the pocket, combined with a compass on the waist. Ravi et al. [28] used HP iPAQ to collect acceleration data from sensors wirelessly, and recognize the motion activities. A few studies perform activity detection and recognition using commercial mobile devices [16, 23, 35, 8], which are more practical and unobtrusive. Unfortunately, these systems and approaches cannot be used for distinguishing driver and passenger and detecting driving and texting activities.
3 System Design
To address the driver-passenger challenge, we will leverage the existing inertial sensors integrated in smartphones and exploit some unique and distinguishable patterns observed from a sequence of sensory data. In this section, we discuss in detail design goals, the approach to detect which side a user is entering the car, and which row the user is sitting, for location classification.
3.1 Challenges and Design Goals
The purpose of our system is to distinguish the driver and the passengers using smartphone only without any assistance of dedicated infrastructures or intrusive equipments in the vehicle. The key goal that led to our inertial sensor approach is to be able to determine various activities and classify the phone location from the observed unique and distinguishable micro-movements and sequential patterns. This pure phone software solution, however, leads to several technical challenges:
Robust to Diversity and Ambiguity of Human Activities: The system requires a real-time activity recognition to identify the driver with high accuracy and low delay. For example, when we know that a user is walking towards the car, we should start the algorithm to determine if s/he enters the car or not, and determine if s/he is a driver or passenger. However, because of the difference of smartphone’s orientation, position and location, same user activity may result multiple irregular sensory data. In addition, we need an effective method to detect the starting point and the duration of an activity for the purpose of increasing the accuracy while considering the randomness of action even by the same user. We assume that the behaviors between drivers and passengers are different, especially during the action of entering the vehicle and driving. We need to carefully identify the signal and patterns that can be used for accurate distinguishing.
Robust to Data Noise: It is widely accepted and verified in our testing that the data collected by the inertial sensors in smartphones contain significant noise. If it is not carefully addressed, such noise may override the small changes caused by different human activities.
Computation and Energy Efficiency: As smartphones have limited computation capability and limited energy supply, standard smartphone platforms should be able to execute the system in an online manner with running time of seconds or sub-second. The system will be running at background in carefully selected dynamic duty cycle. Thus we need a careful tradeoffs between efficiency and detection accuracy.
3.2 System Architecture Overview
We now briefly describe the architecture of our system. In this work we propose a three-phase solution to accomplish the task: recognizing the action, locating the user in the vehicle, and determining the role of the user based on assembled information. Figure 1 illustrates various components of our system that will be described in details.
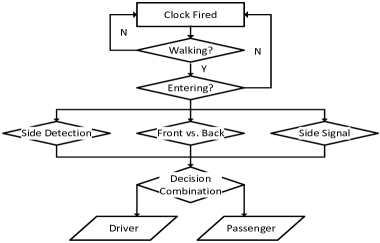
Activity Identification: When driving or sitting in the vehicle, the behaviors are different from most of the other activities in our daily lives. Empirically, such driving activities usually start from walking towards the vehicle, and are followed by entering the vehicle, fastening the seat belt, or even pressing the gear and brake. Thus, walking will be detected periodically, and we looking for the action of entering the vehicle following the detection of the walking action. Notice that our system does not require any interaction from the user, thus, it is critical to find when a user will enter the vehicle so that no driving and texting activity is missed. Generally, most of users get used to carry smartphone for a whole day, the system will definitely record multiple kinds of behaviors throughout one day. A research task here is to identify related activities from a rich set of potential daily activities, including walking, sitting, standing or going upstairs. We observe that most time different activities will be reflected in different micro-movements and motion patterns, although sometimes different activities will have similar “observed” patterns. We will exploit some subtle differences (e.g., the different frequency distribution when converting the time-series data to the frequency domain, the variance of the amplitude of the time-series data) between observed data from various sensors (e.g., accelerometer, magnetometer, and gyroscope) for recognizing driving activity from other activities.
By collecting the daily activities, we study the distribution of activities and temporal and spatial relationship between different activities, and construct a Hidden Markov Model (HMM) [27] to analyze the behavior based on the observed sensory data. This model will then be used to further reduce the energy consumption by carefully adjusting the operating duty-cycle of the system.
Detecting Left vs. Right: The second component of our system is to determine whether a user entered the vehicle from the left side of the vehicle or the right side of the vehicle. If the user is recognized to have entered the vehicle from the right side, taking US as an example, the user must be a passenger usually. But we still cannot judge the role precisely if the user is from the left side. We found that the accelerometer data exhibits different patterns when a user entered the vehicle from different sides and having the smartphone at different pockets.
Detecting Front vs. Back: Detecting the side cannot uniquely identify the driver. Thus, the third phase is proposed to determine whether the user is sitting in the front seats or back seats. Together with the side information, we can determine the location of the phone in a vehicle. Suppose there are one driver seat and three passenger seats in the vehicle. Take US as an example, the user must be the driver if he is sitting in the left side of the front row. Our approach relies on two separate signals. The first signal is the change of magnetic field strength value. Our extensive tests show that when the phone is in the front half of the car, we can see an obvious change in the collected magnetometer data when the vehicle engine is started. The second signal is the change of the accelerometer value based on different road condition. We observed that when a car passing through a bump or a pothole, there are unique and distinguishable patterns when the phone is in the front seats or the back seats. The bump signal, although not guaranteed to happen, can always accurately determine whether the phone is in front seats or rear seats.
Further Improvement: Although these phases provide us some information of the behavior and location of the user in a vehicle, we cannot neglect the issue regarding the identification accuracy. In this work we rely on machine learning process and evidence fusion to further improve the accuracy. For example, when driving, the driver may text in an abnormal patterns, while the passenger, on the other hand, may still follow regular patterns.
To further improve the robustness of our system, we consider the diversity of human activities, e.g., considering the fact that users put their smartphone in different locations according to individual habit [13].
Another issue worth mentioning is that the system will be running at background, and operating the entering-vehicle recognition and side detection in real time, rather than keep recording the sensory data into local buffer and detect the activities through rolling back which is most common way. The strategy is determined based on two main reasons, efficiency and reducing cost.

Suppose the system starts recording the sensory data at time , as shown in Figure 2. At time , the user starts entering a car which lasts . He starts driving after a delay of sitting inside the car. It is common that a user may make a phone call before driving. Once the system detects the driving behavior with detection delay , after users has driven for time . The whole duration of the sequence of actions will last . However, the exact duration of every is unknown and unpredictable, the amount of sensory data which have to be stored in the buffer will be extremely large if we do offline detection. While in our real-time detection system TEXIVE, we can distinguish driver at time without buffering data.
3.3 Inertial Sensors and Data Noise
Suppose the smartphone is carried by the user and placed in a pocket, the motion of a human body is reflected on the motion of smartphone through three inertial sensors (accelerometer, magnetometer, and gyroscope). In our system, the sampling rate is set as , and then a series of changing values on the sensor readings will represent the continuous human activity.
As a rigid body, the readings from sensors only apply to the coordinate of smartphone, which could be denoted as Body Frame Coordinate (BFC). Since the motion condition of smartphone is irregular and unpredictable, without knowing the posture of the phone in the pocket, it is difficult to analyze the human behavior in detail. On the other hand, from the perspective of the earth, individual person may act by following some hidden regular pattern unconsciously, and the only difference may be the frequency, duration and the amplitude of the behavior. In this case, we extract the readings from the sensors, and convert the value into the Earth Frame Coordinate (EFC) to represent the activity.
In addition, in order to reduce the noise coming from both intrinsic mechanical structure and measurement, we adopt a calibrated orientation method through Extended Kalman Filter (EKF).
3.4 Entering Vehicles?
A key challenge of this system is to identify specific activities in real-time, especially determining whether a user will enter a vehicle or is just performing other activities, which have similar observable patterns as that of entering a vehicle. Here we will mainly focus on the analysis of pattern recognition, including the walking and entering the vehicle. The system is running at the background and will capture sensory data from three inertial sensors according to sophisticated duty cycle strategy. Then, the acquired data will be processed and classified into specific activities through specially designed activity recognition method.
Activity Recognition
As the sensors will collect data continuously, a critical step in activity recognition is to identify the starting time and ending time of an activity from a sequence of temporal data collected. The second critical step in activity recognition is an effective feature extraction, which will be the foundation for machine learning based activity recognition. In our system, we adopt Discrete Cosine Transform (DCT) [5] to extract features from linear acceleration to represent the specific action. Although the system mainly focuses on detecting driving activity, the system will also encounter many other activities as it is running in the background with a carefully selected adaptive duty-cycle. For the purpose of driving activity detection and establishing HMM, we classify activities into three categories walking, entering vehicle, and other activities (including sitting, going upstairs, downstairs, or getting on the bus).
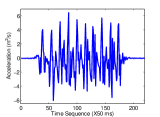
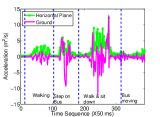
Both the walking behavior and going upstairs or downstairs involve repetitive motions, and the activity pattern could be reflected from the acceleration on the direction of ground, as shown in Figure 3(a)and 3(b). Sitting down is another activity which will be detected multiple times throughout a day, the pattern is illustrated in Figure 3(c). The behavior of getting on the bus is more complicated than the rest, because it consists of multiple other activities and the duration is much longer than the others, as shown in Figure 3(d). However, the patterns of these behaviors are different from each other, and it is not that difficult to distinguish each other. In order to evaluate the performance of the activity recognition, we monitor the behavior for one specific user for one week, and collect multiple cases of sensory data. In our initial test, we collect the activities of walking, sitting down, and going upstairs cases each, and other behaviors, including running, jumping, jogging. In this work, we choose naive Bayesian classifiers [17] to detect and identify activities related to driving. Naive Bayesian classifier could distinguish activities from the other in an acceptable accuracy ().
Our system is carefully designed to meet the requirement of online learning and real-time classifying. It collects the inertial sensory data while triggers the signal when specific activities are detected. It also adjusts the activity model in real-time as new training examples from users are collected. The protocol will adapt the new feature changes over time, train and reconstruct the model as the system being applied to other user.
Entering Vehicles?
We first extract the feature of entering the vehicle by conducting extensive testing. Typically, the activity of getting into the vehicle consists of following steps: walking towards the vehicle, opening the door, turning the body, entering, and sitting down. Empirically, the duration of entering vehicle activity is relatively small. In our system, we set the window size of the sampled data for activity recognition as seconds, which is based on the extensive evaluation to be presented later. We then extract the feature regarding the linear acceleration in both the horizontal plane and ground direction in EFC.
In addition, the behavior will consist of two different cases according to the entering side, and such activity patterns are different. Although the user’s behavior could be reflected through build-in inertial sensors in attached smartphone, we cannot neglect the position where smartphones are put. A recent study [13] indicates that male users usually carry their phones in trouser pockets in most cases () while only put in the upper body pocket. We first study the circumstance that the phone is in the pocket of trousers.
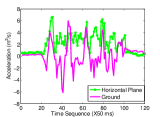
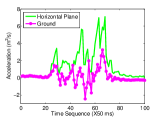
We take a set of testing of entering the vehicle from both sides in the parking lot by a group of colleagues with smartphones under left and right trousers pocket respectively. We collect samples of the entering-vehicle activity from both sides. Due to irregular and unpredictable orientations of the smartphone, we transform all the data from BFC to EFC. Since in EFC, the X and Y axes record the data along the Magnetic North and East, with different orientation of the vehicle, the acceleration in time domain will also be different, which will lead to the mismatch in the following activity recognition process. On the other hand, no matter which orientation the vehicle directs, the activity, from the perspective of the head of vehicle, will still be the same. Thus, we calculate the vector of joint linear acceleration in the horizontal plane by , and present the activity of entering the vehicle in both horizontal plane and ground direction in two cases in Figure 4, where the difference is much more obvious.
Improve the Accuracy
Our initial test consists of cases of behavior of entering vehicle in total, and nearly hundred other behaviors, including walking, sitting down, ascending stairs, descending stairs, and jumping. According to Naive Bayesian classifier, both the accuracy and precision of distinguishing entering vehicle from other actions are and respectively, as shown in Table 1.
| Entering Vehicle | Other activities | |
|---|---|---|
| Test True | 38 | 46 |
| Test False | 3 | 250 |
From the first experiment, although the behavior of entering the vehicle is easily identified through acceleration, a considerable number of other behaviors (sitting down mostly) are also identified as the same activity (the false positive is relatively high), which will hinder the performance of the detection. We discover that there are two main reasons for confusion sitting down with entering vehicle, for one the behaviors are quite similar some times (both may consist of walking, turning and sitting), and the other is that even if the same behavior may result in multiple patterns. In order to overcome such phenomena, we propose a more comprehensive filter to elevate the result accuracy.
We observe that the main difference between regular sitting down and entering the vehicle is the environment: the former more likely happens indoor and the latter is around a vehicle. Such difference on environment happens to provide a key factor to distinguish the scenario, which is the amplitude of magnetic field.
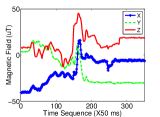
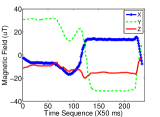
Empirically, when approaching the vehicle, the magnetic field will vary dramatically because of the special material of vehicle and engine. We sample the magnetic field data in three axes for both scenarios, and plot the data in Figure 5. As we could see from the figures, the magnetic field fluctuates as user is approaching the vehicle, and becomes relatively stable when the user sitting in the vehicle. When it comes to the other case, the magnetic field remains relatively stable even if the whole action contains walking and sitting down. Besides, the accelerometer will detect large acceleration when the vehicle starts moving, which could be considered as a supplementary filter. Such method could guarantee the user is in a vehicle. In our system, as long as the sitting action is detected, both the magnetic filter and acceleration filter will be triggered to scan the changing condition of ambient environment, and judge the current scenario.
3.5 Left or Right Side?
The successful detection of entering the vehicle is an initial stage leads to the final driver detection. However, such stage only constrains the location of the user in the vehicle, but we still could not tell on which seat the user is sitting. Then the second stage is to determine which side the user has entered the vehicle as long as the entering behavior is identified, and we denote this step as side detection.
The side detection is based on the observation that the smartphone will experience a different movement when getting on the vehicle from driver side compared with that from passenger side. Although the previous stage has already trained the behavior of getting on vehicle from both sides, the feature extraction according to DCT may consider some cases to be quite similar. In our training stage, we test the behavior of entering vehicle in four different cases with respect to the location of smartphone and side of getting in. Suppose the user is getting in the vehicle from driver side with his smartphone in the right trouser pocket, the motion will lead to a large fluctuation on acceleration and a more small one because of the inner leg entry followed by the other. Here we denote the leg which is close to the vehicle and with smartphone in that pocket as the inner leg. However, looking in to the case of getting on from passenger side with smartphone placed in the left trouser pocket, the observation is much the same. The same thing happens when driver-side-left-pocket case versus right-side-right-pocket case.
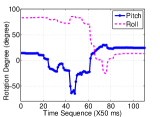
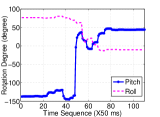
Suppose smartphone is located in the trouser pocket, the orientations are different if we get in vehicle from different sides. We calculate the continuous orientation of smartphone while user entering the vehicle from both driver and passenger sides respectively, and plot the varying of pitch and roll in Figure 6. In addition, the orientation is modified according to Extend Kalman Filter, because of the internal mechanism noise of inertial sensors and the measurement noise. Since the orientation of the vehicle is unknown and unpredictable, we only consider the rotation in Pitch and Roll, which will be affected when stepping into the vehicle. From Figure 6, the vibration difference is obvious, especially when the inner leg is stepping into the vehicle, so that the rotation patterns are different, and the side detection is feasible.
3.6 Front or Back Seats?
The third phase of our system is to solve the front-or-back problem, and by combining with the left-or-right result from the second phase, we can locate the exact position of the smartphone in a vihicle. Actually, useful information that the smartphone can exploit is limited, so it is hard to identify the accurate front-or-back location of a smartphone inside a vehicle. The latest work is based on calculating the distances between smartphone and the speakers through acoustic ranging [36], and the other relies on the sound level of the turning signal [9]. However, the first solution has to handle the issues of the placement of speakers, and the latter needs collaboration between phones and cloud server to do the comparison. In this section, we will introduce two independent approaches (based on changes of magnetic field when engine starts, and changes of accelerometer when vehicle passing through bumps and potholes) to determine whether the smartphone is located in the front row or the back row.
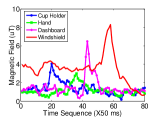
Smartphone is capable of sensing the magnetic field, and the special mechanical structure of the vehicle will affect the surrounding magnetic field. We take a set of further experiments to test the altering condition of magnetic field from walking towards the car to being ready to drive in two different cases, one is sitting on the front row, and the other is sitting on the back row.
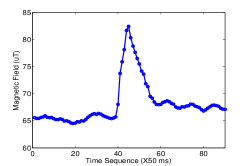
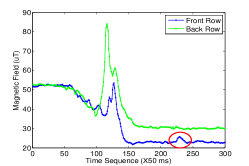
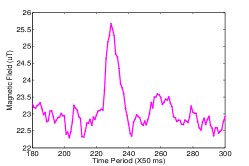
We first put the smartphone on the dashboard, where the place is much closer to the engine, the value of magnetic field is relatively large, around when the engine is off. After we start engine, as shown in Figure 7(a), the value experiences a slight increase to approximately after an obvious spike, which reflects a large fluctuation of the magnetic field at the very moment of engine starts. The sudden spike provides us a good signal to detect whether the engine starts, with the amplitude nearly increased by . However, most of users may put their smartphones in the cup holder or leave them in the pocket, and that signal may not be so obvious because of the increasing distance between the smartphone and the engine. Thus we take another test for both sitting in the front row and the back row to evaluate the difference of the spike. The tests are taken in a continuous period: walk towards the car, open the door, sit down, and start engine. We plot the value of the magnetic field in Figure 7(b). Based on this figure, there are two observations: one is that the level of magnetic field is similar when the user is away from the vehicle, and the other is that the magnetic field in the back row is larger than the front row (which is somewhat counter intuitive). An exciting phenomenon is that even the smartphone is in the cup holder or the trouser pocket, the magnetometer could still sense the variation (red circle) of the magnetic field while the engine starting, but with a smaller amplitude change (around , and the zooming in figure is shown in Figure 7(c)). And we also found that if the smartphone is located on the back seat, it will record nothing. Thus, we exploit the instantaneous magnetic field vibration when the engine starts to determine the rows by fusing the readings from accelerometer. When the vehicle is moving has been indicated, our system will look through the stored data in the buffer, and if the magnetic vibration can be detected, we know that the smartphone is located in the front row with high probability.
Since the system is running according to specific duty cycle, and chances that the mis-detection is possible. Therefore, the second method is now proposed. In both Nericell [24] and Pothole Patrol (P2) [11], researchers use acceleration sensors and GPS deployed on vehicles to detect the pothole and bump on the road. And the pothole and bump will result in significant vertical spikes and dips in acceleration in the gravity direction, and machine learning approach is adopted to identify these.
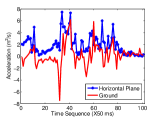
Empirically, when we drive through a bump or a pothole, people sitting in the back row feel more bumpy than those sitting in the front row. We try to use this phenomenon as a smart evidence for detecting front-or-back. We collect a set of data by driving through both bumps and potholes to match the sensory data to the real feeling.
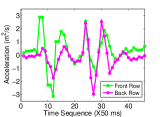
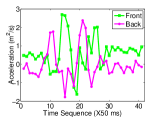
We deploy two smartphones in two passengers, sitting on the front and back row respectively, and sample the acceleration in during the driving. The accelerations are converted into the gross linear acceleration in the horizontal plane, and the ground direction in EFC is in Figure 8. Generally, the smartphone will observe the road condition twice because both front and back wheels will drive through the bump/pothole, and the amplitudes are completely different. Due to the special shape of bump or deceleration strip, one wheel will experience two continuously large vibrations, one is first hitting the bump and jumping to the highest, and the other is hitting the ground after driving through.
When the smartphone is in the front row, the intensity difference between two continuous bumps is relatively small, while in the other case, the difference is much larger. The smartphone could only detect a small jump when the front wheel passes the bump, but the back wheel will make the jump much higher, as shown in Figure 8(a). The pattern is similar when it comes to the pothole as in Figure 8(b). In real scenario, most of the cars will vibrate during driving even if the road is smooth enough. When vehicles drive on a bumpy road, both front and back wheel will experience a sudden drop and then jump or a jump followed by a drop.
3.7 Texting?
While driving, the accident will be more likely to happen when the driver is distracted, such as texting, twittering and composing email. In order to prevent the driving distraction, the second function of the system is to detect texting during driving. Once the endangered behavior is detected, the system could alert the driver or the relatives through network [4].
Generally, typing is not a difficult task when user are fully concentrated, with fewer typo and higher accuracy. While user typing on the smartphone but partly distracted, the time interval between words or letters may last much longer, and the typing accuracy may be much lower, which leads to the two criteria to determine if the user is typing in a normal manner or distracted manner. The criteria of determining whether the user is fully concentrated or distracted from texting depends mainly on the frequency of typing and the probability of typo appears. We conduct a set of experiments by a group of colleagues to compose multiple sentences in the smartphone in both driving and normal condition. Due to the safety issue, the driving scenario is conducted in the parking lot. In this initial experiment, we record both the time interval between consecutive inputs of letter, and the number of letters between two consecutive typos.
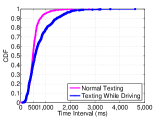
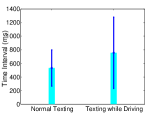
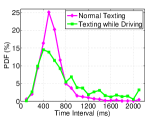
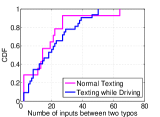
We plot the CDF of both cases in Figure 9(a), and the general statistic information in Figure 9(b). In the normal texting cases, the user usually is fully concentrated so that the typing speed is relatively higher than that of the abnormal cases. Thus about of typing inputs falls within in the former scenario, while the same interval only covers less than inputs in the latter scenario. Based on statistic information, the average time interval is around with Standard Deviation for the normal scenario and the value in the distracted scenario is and respectively. Typing while driving, people usually type one word or phrase, and then pause for a while to watch the road before continue typing, such special behavior leads to the large standard deviation of input interval in the distracted scenario. Such behavior habit also results in the fact that there is still a certain proportion of inputs with interval less than , as shown in the Probability Density Function (PDF) in Figure 9(c). Simultaneously, the amount of typos in the distracted scenario is much larger than the normal scenario. We compute the amount of inputs between two continuous typos, generating from backspace and the CDF is shown in Figure 9(d). Generally, typo appears in approximately every inputs in normal condition, while only inputs in the distracted scenario.
4 Reducing Energy Consumption
The basic strategy adopted by TEXIVE to reduce energy consumption is dynamic sampling according to self-learnt daily routine generated through a close loop. Based on our observation, we notice that users often have to walk to the parking lot or the garage before getting on the vehicle. In addition, most of the users drive at some fixed time everyday. Thus in our strategy, TEXIVE starts with walking detection with different duty cycle (e.g., sample every 5 minutes) according to the commute-time (e.g., at 8AM in morning and 5PM in afternoon). In commute-time, the system will sample historical data and learn when a user will drive in a day. When the current time is close to commute-time , i.e., where is the variance of historical commute-times and is a constant, we will sample data with large frequency, say . In the rest of the time, the system will detect the walking activity with sample frequency times, which is much smaller than .
TEXIVE learns the habit of user, and adjusts the detecting periods automatically based on possibility that a user may start driving. We record the time of each of the behaviors for certain users for a week, including walking, standing, sitting down, driving, ascending stairs, and others. We then model the transition probability between different activities using Hidden Markov Model (HMM) [27] as shown in Figure 10. From statistics of a week data, we calculate the initial probability of each activity as shown in Table 2.

| Behavior | Probability | Behavior | Probability |
|---|---|---|---|
| Walking | 42.25% | Enter Car | 14.08% |
| Stand | 9.86% | Sit Down | 11.27% |
| Stairs | 15.49% | Others | 7.05% |
We then calculate the transition probabilities from one state to another state and found that such probability is as high as among the behavior we detected. We put more emphasis on the sampling strategy during the possible routine driving period, including walking towards the car. Suppose the time duration before entering the car is , and it could be divided into small detecting time slot, denoted as , and the sampling frequency is . Our goal of deciding the sampling strategy is to minimize the overall energy consumption while guarantee the expected behavior miss ratio is less than a threshold . In TEXIVE, we use the following sampling strategy. Assume that the mean time of walking towards the car is and variance is , and we have detected walking activity using HMM. Then we start looking for entering car activity by sampling data and performing detection algorithm with time interval , for .
We then study the energy consumption if we need to use bump and/or pothole signal for driver detection. Suppose the vehicle is driving at a constant velocity, and the bumpy detection is taken in a cycle , where is the duration of detection and denotes the sleep.
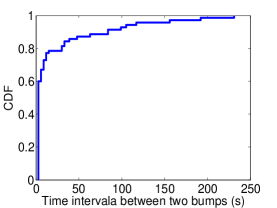
The system will stop checking until the system detects the existence of the bump or pothole. If bumps and potholes follow Poisson Process, the probability of detecting bump or pothole in time interval is: where is a rate parameter. Thus, the probability of successfully detecting the th bump or pothole by the th detecting cycle is: . Suppose the average power for sampling sensory data and running activity recognition in one unit time is , as a result, the total energy consumption under the same circumstance is , where is the time for identifying a bump or pothole in the th sampling. And the overall expected cost is . We test a segment of the road (over miles), containing both local streets and highway. The actual ”bump” measured in our data is not the regular speed bump people experience. We treat any non-smoothy part of a road segment that will cause ”bump-like” behavior as a bump, and record the time interval of driving through a bump or pothole on the street as shown in Figure 11. The figure shows that the probability of a vehicle driving through a bump within seconds is over , so that method is feasible and reliable.
5 Evaluations
In our evaluation, we use both Samsung Galaxy S (Phone ) and Galaxy Note II (Phone ) with Android as the platform. Since the driver detection consists of three steps, and we will evaluate each step separately. The whole process is evaluated on street in Chicago, except the texting part is evaluated in a large parking lot. To study the impact of different users, we also evaluate the system by different users.
5.1 Getting on Vehicle
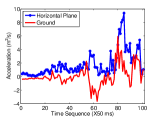
Our initial evaluation is the performance of the activity detection, more specifically, the capability of extracting the behavior of entering vehicles from large amount of activities. We run a week-long experiment to gather the information of user’s behavior regularity, notice that most of our colleagues drive only on commute time. Since the system is running in the background, it will detect multiple activities throughout a day besides entering vehicles. We collected totally behaviors of entering vehicle in both SUV and sedan as well as other activities, and the result of precision, sensitivity, specificity and accuracy are plotted in Figure 12(a).
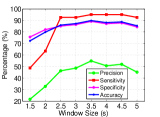
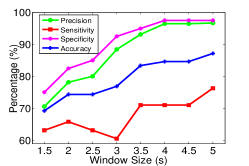
We test the performance in different window size, ranging from to . As it shows in the figure, the performance improves with the increase of window size. When the window size is around to , the results are similar, the sensitivity of both cases are over . It is worth mentioning that the precision in all the cases are not as high as expected, the reason is because the number of difference between true positive and false positive are not large enough. For example, the true positive and false positive of both cases are and respectively. In addition, the specificity of the cases of window size being larger than are close to , and the accuracy is similar. After entering vehicle, the smartphone may sense both momentarily magnetic fluctuation and acceleration fluctuation, which demonstrates the users being in a moving car. According to such idea, we improve our method, and evaluate the performance. Surprisingly, the value of false positive decreases to zero, thus both the precision and specofocoty increases to .
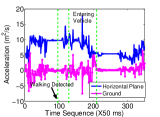
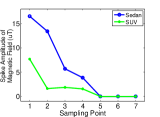
Figure 12(b) shows an illustration of the first signal the system detected according to the protocol. The evaluation is based on the acceleration from the perspective of the earth, with two dimensions, the horizontal plane and ground. The whole serials of activities starts from putting the smartphone in the pocket after making a phone call, and walking towards the door followed by entering. As shown in the figure, the system successfully detects the walking pattern starting from the time stamp, and after nearly seconds, the system senses the first arriving signal of entering ( sampling point). In this evaluation, the window size is , and since the duration of the entering will last approximately to seconds individually, we slide the window with step length . In this case, the system will detect multiple entering behavior, which we will conclude with high probability that the user is entering the vehicle.
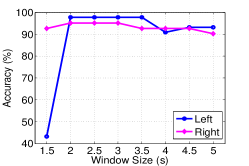
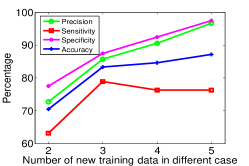
After the behavior is determined, the detection of entering side is followed. We first evaluate the influence brought about by the window size in Figure 13, ranging from to in both learning and testing. For both driver side entering and passenger side entering, the accuracy climbs with the increase of window size, and the accuracy for both left side and right side are around , but the accuracy with the window size only is rather low (Figure 13(a)). Both left and right cases have acceptable accuracy when the window size is around with the accuracy over . Figure 13(b) presents the precision, recall, specificity and accuracy for whole process of side detection. The precision reaches when the window size is , the result still increases while enlarging the window size, and the highest precision is around with window size . The total accuracy is approximately when the window size is set as the largest. We also evaluate the performance of self-adjusting ability for TEXIVE by introducing new data from another user in Figure 13(c). Originally the training data is coming from user , however, such data cannot provide convincing results when detecting the data generated from user . However, with the number of new training data increase, TEXIVE adjusts automatically, and obtains high accuracy, precision and specificity.
5.2 Front vs. Back
Our system presents two independent approaches to handle the front-back classification through engine start signal monitoring and bump road signal detecting. In order to demonstrate the generality of both methods, we organize the experiment in two different cars (a Mazda sedan and a Honda SUV) and multiple positions in the cars where the phone may be put.
As mentioned in the previous section, the embedded magnetometer in smartphone could detect the changing magnetic field when the phone is located in the trouser pocket. However, some users get used to make a phone call or texting while entering the car, and then put in cup holer of under dashboard. Thus our experiments mainly focus on the detection of the engine start signal while the smartphone is held in hand or put in some other possible positions in the car.
In Figure 14(a), we plot the magnetic field changing when the engine starts in four different locations: cup holder, holding in hand, in dashboard and under the windshield (sorted by the distance to the engine). Obviously, the place closest to the engine experiences largest fluctuation in the magnetic varying with the amplitude about , with the distance to the engine increases, the amplitude of the magnetic fluctuation decreases slightly. When the smartphone is held in the hand while sitting or put in the cup holder, the amplitude is only half of the value in the windshield. We also calculate the variance for the magnetic field value in two different conditions, and the value is around , and respectively for in hand, pocket and cup-holder when the engine is off, and approximately , and when the engine starts. Thus, although the magnetic field in the vehicle fluctuates along with the unpredictable motion behavior of the human body, the orientation, position and location of the smartphone, the magnetic field can be considered as a feasible factor to distinguish the front and back.
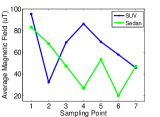
Figure 14(b) shows the magnetic field value in both Mazda sedan and Honda SUV in seven separate sampling locations, and the location numbers indicate the location to the engine in order of increasing distance, i.e., under the windshield, dashboard, the trouser pocket of driver, in cup-holder, back of front seat, back seat, and under the back windshield. Based on the experiment, the value of magnetic field is determined by both the location and position of the smartphone, as well as the placement in the vehicle. The magnetic field is demonstrated to be the largest in both cars under the windshield, and decrease when being put close to the dashboard, where drivers may put their smartphone while driving. Although the readings, as shown, are irregular, we still observed instant spikes at that very moment, as shown in Figure 14(c). The figure indicates that the closer to the engine, the more sensitive the magnetic field variation be, and when put the smartphone in the back seat area, the sensor can hardly detect the changing magnetic field when engine starts, which demonstrates that the spike from engine is trustable.
We then take two separate sets of experiments in both parking lot and local roads to evaluate the efficiency of front-back distinguish using bumps and potholes. There are one deceleration strip and one bump in the parking lot, and we drive through both in ten times in each with different driving speeds. The test results are shown in Table 3, both detections lead to the absolute correctness, bump are all successfully detected in both locations.
| Bump in Front | Bump in Back | |
|---|---|---|
| Test in Front | 20 | 0 |
| Test in Back | 0 | 20 |
When it comes to the street test, the results are slightly different. The experiment is taken in a suburb at night, the total distance is approximately miles with local road and highway. Both the driver and back seat passenger turn on the system to estimate its exact location in the car according to the sensory data while driving. The smartphone of driver detects samples of readings and of bumps and potholes, while the back seat passenger only detects samples but bumps and potholes. The sampling number is different because of the starting time of passenger is behind the driver. In addition, although the number of bumps and potholes being detected by both smartphones are different, both smartphones report they are in the right location with accuracy of .
5.3 Texting Evaluation
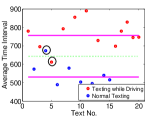
We then detect the regulation of texting to detect if the user is driving or not. We sample different cases with texting in normal condition and the rest in driving condition tested in the parking lot. Each sentence is approximately to words, we collect the input time interval and calculate the average value in real time. In Figure 15, we draw two pink lines, identifying the average time interval of each scenario, and the green dash line in the middle as the standard classifier. All the dots should be separated by the standard classifier, with the blue (normal texting) below and red (texting while driving) in above. The two error classification are denoted in black circle. The evaluation in texting detecting is reliable and feasible, the accuracy is .
5.4 Driver Detection
The decision of driver detection is based on previous sub-processes through evidence fusion. When doing real time recognition, the system slides the window with step to match the stored behavior through naive Bayes classifier. Since the activity could be detected in multiple times because of the sliding window, we consider a continuous same activity recognition to be a successful recognition. And taking the acceleration into account as a filter, the recognition could provide high level of credit for current recognition.
Based on our experiment, we notice that the performance of TEXIVE mainly depends on the first two phases. We test the performance of driver detection based on the fusion of all the phases, the precision is and accuracy . Meanwhile, according to the real evaluation in Android smartphone, the recognition delay is only second.
5.5 Energy Consumption
The energy consumption of the system is determined by the running duration of inertial sensors. Besides, the Android API provides four different level of sampling rates, with the energy consumption being largest ( [37]) in the fastest level, which the sensory data being delivered without any delay. The working strategy of the system is determined based on individual life pattern, more specifically, the behavior regulation.
We take a group of experiments using Galaxy S to test the energy consumption in high density sampling. Without using any inertial sensors, the battery drop within half an hour, but when the inertial sensors are triggered. However, in this process, we reduce the detecting rate to in every one minute with the sensor sampling rate , which on the other hand, match the transition probability of transferring from walking to entering car. Based on the test, the battery reduce only for half an hour. Other existing works utilize GPS to determine whether the user is in driving vehicle. Although such solutions do not require sensors to monitor the behavior and adjust the user habit, the energy consumption from GPS is much larger than sensors. In addition, the system has to open GPS and store sensory data for a certain duration, depending on when the driving behavior is detected. In our experiment, the battery discharge from to for the same testing duration.
6 Conclusion
This paper presented TEXIVE, a smartphone based application to detect driver and texting according to user’s behavior and activity pattern. Our system leverages inertial sensors integrated in smartphone and accomplish the objective of driver-passenger distinguishing without relying any additional equipment. We evaluate each process of the detection, including activity recognition and show that our system achieves good sensitivity, specificity, accuracy and precision, which leads to the high classification accuracy. Through evaluation, the accuracy of successful detection is approximately , and the precision is . The evaluation of TEXIVE is based on the assumption that smartphone is attached to the user body in the trouser pocket most of the time. However, a certain number of users may enter the vehicle while making a phone call or with their smartphones in the hand bag, which in most of the time the activities mentioned above may not be detected precisely sometimes. Although such conditions may bring us a lot difficulties, the system is still demonstrated to be robust in handling the detection through evidence fusion and some side signals.
References
- [1] Distraction. http://www.distraction.gov/.
- [2] Insurance institute for highway safety. http://www.iihs.gov/.
- [3] National highway traffic safety administration (nhtsa). http://www.nhtsa.gov/.
- [4] Rode dog. http://http://www.rodedog.com/.
- [5] Ahmed, N., Natarajan, T., and Rao, K. Discrete cosine transform. Computers, IEEE Transactions on 100, 1 (1974), 90–93.
- [6] Bao, L., and Intille, S. Activity recognition from user-annotated acceleration data. Pervasive Computing (2004), 1–17.
- [7] Bergasa, L., Nuevo, J., Sotelo, M., Barea, R., and Lopez, M. Real-time system for monitoring driver vigilance. Intelligent Transportation Systems, IEEE Transactions on 7, 1 (2006), 63–77.
- [8] Brezmes, T., Gorricho, J., and Cotrina, J. Activity recognition from accelerometer data on a mobile phone. Distributed Computing, Artificial Intelligence, Bioinformatics, Soft Computing, and Ambient Assisted Living (2009), 796–799.
- [9] Chu, H., Raman, V., Shen, J., Choudhury, R., Kansal, A., and Bahl, V. In-vehicle driver detection using mobile phone sensors. In ACM MobiSys (2011).
- [10] Chu, H. L., Raman, V., Shen, J., Choudhury, R. R., Kansal, A., and Bahl, V. Poster: you driving? talk to you later. In MobiSys (2011), ACM, pp. 397–398.
- [11] Eriksson, J., Girod, L., Hull, B., Newton, R., Madden, S., and Balakrishnan, H. The pothole patrol: using a mobile sensor network for road surface monitoring. In ACM MobiSys (2008).
- [12] Herrmann, E., Makrushin, A., Dittmann, J., Vielhauer, C., Langnickel, M., and Kraetzer, C. Hand-movement-based in-vehicle driver/front-seat passenger discrimination for centre console controls. In IS&T/SPIE Electronic Imaging (2010), International Society for Optics and Photonics, pp. 75320U–75320U.
- [13] Ichikawa, F., Chipchase, J., and Grignani, R. Where’s the phone? a study of mobile phone location in public spaces. In MobiSys (2005), ACM, pp. 1–8.
- [14] Krishnan, N., Colbry, D., Juillard, C., and Panchanathan, S. Real time human activity recognition using tri-axial accelerometers. In Sensors, signals and information processing workshop (2008).
- [15] Kutila, M., Jokela, M., Markkula, G., and Rue, M. Driver distraction detection with a camera vision system. In ICIP (2007), vol. 6, IEEE, pp. VI–201.
- [16] Kwapisz, J., Weiss, G., and Moore, S. Activity recognition using cell phone accelerometers. ACM SIGKDD 12, 2 (2011), 74–82.
- [17] Langley, P., Iba, W., and Thompson, K. An analysis of bayesian classifiers. In AAAI (1992), pp. 223–223.
- [18] Lee, S., and Mase, K. Activity and location recognition using wearable sensors. Pervasive Computing, IEEE 1, 3 (2002), 24–32.
- [19] Li, K., Baudisch, P., and Hinckley, K. Blindsight: eyes-free access to mobile phones. In SIGCHI (2008), ACM, pp. 1389–1398.
- [20] Lindqvist, J., and Hong, J. Undistracted driving: A mobile phone that doesn’t distract. In ACM HotMobile (2011), ACM, pp. 70–75.
- [21] Mannini, A., and Sabatini, A. Machine learning methods for classifying human physical activity from on-body accelerometers. Sensors 10, 2 (2010), 1154–1175.
- [22] McCartt, A., Hellinga, L., and Bratiman, K. Cell phones and driving: review of research. Traffic Injury Prevention 7, 2 (2006), 89–106.
- [23] Miluzzo, E., Lane, N., Fodor, K., Peterson, R., Lu, H., Musolesi, M., Eisenman, S., Zheng, X., and Campbell, A. Sensing meets mobile social networks: the design, implementation and evaluation of the cenceme application. In SenSys (2008), ACM, pp. 337–350.
- [24] Mohan, P., Padmanabhan, V., and Ramjee, R. Nericell: rich monitoring of road and traffic conditions using mobile smartphones. In SenSys (2008), ACM, pp. 323–336.
- [25] Nelson, L., Bly, S., and Sokoler, T. Quiet calls: talking silently on mobile phones.
- [26] Parkka, J., Ermes, M., Korpipaa, P., Mantyjarvi, J., Peltola, J., and Korhonen, I. Activity classification using realistic data from wearable sensors. Information Technology in Biomedicine, IEEE Transactions on 10, 1 (2006), 119–128.
- [27] Rabiner, L., and Juang, B. An introduction to hidden markov models. ASSP Magazine, IEEE 3, 1 (1986), 4–16.
- [28] Ravi, N., Dandekar, N., Mysore, P., and Littman, M. Activity recognition from accelerometer data. In Proceedings of the national conference on artificial intelligence (2005), vol. 20, p. 1541.
- [29] Salvucci, D. Predicting the effects of in-car interfaces on driver behavior using a cognitive architecture. In SIGCHI (2001), ACM, pp. 120–127.
- [30] Sathyanarayana, A., Nageswaren, S., Ghasemzadeh, H., Jafari, R., and Hansen, J. H. Body sensor networks for driver distraction identification. In ICVES (2008), IEEE, pp. 120–125.
- [31] Shabeer, H. A., and Wahidabanu, R. A unified hardware/software approach to prevent mobile phone distraction. European Journal of Scientific Research 73, 2 (2012), 221–234.
- [32] Tapia, E., Intille, S., Haskell, W., Larson, K., Wright, J., King, A., and Friedman, R. Real-time recognition of physical activities and their intensities using wireless accelerometers and a heart rate monitor. In ISWC (2007), pp. 37–40.
- [33] Wahlstrom, E., Masoud, O., and Papanikolopoulos, N. Vision-based methods for driver monitoring. In Intelligent Transportation Systems (2003), vol. 2, IEEE, pp. 903–908.
- [34] Wiberg, M., and Whittaker, S. Managing availability: Supporting lightweight negotiations to handle interruptions. ACM TOCHI 12, 4 (2005), 356–387.
- [35] Yang, J. Toward physical activity diary: motion recognition using simple acceleration features with mobile phones. In IMCE (2009), ACM, pp. 1–10.
- [36] Yang, J., Sidhom, S., Chandrasekaran, G., Vu, T., Liu, H., Cecan, N., Chen, Y., Gruteser, M., and Martin, R. Detecting driver phone use leveraging car speakers. In MobiCom (2011), ACM, pp. 97–108.
- [37] Youssef, M., Yosef, M., and El-Derini, M. Gac: energy-efficient hybrid gps-accelerometer-compass gsm localization. In GLOBECOM (2010), IEEE, pp. 1–5.