The NuSTAR Extragalactic Survey:
A First Sensitive Look at the High-Energy Cosmic X-ray Background Population
Abstract
We report on the first ten identifications of sources serendipitously detected by the Nuclear Spectroscopic Telescope Array (NuSTAR) to provide the first sensitive census of the cosmic X-ray background (CXB) source population at keV. We find that these NuSTAR-detected sources are 100 times fainter than those previously detected at keV and have a broad range in redshift and luminosity ( 0.020–2.923 and – erg s); the median redshift and luminosity are 0.7 and erg s, respectively. We characterize these sources on the basis of broad-band 0.5–32 keV spectroscopy, optical spectroscopy, and broad-band ultraviolet-to-mid-infrared SED analyzes. We find that the dominant source population is quasars with erg s, of which 50% are obscured with cm. However, none of the ten NuSTAR sources are Compton thick ( cm) and we place a 90% confidence upper limit on the fraction of Compton-thick quasars ( erg s) selected at keV of % over the redshift range 0.5–1.1. We jointly fitted the rest-frame 10–40 keV data for all of the non-beamed sources with erg s to constrain the average strength of reflection; we find for , broadly consistent with that found for local AGNs observed at keV. We also constrain the host galaxy masses and find a median stellar mass of , a factor 5 times higher than the median stellar mass of nearby high-energy selected AGNs, which may be at least partially driven by the order of magnitude higher X-ray luminosities of the NuSTAR sources. Within the low source-statistic limitations of our study, our results suggest that the overall properties of the NuSTAR sources are broadly similar to those of nearby high-energy selected AGNs but scaled up in luminosity and mass.
Subject headings:
galaxies: active — galaxies: high-redshift — infrared: galaxies — X-rays1. Introduction
The cosmic X-ray background (CXB) was first discovered in the early 1960’s (Giacconi et al. 1962), several years before the detection of the cosmic microwave background (CMB; Penzias & Wilson 1965). However, unlike the CMB, which is truly diffuse in origin, the CXB is dominated by the emission from high-energy distant point sources: Active Galactic Nuclei (AGNs), the sites of intense black-hole growth that reside at the centers of galaxies (see Brandt & Hasinger 2005; Brandt & Alexander 2010 for reviews). A key goal of high-energy astrophysics is to determine the detailed composition of the CXB in order to understand the evolution of AGNs.
Huge strides in revealing the composition of the CXB have been made over the past decade, with sensitive surveys undertaken by the Chandra and XMM-Newton observatories (e.g., Alexander et al. 2003a; Hasinger et al. 2007; Brunner et al. 2008; Luo et al. 2008; Comastri et al. 2011; Xue et al. 2011). These surveys are so deep that they have resolved 70–90% of the CXB at energies of 0.5–8 keV (e.g., Worsley et al. 2005; Hickox & Markevitch 2006; Lehmer et al. 2012; Xue et al. 2012), revealing a plethora of obscured and unobscured AGNs out to 5–6. However, although revolutionary, Chandra and XMM-Newton are only sensitive to sources detected at 0.5–10 keV, far from the peak of the CXB at 20–30 keV (e.g., Frontera et al. 2007; Ajello et al. 2008; Moretti et al. 2009; Ballantyne et al. 2011). Until recently, the most powerful observatories with sensitivity at 20–30 keV have only resolved 1–2% of the CXB at these energies (e.g., Krivonos et al. 2007; Ajello et al. 2008, 2012; Bottacini et al. 2012) and therefore provide a limited view of the dominant source populations (e.g., Sazonov & Revnivtsev 2004; Markwardt et al. 2005; Bassani et al. 2006; Treister, Urry, & Virani 2009; Bird et al. 2010; Tueller et al. 2010; Burlon et al. 2011).
A great breakthrough in resolving the peak of the CXB is the Nuclear Spectroscopic Telescope Array (NuSTAR) observatory. NuSTAR was successfully launched on June 13th 2012 and is the first keV orbiting observatory with focusing optics (Harrison et al. 2013). NuSTAR’s focusing optics provide a 1 order of magnitude improvement in angular resolution and a 2 orders of magnitude improvement in sensitivity over previous-generation keV observatories, a revolutionary leap forward in performance. One of the primary objectives of NuSTAR is to complete a sensitive extragalactic survey and identify the source populations that produce the peak of the CXB.
The NuSTAR extragalactic survey is comprised of three components (see Table 6 of Harrison et al. 2013): a deep small-area survey in the Extended Chandra Deep Field-South (E-CDF-S; Lehmer et al. 2005) field, a medium wider-area survey in the Cosmic Evolution Survey (COSMOS; Scoville et al. 2007) field, and a large area (typically shallow) serendipitous survey conducted in the fields of other NuSTAR targets, including 100 Swift-BAT identified AGNs. In this paper we report on the first ten spectroscopically identified sources in the NuSTAR serendipitous survey. In §2 we present the NuSTAR observations of the serendipitous sources, the multi-wavelength data, and the details of our data processing approaches, in §3 we describe our analysis of the X-ray and multi-wavelength data, in §4 we present our results, and in §5 we outline our conclusions. We adopt km s Mpc, and throughout.
2. NuSTAR Observations and Multi-Wavelength Data
NuSTAR is the first high-energy ( keV) orbiting observatory with focusing optics and has a usable energy range of 3–79 keV (Harrison et al. 2013). NuSTAR consists of two co-aligned X-ray telescopes (focal length of 10.14 m) which focus X-ray photons onto two independent shielded focal plane modules (FPMs), referred to here as FPMA and FPMB. Each FPM consists of 4 CdZnTe chips and has a field of view at 10 keV; the pixel size is . The focusing optics provide NuSTAR with a 1 order of magnitude improvement in angular resolution over previous observatories at keV; the full-width half maximum (FWHM) of the point-spread function (PSF) is and the half-power diameter is . The absolute astrometric accuracy of NuSTAR is (90% confidence) for bright X-ray sources and the spectral resolution is 0.4 keV (FWHM) at 10 keV.
2.1. The NuSTAR serendipitous survey
The NuSTAR serendipitous survey is the largest-area component of the NuSTAR extragalactic survey programme. The serendipitous survey is built up from NuSTAR-detected sources in the fields of NuSTAR targets, similar in principle to the serendipitous surveys undertaken in the fields of Chandra and XMM-Newton sources (e.g., Harrison et al. 2003; Kim et al. 2004; Watson et al. 2009). A major component of the NuSTAR serendipitous survey are 15–20 ks observations of 100 Swift-BAT identified AGNs, which provide both high-quality high-energy constraints of local AGNs and 2–3 deg of areal coverage to search for serendipitous sources. However, the serendipitous survey is not restricted to these fields and the NuSTAR observations of targets not in the E-CDF-S, COSMOS, and Galactic-plane surveys are used to search for serendipitous NuSTAR sources; the exposures for these targets are also often substantially deeper than the NuSTAR observations of the Swift-BAT AGNs (up-to on-axis exposures of 177.1 ks in the current paper). The expected areal coverage of the NuSTAR serendipitous survey in the first two years is 3–4 deg.
Using the NuSTAR data processing and source detection approach outlined below, at the time of writing we have serendipitously detected 50 sources in the fields of 70 NuSTAR targets. Here we present the properties of the first ten spectroscopically identified sources; see Table 1. These ten sources were selected from NuSTAR observations taken up until January 31st 2013. The selection of these sources for spectroscopic follow-up observations was based on their visibility to ground-based telescopes and they should therefore be representative of the overall high-energy source population.
2.1.1 Data processing and source searching
The Level 1 data products were processed with the NuSTAR Data Analysis Software (NuSTARDAS) package (v. 0.9.0). Event files (level 2 data products) were produced, calibrated, and cleaned using standard filtering criteria with the nupipeline task and the latest calibration files available in the NuSTAR CALDB. The NuSTAR observations of the Geminga field were comprised of 15 separate exposures, which we combined using ximage v4.5.1;111See http://heasarc.gsfc.nasa.gov/docs/xanadu/ximage/ximage.html for details of ximage. the other NuSTAR observations reported here were individual exposures.
We produced 3–24 keV, 3–8 keV, and 8–24 keV images using dmcopy from the Chandra Interactive Analysis Observations (ciao) software (v4.4; Fruscione et al. 2006) for both NuSTAR FPMs.222See http://cxc.harvard.edu/ciao/index.html for details of ciao. We also produced exposure maps in each energy band for both FPMs, which take account of the fall in the effective area of the mirrors with off-axis angle and are normalised to the effective exposure of a source located at the aim point.
We searched for serendipitous sources in all of the six images (i.e., the three energy bands for each FPM) using wavdetect (Freeman et al. 2002) with an initial false-positive probability threshold of and wavelet scales of 4, 5.66, 8, 11.31, and 16 pixels. To be considered a reliable NuSTAR source we require a detection to satisfy at least one of two criteria: (1) to be detected in at least one of the three images for both FPMA and FPMB or (2) to be detected in at least one of the three images in a single FPM but to have a lower-energy X-ray counterpart (e.g., detected by Chandra, Swift-XRT, or XMM-Newton). Following §3.4.1 of Alexander et al. (2003a), we also ran wavdetect at a false-positive probability threshold of to search the six images (i.e., the three energy bands for each FPM) for lower significance counterparts of sources already detected at a false-positive probability threshold of in any of the three energy bands.
See Tables 1–2 for the details of the X-ray data for the first 10 spectroscopically identified serendipitous NuSTAR sources. All of the NuSTAR sources are detected at keV in at least one FPM.
2.1.2 Source photometry
We measured the number of counts for each source at 3–24, 3–8, and 8–24 keV using either a 30, 45, or 60 radius circular aperture centered on the 3–24 keV wavdetect position for each FPM; the encircled energy fractions of these apertures are 0.50, 0.66, and 0.77 of the full PSF, respectively, for a source at the aim point. The choice of aperture is dictated by the brightness of the source and how close it lies to another source; see Table 2 for the adopted aperture of each source. These measurements provide the gross source counts, which we correct for background counts to provide the net source counts. To obtain a good sampling of the background counts while minimising the contribution to the background from the source counts, we measured the background in source-free regions using at least four circular apertures of 45 or 60 radius at least 90 from the source. The gross source counts are corrected for the background counts to give the net source counts, rescaling for the different sizes of the source and background regions. Errors on the net source counts are determined as the square root of the gross source counts. Upper limits are calculated when a source is not detected in one of the six images or if the net counts are less than the 1 uncertainty; 3 upper limits are calculated as 3 times the square root of the gross source counts. See Table 2 for the source photometry.
2.1.3 Source fluxes
The source fluxes are calculated using the net count rates (i.e., the net counts divided by the source exposure time) and the measured X-ray spectral slope, following a procedure analogous to that used in the Chandra deep field surveys (e.g., Brandt et al. 2001; Alexander et al. 2003a). The X-ray spectral slope is determined from the band ratio, which we define here as the 8–24 keV/3–8 keV count-rate ratio. To convert the band ratio into an X-ray spectral slope we used xspec v12.7.1d (Arnaud 1996) and the Response Matrix File (RMF) and Ancillary Response File (ARF) of the detected NuSTAR sources; we produced the RMF and ARF following §2.1.5. We also used xspec and the RMF and ARF to determine the relationship between count rate, X-ray spectral slope, and source flux in each of the three energy bands: 3–24 keV, 3–8 keV, and 8–24 keV. We calculated the source fluxes in the three energy bands using the observed count rate and the derived X-ray spectral slope; for the faint NuSTAR sources with net counts summed over the two FPMs, we set the X-ray spectral slope to , consistent with the average X-ray spectral slope of the overall sample (see §4.3). The source fluxes in each band were then corrected to the 100% encircled-energy fraction of the PSF and averaged over the two FPMs.
2.1.4 Source positions
To provide the most accurate NuSTAR source positions and assist in source matching, we calculated a counts-weighted source position. This is determined from the 3–24 keV net counts and the 3–24 keV source position in each FPM. If a source is only detected in one FPM at 3–24 keV then the position of the source in that FPM is used.333We derive the NuSTAR source name from the counts-weighted NuSTAR source position, adjusted to an appropriate level of precision (based on the NuSTAR positional accuracy), using the International Astronomical Union (IAU) approved naming convention for NuSTAR sources: NuSTAR JHHMMSSDDMM.m, where m is the truncated fraction of an arcmin in declination for the arcseconds component.
2.1.5 Extraction of the X-ray spectral products
We extracted the NuSTAR data to be used in the X-ray spectral fitting analyzes. The NuSTAR data were extracted using the NuSTAR-developed software nuproducts. nuproducts extracts source and background spectra and produces the RMF and ARF required to fit the X-ray data; the source and background spectra were extracted from each FPM using the same-sized apertures and regions as those adopted for the source photometry.
For the serendipitous source in the Geminga field (NuSTAR J063358+1742.4) we combined the source and background spectrum from each of the 15 observations (see §2.1.1) to produce a total source and background spectrum. We also produced an average ARF file for NuSTAR J063358+1742.4 by combining the individual ARF files, weighted by the exposure time for each ARF, and we used the RMF produced from the first observation when fitting the X-ray data.
2.2. Lower-energy X-ray data
To extend the X-ray spectral fitting constraints and assist in the identification of optical counterparts, we searched for keV counterparts for each NuSTAR-detected source using Chandra, Swift-XRT, and XMM-Newton observations. Since the NuSTAR serendipitous programme targets fields containing well-known Galactic and extragalactic targets, they all have lower-energy X-ray coverage. However, the only lower-energy X-ray data available in the IC 751 field is a short ( 2.3 ks) Swift-XRT observation in which the serendipitous NuSTAR source is detected with only 10 counts by XRT, which is insufficient to provide useful keV constraints. For all of the other NuSTAR sources there are good-quality keV data and, in some cases, there was more than one observation available. When selecting suitable lower-energy data we preferentially chose contemporaneous observations (i.e., observations taken within 1 week of the NuSTAR observations), which was the case for three sources in our sample (NuSTAR J032459-0256.1; NuSTAR J121027+3929.1; NuSTAR J183443+3237.8). In the absence of contemporaneous observations we used existing lower-energy data where the 3–8 keV flux agreed to within a factor of two of the 3–8 keV flux measured from the NuSTAR data; see §2.3 for more details.
2.2.1 Chandra, Swift-XRT, and XMM-Newton observations
The archival Chandra observations are analyzed using CIAO. The data were reprocessed using the chandra_repro pipeline to create the new level 2 event file, and the Chandra source spectra were extracted from a circular region with a radius of 5–10. The background spectra were extracted from several source-free regions of 40 radius, selected at different positions around the source to account for local background variations.
The Swift-XRT data are reduced using the HEAsoft (v.6.12) pipeline xrtpipeline, which cleans the event files using appropriate calibration files and extracts the spectra and ancillary files for a given source position;444See http://heasarc.gsfc.nasa.gov/docs/software/lheasoft/ for details of HEAsoft. the source extraction regions had radii of 20. Since the background in the Swift-XRT observations is very low, no background spectra were extracted.
For the XMM-Newton EPIC data we used the Pipeline Processing System (PPS) products, which are a collection of standard processed high-quality products generated by the Survey Science Center (SSC). For our analysis we used the Science Analysis Software (SAS v.12.0.1), released in June 2012.555See http://xmm.esa.int/sas/ for details of the SAS software. After filtering the event files for high background intervals, we extracted the source spectra from a circular region with a radius of . The corresponding background spectra have been extracted using circular source-free regions in the vicinity of the corresponding source ( 30–60 radius regions). Using the SAS tasks rmfgen and arfgen we also produced the response matrices for each source in each of the three EPIC cameras separately (pn, MOS1, and MOS2).

2.3. Counterpart matching
To provide reliable source identification we matched the NuSTAR sources to the keV and multi-wavelength data; see §2.2, §2.4, and Table 3 for the description of the data. We searched for multi-wavelength counterparts within of the NuSTAR source positions using on-line source catalogs and multi-wavelength images; the latter approach is required for faint counterparts or for recent data not yet reported in on-line source catalogs. The search radius is motivated by the absolute astrometric accuracy of NuSTAR (, 90% confidence, for bright X-ray sources; Harrison et al. 2013) and the low count rates for the majority of our sources.
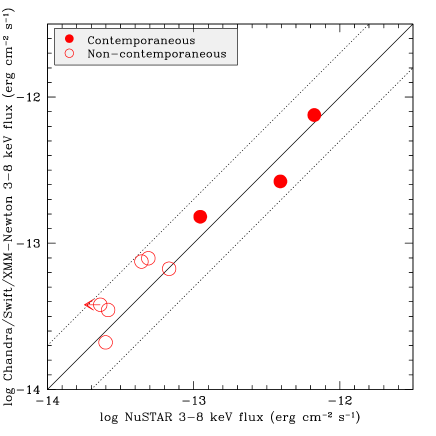
A lower-energy X-ray counterpart is found within for each of the NuSTAR sources; see Table 2. To provide further confidence that the X-ray source is the correct lower-energy counterpart to the NuSTAR source, we compared the 3–8 keV fluxes of the lower-energy source and the NuSTAR source. We selected and extracted the lower-energy X-ray data following §2.2 and we calculated the 3–8 keV fluxes using a power-law model in xspec (the model component is pow in xspec); see Table 1 for details of the low-energy X-ray data selected for each source. The average source flux was calculated for the XMM-Newton data when multiple detectors were used (i.e., PN, MOS 1 and MOS 2). In Fig. 1 we compare the 3–8 keV fluxes from the lower-energy X-ray data to the 3–8 keV flux from the NuSTAR data. In all cases the fluxes agree within a factor of two, demonstrating that we have selected the correct lower-energy X-ray counterpart.
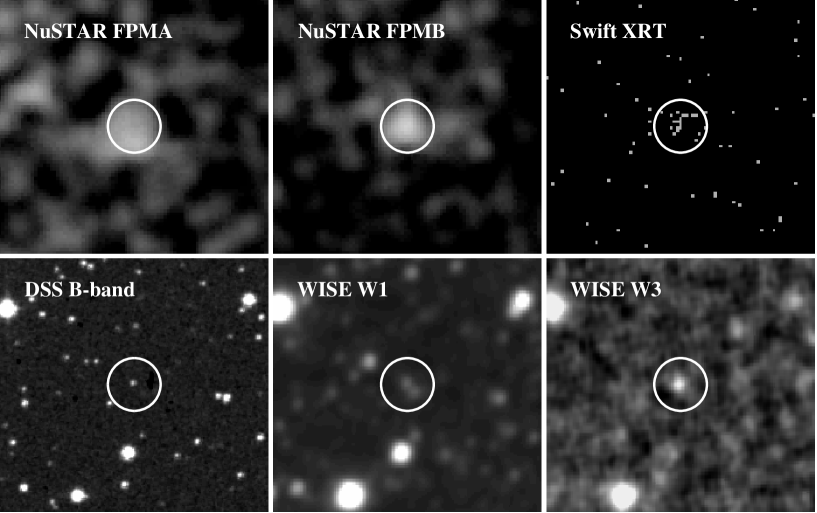
An optical counterpart is also found within of each NuSTAR source; see Table 3. Given the larger intrinsic uncertainty in the NuSTAR source position when compared to the lower-energy X-ray source position, we also measured the distance between the lower-energy X-ray source position and the optical position. An optical counterpart is found within (and the majority lie within ) of the lower-energy X-ray source position for all of the sources. See Fig. 2 for example multi-wavelength cut-out images of NuSTAR J183443+3237.8 in the 3C 382 field.
2.4. Ultraviolet–radio data
To further characterize the properties of the NuSTAR sources we used ultraviolet (UV) to mid-infrared (MIR) data. Table 3 presents the broad-band UV–MIR photometric properties of the NuSTAR sources, primarily obtained from existing, publicly available all-sky or large-area surveys, including the Galaxy Evolution Explorer (GALEX; Martin et al. 2005), the Digitised Sky Survey (DSS; Minkowski & Abell 1963; Hambly et al. 2001), the Sloan Digital Sky Survey (SDSS; York et al. 2000), the Two-Micron All-Sky Survey (2MASS; Skrutskie et al. 2006), and the Wide-Field Infrared Survey Explorer (WISE; Wright et al. 2010). The source photometry is provided in its native format for all of the sources. The DSS data, provided for sources outside of the SDSS, were obtained from the SuperCOSMOS scans of the photographic Schmidt plates (Hambly et al. 2001). As recommended by the SuperCOSMOS Sky Survey, all photometric uncertainties are set to 0.30 mag for those measurements. Where publicly available, we also provide Spitzer photometry from the Infrared Array Camera (IRAC; Fazio et al. 2004), obtained from the post-basic calibrated data (PBCD) products. To avoid the effects of source confusion, photometry was measured in 24 radius apertures on the 06 per pixel re-sampled PBCD mosaics, and then corrected to total flux density using aperture corrections from the IRAC Instrument Handbook (v.2.0.2).666See http://irsa.ipac.caltech.edu/data/SPITZER/docs/irac/ for details of Spitzer-IRAC. Several sources were observed during the post-cryogenic Warm Spitzer phase, and thus only the two shorter wavelength bandpasses from Spitzer-IRAC are available.
In several cases we used photometry from different sources, which we list below. For NuSTAR J063358+1742.4 we report a -band non-detection, which is measured from 1.56 ks of dithered observations obtained with the Florida Infrared Imaging Multi-object Spectrograph (FLAMINGOS) on the Kitt Peak 2.1 m telescope. The data were obtained on UT 2012 October 17 in photometric but 16 seeing conditions, and the 3 upper limit was calculated in a radius aperture; see Table 3 for more details. For NuSTAR J145856-3135.5 we report the -band magnitude from Caccianiga et al. (2008). For NuSTAR J181428+3410.8 the optical photometry comes from imaging reported in Eisenhardt et al. (2012), calibrated to the SDSS. The WISE 12 m photometry for NuSTAR J181428+3410.8 was measured directly from the images as this source does not appear in the WISE All-Sky Catalog; we do not provide the shorter wavelength WISE photometry for this source as it is superceded by Warm Spitzer observations. For NuSTAR J183443+3237.8 we obtained , , and band observations using the Palomar 60-inch telescope (P60) on UT 2013 March 04 in seeing; the exposure time was 300 s in each band, repeated three times with a dither. NuSTAR J183443+3237.8 was well detected in all three bands and the reported photometry in Table 3 was measured in diameter apertures, which has been corrected for PSF losses.
We also searched for radio counterparts in the NVSS and FIRST VLA surveys (Becker et al. 1995; Condon et al. 1998), using a search radius of and , respectively. NuSTAR J121027+3929.1 was detected in both surveys and has a flux of mJy (in the NVSS survey), which corresponds to a rest-frame luminosity density of W Hz (calculated following Equation 2 of Alexander et al. 2003b and assuming a radio spectral slope of ). With the exception of NuSTAR J011042-4604.2, all of the other sources had at least NVSS coverage but none were detected. The rest-frame luminosity density upper limits ranged from W Hz (for NuSTAR J032459-0256.1) to W Hz (for NuSTAR J115746+6004.9), with the majority of the sources having upper limits of – W Hz.
2.5. Optical spectroscopy
Two of the ten serendipitous sources have existing optical spectroscopy: NuSTAR J121027+3929.1 has been previously identified as a BL Lac at (MS 1207.9+3945; e.g., Stocke et al. 1985; Gioia et al. 1990; Morris et al. 1991) while NuSTAR J145856-3135.5 has been previously identified as a broad-line AGN (BLAGN) at (2XMM J145857.0-313536; Caccianiga et al. 2008). For the other eight serendipitous NuSTAR sources we obtained optical spectroscopy at the Palomar, Keck, and Gemini-South telescopes. Table 3 presents basic information about the observations, including the instrument and UT date of the observations and in the Appendix we provide specific details for each observation. We processed all of the optical spectroscopic data using standard techniques, and flux calibrated the spectra using standard stars observed on the same nights.
The optical spectra for the eight newly identified NuSTAR sources are shown in Fig. 3. Clear multiple broad and/or narrow emission lines are detected in six sources, showing that the redshift identifications are reliable. However, the optical counterparts for NuSTAR J115746+6004.9 and NuSTAR J063358+1742.4 are comparatively faint and the optical spectra are therefore of lower quality when compared to the optical spectra of the other serendipitous sources. NuSTAR J115746+6004.9 has narrow, spatially extended Ly emission as well as somewhat broadened C III] emission indicating ; spatially extended Ly emission is often found to be associated with powerful AGNs (e.g., Reuland et al. 2003; Geach et al. 2009; Yang et al. 2009). The redshift of NuSTAR J063358+1742.4 is less certain due to the identification of a single narrow emission line, which is more likely to be [O II] at than Ly due to the rising optical continuum and lack of a strong Ly forest decrement (as would be expected had the source been at ); the identification of two absorption features at the wavelengths expected for Ca H+K provide additional confidence for . We consider all of the redshifts to be reliable.
The two NuSTAR sources with existing optical spectroscopy (NuSTAR J121027+3929.1; NuSTAR J145856-3135.5) have optical magnitudes consistent with the eight newly identified NuSTAR sources and meet our basic requirement for inclusion in this paper (i.e., sources identified in NuSTAR observations taken up until January 31st 2013); we note that several of the other 40 serendipitously detected NuSTAR sources also have existing optical spectroscopy but have been identified in more recent NuSTAR observations and so are not included in this paper. We therefore believe that the inclusion of these two NuSTAR sources does not bias our overall NuSTAR sample.
3. Data Analysis
3.1. X-ray spectral fitting
To interpret the X-ray data and provide insight into the intrinsic AGN properties of the serendipitous NuSTAR sources (e.g., and ) we fitted the X-ray data using physically motivated AGN models. We extracted the NuSTAR data following §2.1.5 and the lower-energy X-ray data following §2.2.1.
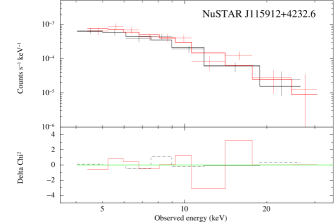
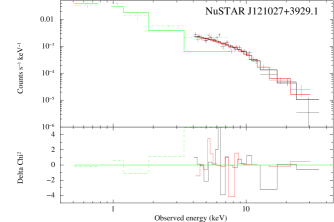
For the three sources with counts in each NuSTAR FPM at 3–24 keV (NuSTAR J011042-4604.2, NuSTAR J115912+4232.6, and NuSTAR J121027+3929.1; see Table 2), we grouped the NuSTAR data into bins of at least 40 counts per bin and used statistics to find the best-fitting model parameter solutions. However, the NuSTAR photon statistics were too poor to allow for statistics for the other seven sources, and for the X-ray spectral analyzes of these sources we fitted the unbinned X-ray data using the -statistic (Cash 1979). The -statistic is calculated on unbinned data and is therefore ideally suited to low-count sources (e.g., Nousek & Shue 1989). However, since the data need to be fitted without the background subtracted, it is essential to accurately characterize the background and use that as a fixed model component in the X-ray spectral fitting of the source spectrum. We characterized the background by fitting the background regions using a double power-law model (the model components are pow*pow in xspec). The photon statistics were also often poor for the lower-energy X-ray data ( counts) and we therefore typically fitted the unbinned keV data using the -statistic with the measured background as a fixed component. In Fig. 4 we show example NuSTAR spectra for two of the brightest NuSTAR sources: NuSTAR J115912+4232.6 and NuSTAR J121027+3929.1; for NuSTAR J121027+3929.1 we also show the Swift-XRT data. All fit parameter uncertainties are quoted at the 90% confidence level (Avni 1976).
We initially fitted only the NuSTAR data using a simple power-law model (the pow model in xspec) to provide constraints on the overall X-ray spectral slope () over 4–32 keV. We also restricted the NuSTAR data to cover the rest-frame 10–40 keV energy range for each source and fitted a power-law model to measure both the rest-frame 10–40 keV spectral slope () and luminosity (); given the redshift of NuSTAR J115746+6004.9 () we fitted to the rest-frame 15–60 keV data. See Table 4.
To provide direct measurements on the presence of absorption we jointly fitted an absorbed power-law model (the model components are zwabs*pow in xspec) to both the NuSTAR and lower-energy X-ray data for each source.777We note that AGNs often require more complex models to characterize their X-ray emission than that of a simple absorbed power law (e.g., Winter et al. 2009; Vasudevan et al. 2013). However, the data quality of our sources is not sufficient to reliably constrain such models on a source by source basis (see §4.3 for more detailed average constraints). For five of the sources we fitted the 0.5–32 keV data (for NuSTAR J121027+3929.1 we fitted the 0.5–50 keV data, given the good photon statistics of this source), jointly fitting the X-ray spectral slope and absorbing column density for both of the NuSTAR FPMs and the lower-energy X-ray data. However, for NuSTAR J115912+4232.6 no good-quality low-energy X-ray data exist and we therefore only fitted the NuSTAR data, while for the remaining three sources (NuSTAR J115746+6004.9, NuSTAR J145856-3135.5, and NuSTAR J181428+3410.8) the photon statistics of the NuSTAR data were too poor to provide reliable constraints on both and , and we therefore fitted the absorbed power-law model to just the lower-energy X-ray data. The best-fitting model parameters are given in Table 4.
3.2. Ultraviolet–mid-infrared spectral energy distribution fitting
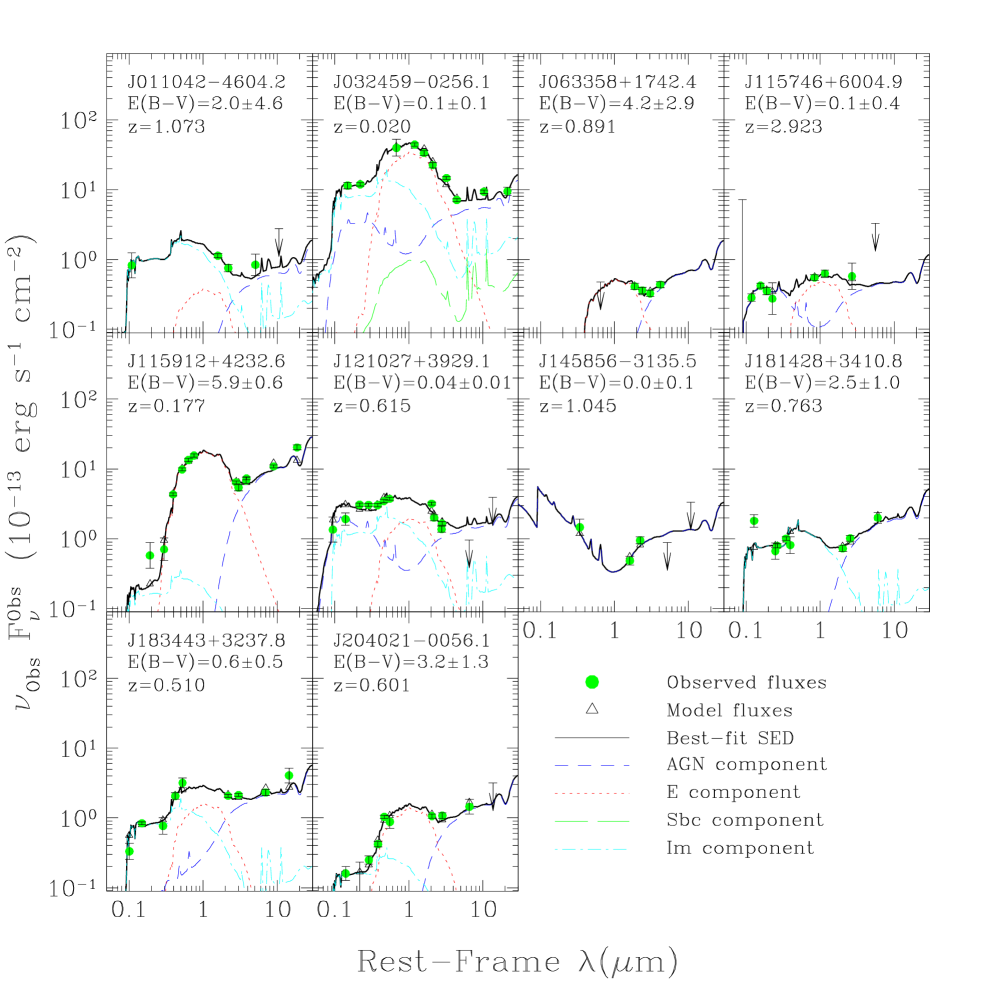
To constrain the relative contributions from AGN activity and the host galaxy to the UV–MIR data we fitted the broad-band UV–MIR spectral energy distributions (SEDs) using the 0.03–30 m empirical low-resolution templates for AGN and galaxies of Assef et al. (2010). Each SED is modelled as the best-fit non-negative combination of three galaxy templates and an AGN template. The reddening of the AGN template, parameterized by , is a free parameter in the fit. The errors on the parameters were calculated using a Monte-Carlo method, where the photometry is resampled 1000 times according to the photometric uncertainties and the SED fits and parameters are re-calculated; the errors refer to the standard deviation for all of the realizations. Since the templates have been empirically defined using AGNs with similar X-ray luminosities and redshifts at the NuSTAR sources, we do not expect there to be significant systematic uncertainties in the best-fitting model solutions; the efficacy of the SED-fitting approach will be further explored in S. M. Chung et al. (in prep.). We refer the reader to Assef et al. (2008, 2010, 2013) for further details.
In Fig. 5 we present the UV–MIR SEDs and best-fitting solutions and in Table 3 we provide the following best-fitting parameters: (the fractional contribution to the overall emission from the AGN component over 0.1–30 m; Assef et al. 2013), (the dust reddening of the AGN component), (the luminosity of the AGN component at rest-frame 6 m), and (the stellar mass of the host galaxy). The stellar mass is calculated from the absolute magnitude of the stellar component using the color-magnitude calibration of Bell et al. (2003). Three of the NuSTAR sources have photometric measurements in 5 bands (NuSTAR J11042+4604.2; NuSTAR J063358+1742.4; NuSTAR J145856-3135.5) and the derived properties for these sources are therefore poorly constrained.
4. Results
In analyzing the NuSTAR sources we predominantly focus on characterizing their X-ray and UV–MIR properties and comparing these properties to those of sources detected in previous-generation keV surveys (e.g., Swift-BAT; Tueller et al. 2008, 2010; Baumgartner et al. 2012).
4.1. Basic source properties
The 8–24 keV fluxes of the NuSTAR sources are up-to 100 times fainter than sources previously detected at 10 keV ( (0.6–5.9) erg s cm, as compared to erg s cm; e.g., see Table 2 and the RXTE data in Revnivtsev et al. 2004). The NuSTAR sources also have fainter optical counterparts and lie at higher redshifts than sources previously detected at 10 keV ( 16–22 mags and a median redshift of 0.7, as compared to 10–16 mags and a median redshift of 0.03; see Beckmann et al. 2009 and Table 3).
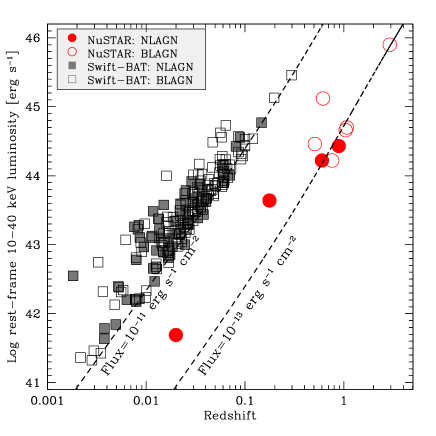
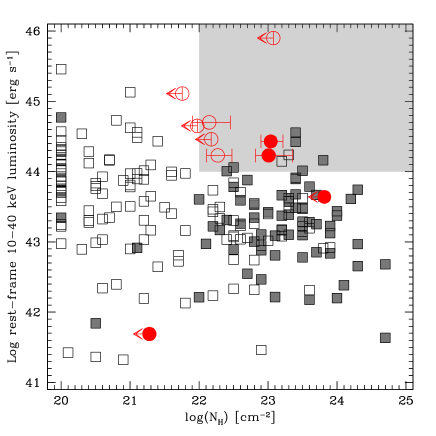
In Fig. 6 we plot the rest-frame 10–40 keV luminosity versus redshift of the NuSTAR sources and compare them to AGNs detected in the Swift-BAT survey (e.g., Burlon et al. 2011). With a median luminosity of erg s, the NuSTAR sources are more luminous than the vast majority of the Swift-BAT AGNs, where 80% have erg s; the median luminosity of the Swift-BAT AGNs is erg s. The larger fraction of luminous AGNs detected by NuSTAR, in comparison to Swift-BAT, is a consequence of the higher sensitivity of NuSTAR and two additional factors (1) the strong redshift-dependent evolution of luminous AGNs (e.g., Ueda et al. 2003; Barger et al. 2005; Hasinger et al. 2005; Aird et al. 2010), and (2) the comparatively small cosmological volume in which NuSTAR is sensitive to AGNs with erg s ().
The range of redshifts for the NuSTAR sources is large ( 0.020–2.923). At , NuSTAR J115746+6004.9 is the highest-redshift AGN detected to date at keV that does not appear to be strongly beamed (e.g., Beckmann et al. 2009; Burlon et al. 2011; Malizia et al. 2012). By comparison, NuSTAR J032459-0256.1 has a redshift typical of those of the Swift-BAT AGNs () but, with erg s, it is 30 times less luminous than the faintest Swift-BAT AGNs; in §4.4 we show that this source is also unusual since it is hosted in a low-mass dwarf galaxy. The high X-ray luminosities for the majority of the NuSTAR sources indicate that they are AGNs. However, the origin of the modest X-ray luminosity of NuSTAR J032459-0256.1 is less clear and it is possible that the X-ray emission is produced by a hyper-luminous X-ray source (HLX; e.g., Farrell et al. 2009; Swartz et al. 2011) as opposed to a low-luminosity AGN; high-spatial resolution observations with Chandra would be able to distinguish between an off-nuclear HLX and an AGN or nuclear HLX. The median and range in X-ray luminosity and redshift of the NuSTAR sources are consistent with expectations (Ballantyne et al. 2011). However, we note that both the redshift and X-ray luminosity of NuSTAR J032459-0256.1 are below the range typically explored in the models.
The optical spectral properties of the NuSTAR sources are relatively diverse; see Fig. 3 and Table 3. Five of the ten (%) serendipitous sources have broad emission lines and are classified as broad-line AGNs (BLAGNs), four (%) have narrow emission lines and we classify as narrow-line AGNs (NLAGNs), and one is a BL Lac, with strong power-law optical continuum emission and weak emission lines.888All errors are taken from Tables 1 and 2 of Gehrels (1986) and correspond to the 1 level; these were calculated assuming Poisson statistics.999We note that our classification of NLAGNs is fairly loose since we lack the emission-line diagnostics around for the majority of our sources to prove that they lie in the AGN region of an emission-line diagnostic diagram as opposed to the HII region (e.g., Baldwin, Phillips, & Terlevich 1981; Veilleux & Osterbrock 1987). The BL Lac (NuSTAR J121027+3929.1) is a relatively well studied high-frequency peaked BL Lac (HBL; Padovani & Giommi 1995), originally identified at X-ray energies by Einstein (MS 1207.9+3945; e.g., Gioia et al. 1990; Morris et al. 1991; Urry et al. 2000; Maselli et al. 2008). Two of the NLAGNs have erg s and are therefore type 2 quasars, representing % of the NuSTAR sample; by comparison six type 2 quasars are identified in the 199 Swift-BAT sample of Burlon et al. (2011), just % of the entire sample. However, the difference in the fraction of type 2 quasars between NuSTAR and Swift-BAT is at least partly related to the increased fraction of luminous AGNs in the NuSTAR serendipitous sample; we note that, since we lack coverage of the emission line for the type 2 quasars, we cannot rule out the presence of broad in some of the NuSTAR type 2 quasars. The overall fraction of BLAGNs and NLAGNs in the Swift-BAT AGN sample is consistent with that found for the NuSTAR serendipitous sample: % of the Swift-BAT sources are BLAGNs (including all Seyfert 1s and Seyfert 1.2s) and % are NLAGNs (including all Seyfert 1.5s, Seyfert 1.8s, Seyfert 1.9s, and Seyfert 2s). Therefore, within the limitations of our small sample, the biggest differences between the basic properties of the NuSTAR sources and the Swift-BAT AGNs appear to be luminosity and redshift.
4.2. X-ray spectral properties: the presence of absorption
The keV sensitivity of NuSTAR allows for the selection of AGNs almost irrespective of the presence of absorption, up-to high absorbing column densities of (1–3) cm. However, particularly when using lower-energy X-ray data, we can measure the absorbing column densities of the NuSTAR sources using the X-ray band ratio (the 8–24 keV to 3–8 keV count-rate ratio) and from fitting the X-ray spectra over a broad energy range.
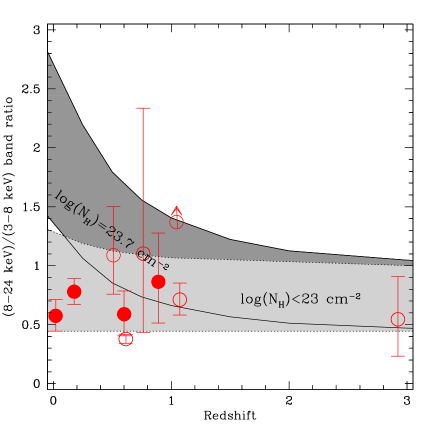
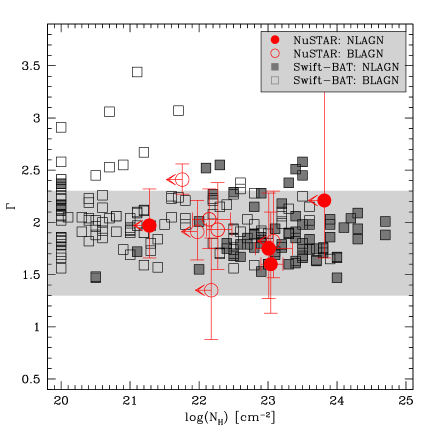
In Fig. 7 we show the X-ray band ratio versus redshift for the NuSTAR sources and compare them with those expected for absorbed power-law emission from an AGN. As can be seen, given the high X-ray energies probed by NuSTAR, the evidence for absorption can only be clearly identified on the basis of the X-ray band ratio for the most heavily obscured AGNs ( cm) at 0.5. The X-ray band ratios for all of the NuSTAR sources are consistent with cm. However, more detailed constraints on the X-ray spectral properties and the presence of absorption can be placed by directly fitting the X-ray spectra of the NuSTAR sources, particularly when including lower-energy data ( keV), which is more sensitive to column densities of cm. We extracted the X-ray spectral products and fitted the X-ray data of the NuSTAR sources with an absorbed power-law model (zwabs*pow in xspec), following §3.1; see Footnote 7 for caveats on the application of an absorbed power-law model to characterize AGNs. In Fig. 8 we plot the best-fitting X-ray spectral slope () and absorbing column density () for the NuSTAR sources (see Table 4 for the best-fitting parameters) and compare them to the X-ray spectral properties of the Swift-BAT-detected AGNs in Burlon et al. (2011). The best-fitting X-ray spectral slopes of the NuSTAR sources are broadly consistent with those found for well-studied nearby AGNs ( 1.3–2.3; e.g., Nandra & Pounds 1994; Reeves & Turner 2000; Deluit & Courvoisier 2003; Piconcelli et al. 2005; Burlon et al. 2011). The source with the steepest X-ray spectral slope () is NuSTAR J121027+3929.1, the HBL previously identified at keV (e.g., Gioia et al. 1990; Morris et al. 1991). Indeed, steep X-ray spectral slopes are typical of HBLs (e.g., Sambruna et al. 1996; Fossati et al. 1997).
Four of the ten sources (%) require the presence of absorption, with cm, and the other six sources have absorbing column density upper limits. The fraction of X-ray absorbed AGNs with cm in the Swift-BAT sample of Burlon et al. (2011) is %, indicating no significant difference in the fraction of absorbed AGNs between the NuSTAR sources and the Swift-BAT AGNs. Eight of the NuSTAR sources are quasars with erg s, and four (%) of the quasars are absorbed with cm; see Fig. 9. The fraction of obscured quasars is in broad agreement with that found at keV in the local Universe and from Chandra and XMM-Newton surveys at higher redshift (e.g., Ueda et al. 2003; La Franca et al. 2005; Akylas et al. 2006; Hasinger 2008; Burlon et al. 2011; Malizia et al. 2012); however, better source statistics are required to provide sufficient constraints to distinguish between different X-ray background synthesis models (Gilli et al. 2007). Two of the X-ray absorbed quasars are BLAGNs and two are NLAGNs and we discuss the origin of the obscuration towards these sources in §4.4.
None of the NuSTAR sources appear to be absorbed by Compton-thick material ( cm), despite the near obscuration-independent AGN selection over the NuSTAR energy range. However, the absorbing column densities of Compton-thick AGNs are so high that even the keV emission can be significantly absorbed (e.g., AGNs with cm can be suppressed by an order of magnitude; see Fig. 11 of Burlon et al. 2011). Therefore, Compton-thick AGNs can be comparatively rare even in high-energy AGN samples.101010Less direct approaches are often required to identify Compton-thick AGNs with cm (e.g., optical–mid-infrared spectroscopy, photometry, and SED fitting; Risaliti et al. 1999; Alexander et al. 2008; Treister et al. 2009; Goulding et al. 2011; Del Moro et al. 2013; Luo et al. 2013). Indeed, on the basis of the results obtained for local AGNs at keV with the INTEGRAL and Swift-BAT observatories, only 5–10% of the detected sources are Compton-thick AGNs (e.g., Tueller et al. 2008; Beckmann et al. 2009; Burlon et al. 2011; Ajello et al. 2012), despite the intrinsic fraction of Compton-thick AGNs likely being substantially larger.111111Assuming that the intrinsic distribution of absorbing column densities over – cm is flat (e.g., Risaliti et al. 1999) and that keV surveys are only sensitive to the identification of AGNs with cm, the intrinsic fraction of Compton-thick AGNs would be 20–40%. If distant AGNs have a similar range of absorbing column densities as those found locally, we would therefore expect 0.5–1 Compton-thick AGNs in our small sample; given the tentative evidence for an increase in the fraction of obscured AGNs with redshift (e.g., La Franca et al. 2005; Ballantyne et al. 2006, Treister & Urry 2006; Brightman & Ueda 2012), we may expect the Compton-thick AGN fraction to be even larger in the distant Universe. Taking account of the low number statistics of our sample, we can therefore place an upper limit to the fraction of Compton-thick AGNs of % in our sample (90% confidence; see Table 1 of Gehrels 1986). The 90% upper limit on the fraction of Compton-thick quasars over the redshift range of 0.5–1.1 is % if we only consider the seven NuSTAR sources with erg s. These upper limits are marginally too high to distinguish between different model predictions for the fraction of Compton-thick AGNs detected in NuSTAR surveys for a range of AGN luminosity functions and column-density distributions ( 22%; Ballantyne et al. 2011; Akylas et al. 2012). Better source statistics are clearly required to accurately measure the fraction of distant Compton-thick AGNs.
4.3. X-ray spectral properties: the presence of reflection
A unique aspect of the NuSTAR data is the insight that it places on the keV emission from distant AGNs and the presence of spectral complexity beyond that of simple power-law emission (e.g., a reflection component), particularly at where the rest-frame energy coverage of Chandra and XMM-Newton is comparatively modest. By focusing on keV emission, the effect of absorption on the observed emission will be neglible (at least up to cm) and the presence of reflection can be revealed by the flattening of the intrinsic power-law component.
To investigate the keV emission in our sources we fitted the rest-frame 10–40 keV emission using a simple power-law model (the pow model in xspec), following §3.1; see Table 4. The spectral constraints for individual sources are poor and range from 0.4–2.4, with large uncertainties; the mean X-ray spectral slope is . However, we can place accurate average spectral constraints by jointly fitting the data. When jointly fitting the data we fitted the rest-frame 10–40 keV data of the NuSTAR sources with a power-law model, jointly fitting the power-law component but leaving the normalization for each source to vary independently. In this analysis we excluded NuSTAR J121027+3929.1, the HBL, and NuSTAR J032459-0256.1, the low-luminosity system, since we wanted to focus on luminous non-beamed AGNs. The best-fitting X-ray spectral slope from the joint spectral fitting is , in good agreement with the intrinsic X-ray spectral slope found for nearby AGNs studied at keV (e.g., Deluit & Courvoisier 2003; Dadina 2008; Molina et al. 2009; Burlon et al. 2011); see Table 5. To first order, the comparatively steep average rest-frame 10–40 keV spectral slope suggests that there is not a significant reflection component in these sources, on average, which would manifest itself as a relatively flat X-ray spectral slope at keV (e.g., Nandra & Pounds 1994).
We can more directly constrain the average strength of the reflection component by jointly fitting the rest-frame 10–40 keV data using the pexrav model in xspec (Magdziarz & Zdziarski 1995).121212The pexrav model calculates the expected X-ray continuum spectrum due to the reflection of power-law emission by neutral material. Fixing the X-ray spectral slope to and adopting the default parameters for pexrav we constrain the average strength of the reflection for the eight NuSTAR sources to be .131313The reflection parameter indicates the solid angle of a neutral slab of material illuminated by the primary X-ray source: . Conversely, if we fix , the typical value found for nearby AGNs selected at keV (e.g., Deluit & Courvoisier 2003; Dadina 2008; Beckmann et al. 2009; Molina et al. 2009), we constrain the intrinsic X-ray spectral slope to be , also consistent with that of nearby AGNs; see Table 5. To first order, our results therefore suggest that the strength of reflection in distant luminous AGNs is consistent to that found for local AGNs. However, better source statistics are required to more accurately constrain the strength of a reflection component in distant AGNs and to search for changes in the reflection component within sub populations (e.g., dividing the samples in terms of luminosity and absorbing column density).
4.4. Ultraviolet–mid-infrared source properties
The UV–MIR data of the NuSTAR sources can provide insight into the emission from the AGN and host galaxy and the presence of dust reddening. Below we first explore the MIR colors of the NuSTAR sources and we then analyze their UV–MIR SEDs.
4.4.1 Infrared color analysis
Various work over the past decade has shown that MIR colors provide a powerful method to robustly select luminous AGNs in a manner that is relatively unbiased by obscuration (e.g., Stern et al. 2005, 2012; Assef et al. 2010, 2013; Donley et al. 2007, 2012). As such, MIR selection has some similarity to hard X-ray selection, and MIR and hard X-ray source selection are potentially the two most promising avenues for uncovering the full census of AGN in universe. Each wavelength has various strengths and weaknesses. In particular, various work has shown that MIR selection preferentially identifies the most luminous AGN with quasar-level luminosities (e.g., Donley et al. 2007, Eckart et al. 2010), while X-ray selection efficiently identifies moderate–high luminosity AGNs (e.g., Barger et al. 2003; Szokoly et al. 2004; Xue et al. 2011). On the other hand, MIR surveys have now mapped the entire celestial sphere, identifying millions of robust AGN candidates. In contrast, NuSTAR is unlikely to map more than 10–20 deg over its entire mission lifetime. In order to explore this MIR–X-ray complimentarity in the new regime offered by NuSTAR, we therefore briefly discuss the MIR colors of the ten serendipitous NuSTAR sources.
Only one of the ten NuSTAR sources (NuSTAR J063358+1742.4) has four-band Spitzer-IRAC detections, a requirement for the Spitzer MIR AGN selection criteria; NuSTAR J063358+1742.4 is fainter than the WISE flux limits but has IRAC colors that place it within the IRAC AGN wedge of Stern et al. (2005). Of the other nine NuSTAR sources, eight have at least two-band detections by WISE. Stern et al. (2012) and Assef et al. (2013) have recently developed WISE AGN selection criteria, effectively extending the Spitzer selection criteria across the full sky (see also Mateos et al. 2012; Wu et al. 2012). Five of the eight NuSTAR sources have WISE colors indicative of an AGN according to those criteria. The outliers include the two sources with the weakest AGN component (i.e., lowest values; see §3.2), NuSTAR J011042-4604.2 and NuSTAR JJ032459-0256.1. These are the only sources with , confirming that MIR selection misses sources where the AGN is not bolometrically dominant.
The final outlier is the HBL NuSTAR J121027+3929.1, a BL Lac-type blazar. Massaro et al. (2011) have recently published a series of papers discussing the WISE colors of blazars. While Flat-Spectrum Radio Quasars (FSRQ) type blazars have colors typical of other AGN populations (e.g., Yan et al. 2013), BL Lac-type blazars have unique colors. However, as NuSTAR J121027+3929.1 is only detected in the two shorter wavelength bandpasses of WISE, it is not possible to compare this source to the color criteria developed by Massaro et al. (2011) and Yan et al. (2013); note also the caveat emptor in Footnote 3 of Stern & Assef (2013).
4.4.2 Spectral energy distribution analysis
To quantify the UV–MIR emission of the NuSTAR sources we fitted the broad-band SEDs following §3.2; see Fig. 5 and Table 3. A significant AGN component () is required to explain the UV–MIR emission for all of the sources except for the low-luminosity system NuSTAR J032459-0256.1. The rest-frame 6 m luminosities of the NuSTAR sources ( (0.9–30) erg s, with the exception of NuSTAR J032459-0256.1, which has erg s) are in general agreement with that expected for the MIR–X-ray (i.e., 6 m–2–10 keV) luminosity relationship found for AGNs (e.g., Lutz et al. 2004; Fiore et al. 2009); we assumed to convert between rest-frame 2–10 keV and rest-frame 10–40 keV. However, we note that the HBL NuSTAR J121027+3929.1 and the highest-redshift source NuSTAR J115746+6004.9 are both X-ray bright compared to the strength of the AGN at 6 m, suggesting that the X-ray emission from these sources is probably beamed (as would be, at least, expected for an HBL).
In some cases the presence of dust reddening in the best-fitting SED solutions means that the observed contribution of the AGN at UV–optical wavelengths is negligible. However, we highlight here that, although the strength of the AGN continuum at UV–optical wavelengths plotted in Fig. 5 is inconsistent with the optical spectroscopy in some cases (e.g., NuSTAR J011042-4604.2 and NuSTAR J181428+3410.8), they are broadly consistent when the range in dust reddening from the best-fitting solution is taken into account; see Table 3. As expected on the basis of the simplest unified AGN model (e.g., Antonucci 1993), the optical emission is heavily extinguished in the NLAGNs ( 3–6 mags, which corresponds to 9–18 mags for ; e.g., Savage & Mathis 1979), with the exception of the low-luminosity system NuSTAR J032459-0256.1. There is evidence of dust-reddening for two of the BLAGNs (NuSTAR J181428+3410.8 has 2 mags and NuSTAR J183443+3237.8 has 0.6 mags) and, as we discuss in the Appendix, the reddening towards NuSTAR J183443+3237.8 appears to be variable. None of the other BLAGNs show evidence for significant obscuration at optical wavelengths, as expected for the simplest version of the unified AGN model for BLAGNs; however, we note that there is a large uncertainty in the dust reddening for NuSTAR J011042-4604.2, which is due to the limited number of photometric data points.
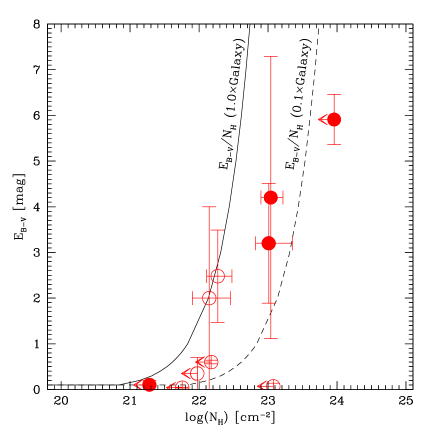
In Fig. 10 we compare the obscuration estimated from the UV–MIR SED fitting to that measured from the X-ray spectral fitting, which provides constraints on the dust-to-gas ratio in AGNs. The BLAGN with the strongest dust reddening (NuSTAR J181428+3410.8) has a measured X-ray absorbing column density of cm, consistent with that expected given the – relationship found in the Galaxy (e.g., Güver & Özel 2009). The constraints on the X-ray absorbing column density for the other four BLAGNs are also consistent with that expected given the – relationship found in the Galaxy; however, in all cases the column-density constraints are too weak to rule out the different – relationship found by Maiolino et al. (2001). By comparison, although the three NLAGNs with erg s (NuSTAR J063358+1742.4, NuSTAR J115912+4232.6, and NuSTAR J204021-0056.1) have evidence for significant obscuration, the inferred X-ray absorbing column density from the dust reddening measurements are lower than those directly measured from the X-ray spectral analyzes ( (2–4) cm, as compared to cm measured from the X-ray data). However, the dust-to-gas ratios are consistent with the lower – relationship found by Maiolino et al. (2001) for AGNs. Neither the HBL NuSTAR J121027+3929.1 nor the low-luminosity system NuSTAR J032459-0256.1 show evidence for significant obscuration in the UV–MIR and X-ray bands.
The best-fitting SED solutions also provide a first-order estimate of the host-galaxy stellar masses of the NuSTAR sources. The range of stellar masses is large, from (for the low-luminosity system NuSTAR J032459-0256.1) to (for the highest-redshift source NuSTAR J115746+6004.9). However, the stellar masses for the majority of the NuSTAR sources are relatively tightly constrained: the stellar-mass range with these two extreme sources removed is (0.7–3.3) , and the median stellar mass is . Many of the NuSTAR sources are BLAGNs and we caution that reliable stellar-mass constraints are challenging for these systems due to the contribution of the AGN to the rest-frame optical–near-IR emission (see §3.2 and Fig. 5 for the SED-fitting constraints). However, reassuringly, the median stellar mass of the NLAGNs, where accurate stellar-mass constraints are less challenging, is consistent with that of the BLAGNs when the two extreme sources are removed ( ).
The range and median stellar mass of the NuSTAR sources are similar to those of comparably distant AGNs detected at keV in Chandra and XMM-Newton surveys (e.g., Babić et al. 2007; Alonso-Herrero et al. 2008; Bundy et al. 2008; Xue et al. 2010; Lusso et al. 2011). However, by comparison, the median stellar mass of the NuSTAR sources is 5 times higher than for AGNs detected at keV by Swift-BAT ( ; Koss et al. 2011). To first order this suggests that there has been significant evolution in the characteristic mass of high-energy emitting AGNs over the redshift range 0–1. However, the NuSTAR sources are more luminous than the Swift-BAT AGNs and that could bias the results towards more massive systems. For example, for a constant average Eddington ratio, the order of magnitude higher median X-ray luminosity of the NuSTAR sources over the Swift-BAT AGNs (see §4.1) would lead to an order of magnitude higher black hole mass and thereby a larger stellar mass, assuming no evolution in the black-hole–spheroid mass relationship (e.g., Magorrian et al. 1998; Marconi & Hunt 2003; Gültekin et al. 2009). Indeed, Koss et al. (2011) show a weak trend between mean stellar mass and X-ray luminosity for the Swift-BAT AGNs. Therefore, while our results indicate that the most luminous high-energy emitting AGNs at 0.1 are hosted by more massive galaxies than high-energy emitting AGNs at , a systematic analysis of both local and distant AGNs taking account of potential X-ray luminosity biases, is required to derive more accurate constraints.
5. Conclusions
We have reported on the first ten identifications of NuSTAR sources serendipitously detected in the extragalactic survey programme. These NuSTAR sources are 100 times fainter than AGNs previously detected at keV and have a broad range in redshift and luminosity ( 0.020–2.923 and – erg s); the median redshift and luminosity are 0.7 and erg s, respectively. On the basis of broad-band 0.5–32 keV spectroscopy, optical spectroscopy, and broad-band UV–MIR SED analyzes we found the following results:
-
•
five (%) of the ten NuSTAR sources are classified as broad-line AGNs (BLAGNs), four (%) are classified as narrow-line AGNs (NLAGNs), and one is a BL Lac. The BLAGN:NLAGN ratio is consistent with that found for 10 keV selected AGNs in the local Universe. See §4.1.
-
•
from fitting the broad-band X-ray spectra we find that the dominant source population are quasars with erg s, of which 50% are obscured with cm. However, none of the seven quasars over the redshift range 0.5–1.1 are Compton thick and we place a 90% confidence upper limit of 33% on the Compton-thick quasar fraction. See §4.2.
-
•
from jointly fitting the rest-frame 10–40 keV data for all of the non-beamed sources with erg s we constrain the high-energy X-ray spectral slope and the average strength of a reflection component. We find for and and , consistent with that found for local AGNs selected at keV. See §4.3.
-
•
from fitting the UV–MIR SEDs we constrain the stellar masses of the host galaxies, finding a median stellar mass of . The host galaxies of NuSTAR sources are 5 times more massive on average than Swift-BAT-detected local AGNs at keV. At least part of this implied evolution in the characteristic mass of high-energy emitting AGNs is likely to be due to X-ray luminosity biases. See §4.4.
NuSTAR is providing unique insight into the high-energy properties of AGNs, achieving a factor 100 times improvement in sensitivity over previous observatories at keV. In the current study we do not find significant differences in the fraction of absorbed AGNs between the NuSTAR sources and nearby high-energy emitting AGNs, despite the NuSTAR sources being 10 times more luminous (and 5 times more massive), on average. These results therefore suggest that the central engine of distant high-energy emitting AGNs are similar to that of nearby AGNs. However, the current study is limited in source statistics and provides a first look at the high-energy properties of distant AGNs. With the 20–40 times improvement in sample size afford by the full NuSTAR extragalactic survey (completed in the first 2 years of NuSTAR observations) we will be able to make more detailed comparisons and accurately measure the high-energy properties of distant AGNs and constrain their evolution with redshift.
References
- (1)
- (2) Ajello, M., Greiner, J., Kanbach, G., et al. 2008, ApJ, 678, 102
- (3)
- (4) Ajello, M., Alexander, D. M., Greiner, J., et al. 2012, ApJ, 749, 21
- (5)
- (6) Aird, J., Nandra, K., Laird, E. S., et al. 2010, MNRAS, 401, 2531
- (7)
- (8) Akylas, A., Georgantopoulos, I., Georgakakis, A., Kitsionas, S., & Hatziminaoglou, E. 2006, A&A, 459, 693
- (9)
- (10) Alexander, D. M., et al. 2003a, AJ, 126, 539
- (11)
- (12) Alexander, D. M., et al. 2003b, AJ, 125, 383
- (13)
- (14) Alexander, D. M., Chary, R.-R., Pope, A., et al. 2008, ApJ, 687, 835
- (15)
- (16) Alonso-Herrero, A., Pérez-González, P. G., Rieke, G. H., et al. 2008, ApJ, 677, 127
- (17)
- (18) Antonucci, R. 1993, ARA&A, 31, 473
- (19)
- (20) Arnaud, K. A. 1996, Astronomical Data Analysis Software and Systems V, 101, 17
- (21)
- (22) Assef, R. J., Kochanek, C. S., Brodwin, M., et al. 2008, ApJ, 676, 286
- (23)
- (24) Assef, R. J., Kochanek, C. S., Brodwin, M., et al. 2010, ApJ, 713, 970
- (25)
- (26) Assef, R. J., Stern, D., Kochanek, C. S., et al. 2013, ApJ, in press (arXiv:1209.6055)
- (27)
- (28) Avni, Y. 1976, ApJ, 210, 642
- (29)
- (30) Babić, A., Miller, L., Jarvis, M. J., et al. 2007, A&A, 474, 755
- (31)
- (32) Baldwin, J. A., Phillips, M. M., & Terlevich, R. 1981, PASP, 93, 5
- (33)
- (34) Ballantyne, D. R., Everett, J. E., & Murray, N. 2006, ApJ, 639, 740
- (35)
- (36) Ballantyne, D. R., Draper, A. R., Madsen, K. K., Rigby, J. R., Treister, E. 2011, ApJ, 736, 56
- (37)
- (38) Barger, A. J., Cowie, L. L., Capak, P., et al. 2003, AJ, 126, 632
- (39)
- (40) Barger, A. J., Cowie, L. L., Mushotzky, R. F., et al. 2005, AJ, 129, 578
- (41)
- (42) Bassani, L., Molina, M., Malizia, A., et al. 2006, ApJ, 636, L65
- (43)
- (44) Baumgartner, W. H., Tueller, J., Markwardt, C. B., et al. 2012, ApJS, submitted (arXiv:1212.3336)
- (45)
- (46) Becker, R. H., White, R. L., & Helfand, D. J. 1995, ApJ, 450, 559
- (47)
- (48) Beckmann, V., et al. 2009, ApJ, 505, 417
- (49)
- (50) Bell, E. F., McIntosh, D. H., Katz, N., & Weinberg, M. D. 2003, ApJS, 149, 289
- (51)
- (52) Bird, A.J., et al. 2010, ApJS, 186, 1
- (53)
- (54) Bottacini, E. et al. 2012, ApJS, 201, 34
- (55)
- (56) Brandt, W. N., Alexander, D. M., Hornschemeier, A. E., et al. 2001, AJ, 122, 2810
- (57)
- (58) Brandt, W. N. & Alexander, D. M. 2010, PNAS, 107, 7184
- (59)
- (60) Brandt, W. N. & Hasinger, G. 2005, ARA&A, 43, 827
- (61)
- (62) Brightman, M., & Ueda, Y. 2012, MNRAS, 423, 702
- (63)
- (64) Brunner, H., Cappelluti, N., Hasinger, G., et al. 2008, A&A, 479, 283
- (65)
- (66) Bundy, K., Georgakakis, A., Nandra, K., et al. 2008, ApJ, 681, 931
- (67)
- (68) Burlon, D., Ajello, M., Greiner, J., et al. 2011, ApJ, 728, 58
- (69)
- (70) Caccianiga, A., Severgnini, P., Della Ceca, R., et al. 2008, A&A, 477, 735
- (71)
- (72) Cash, W. 1979, ApJ, 228, 939
- (73)
- (74) Comastri, A., et al. 2011, A&A, 526, L9
- (75)
- (76) Condon, J. J., Cotton, W. D., Greisen, E. W., et al. 1998, AJ, 115, 1693
- (77)
- (78) Dadina, M. 2008, A&A, 485, 417
- (79)
- (80) Del Moro, A., Alexander, D. M., Mullaney, J. R., et al. 2013, A&A, 549, A59
- (81)
- (82) Deluit, S., & Courvoisier, T. J.-L. 2003, A&A, 399, 77
- (83)
- (84) Donley, J. L., Rieke, G. H., Pérez-González, P. G., Rigby, J. R., & Alonso-Herrero, A. 2007, ApJ, 660, 167
- (85)
- (86) Donley, J. L., Koekemoer, A. M., Brusa, M., et al. 2012, ApJ, 748, 142
- (87)
- (88) Eckart, M. E., McGreer, I. D., Stern, D., Harrison, F. A., & Helfand, D. J. 2010, ApJ, 708, 584
- (89)
- (90) Eisenhardt, P. R. M., Wu, J., Tsai, C.-W., et al. 2012, ApJ, 755, 173
- (91)
- (92) Faber, S., et al. 2003, SPIE, 4841, 1657
- (93)
- (94) Farrell et al. (2009): Farrell, S. A., Webb, N. A., Barret, D., Godet, O., & Rodrigues, J. M. 2009, Nature, 460, 73
- (95)
- (96) Fazio, G. G., Hora, J. L., Allen, L. E., et al. 2004, ApJS, 154, 10
- (97)
- (98) Fiore, F., Puccetti, S., Brusa, M., et al. 2009, ApJ, 693, 447
- (99)
- (100) Fossati, G., Celotti, A., Ghisellini, G., & Maraschi, L. 1997, MNRAS, 289, 136
- (101)
- (102) Freeman, P. E., Kashyap, V., Rosner, R., & Lamb, D. Q. 2002, ApJS, 138, 185
- (103)
- (104) Frontera, F., Orlandini, M., Landi, R., et al. 2007, ApJ, 666, 86
- (105)
- (106) Fruscione, A., McDowell, J. C., Allen, G. E., et al. 2006, Proc. SPIE, 6270
- (107)
- (108) Geach, J. E., Alexander, D. M., Lehmer, B. D., et al. 2009, ApJ, 700, 1
- (109)
- (110) Gehrels, N. 1986, ApJ, 303, 336
- (111)
- (112) Giacconi, R., Gursky, H., Paolini, F. R., & Rossi, B. B. 1962, Physical Review Letters, 9, 439
- (113)
- (114) Gioia, I. M., Maccacaro, T., Schild, R. E., et al. 1990, ApJS, 72, 567
- (115)
- (116) Gilli, R., Comastri, A., & Hasinger, G. 2007, A&A, 463, 79
- (117)
- (118) Goulding, A. D., Alexander, D. M., Mullaney, J. R., et al. 2011, MNRAS, 411, 1231
- (119)
- (120) Gültekin, K., Richstone, D. O., Gebhardt, K., et al. 2009, ApJ, 698, 198
- (121)
- (122) Güver, T., & Özel, F. 2009, MNRAS, 400, 2050
- (123)
- (124) Hambly et al. 2001, MNRAS, 326, 1279
- (125)
- (126) Harrison, F. A., Eckart, M. E., Mao, P. H., Helfand, D. J., & Stern, D. 2003, ApJ, 596, 944
- (127)
- (128) Harrison, F. A., et al. 2013, ApJ, 770, 103
- (129)
- (130) Hasinger, G. 2008, A&A, 490, 905
- (131)
- (132) Hasinger, G., Miyaji, T., & Schmidt, M. 2005, A&A, 441, 417
- (133)
- (134) Hasinger, G., Cappelluti, N., Brunner, H., et al. 2007, ApJS, 172, 29
- (135)
- (136) Hickox, R. C., & Markevitch, M. 2006, ApJ, 645, 95
- (137)
- (138) Hook, I. M., Jørgensen, I., Allington-Smith, J. R., et al. 2004, PASP, 116, 425
- (139)
- (140) Kim, D.-W., Cameron, R. A., Drake, J. J., et al. 2004, ApJS, 150, 19
- (141)
- (142) Koss, M., Mushotzky, R., Veilleux, S., et al. 2011, ApJ, 739, 57
- (143)
- (144) Krivonos, R., Revnivtsev, M., Lutovinov, A., et al. 2007, A&A, 475, 775
- (145)
- (146) La Franca, F., Fiore, F., Comastri, A., et al. 2005, ApJ, 635, 864
- (147)
- (148) Lehmer, B. D., Brandt, W. N., Alexander, D. M., et al. 2005, ApJS, 161, 21
- (149)
- (150) Lehmer, B. D., Xue, Y. Q., Brandt, W. N., et al. 2012, ApJ, 752, 46
- (151)
- (152) Luo, B., et al. 2008, ApJS, 179, 19
- (153)
- (154) Luo, B., et al. 2013, ApJ, in press
- (155)
- (156) Lusso, E., Comastri, A., Vignali, C., et al. 2011, A&A, 534, A110
- (157)
- (158) Lutz, D., Maiolino, R., Spoon, H. W. W., & Moorwood, A. F. M. 2004, A&A, 418, 465
- (159)
- (160) Lyons, L. 1991, A Practical Guide to Data Analysis for Physical Science Students, by Louis Lyons, pp. 107. ISBN 0521414156. Cambridge, UK: Cambridge University Press, November 1991
- (161)
- (162) Magorrian, J., Tremaine, S., Richstone, D., et al. 1998, AJ, 115, 2285
- (163)
- (164) Magdziarz, P., & Zdziarski, A. A. 1995, MNRAS, 273, 837
- (165)
- (166) Maiolino, R., Marconi, A., Salvati, M., et al. 2001, A&A, 365, 28
- (167)
- (168) Malizia, A., Bassani, L., Bazzano, A., et al. 2012, MNRAS, 426, 1750
- (169)
- (170) Marconi, A., & Hunt, L. K. 2003, ApJ, 589, L21
- (171)
- (172) Markwardt, C. B., Tueller, J., Skinner, G. K., et al. 2005, ApJ, 633, L77
- (173)
- (174) Martin, D. C., Fanson, J., Schiminovich, D., et al. 2005, ApJ, 619, L1
- (175)
- (176) Maselli, A., Giommi, P., Perri, M., et al. 2008, A&A, 479, 35
- (177)
- (178) Massaro, F., D’Abrusco, R., Ajello, M., Grindlay, J. E., & Smith, H. A. 2011, ApJ, 740, L48
- (179)
- (180) Mateos, S., Alonso-Herrero, A., Carrera, F. J., et al. 2012, MNRAS, 426, 3271
- (181)
- (182) Minkowski, R. L., & Abell, G. O. 1963, Basic Astronomical Data: Stars and Stellar Systems, 481
- (183)
- (184) Molina, M., Bassani, L., Malizia, A., et al. 2009, MNRAS, 399, 1293
- (185)
- (186) Moretti, A., Pagani, C., Cusumano, G., et al. 2009, A&A, 493, 501
- (187)
- (188) Morris, S. L., Stocke, J. T., Gioia, I. M., et al. 1991, ApJ, 380, 49
- (189)
- (190) Nandra, K., & Pounds, K. A. 1994, MNRAS, 268, 405
- (191)
- (192) Nousek, J. A., & Shue, D. R. 1989, ApJ, 342, 1207
- (193)
- (194) Oke, J. B., Cohen, J. G., Carr, M., et al. 1995, PASP, 107, 375
- (195)
- (196) Padovani, P., & Giommi, P. 1995, ApJ, 444, 567
- (197)
- (198) Penzias, A. A., & Wilson, R. W. 1965, ApJ, 142, 419
- (199)
- (200) Piconcelli, E., Jimenez-Bailón, E., Guainazzi, M., et al. 2005, A&A, 432, 15
- (201)
- (202) Reeves, J. N., & Turner, M. J. L. 2000, MNRAS, 316, 234
- (203)
- (204) Reuland, M., van Breugel, W., Röttgering, H., et al. 2003, ApJ, 592, 755
- (205)
- (206) Revnivtsev, M., Sazonov, S., Jahoda, K., & Gilfanov, M. 2004, A&A, 418, 927
- (207)
- (208) Risaliti, G., Maiolino, R., & Salvati, M. 1999, ApJ, 522, 157
- (209)
- (210) Sambruna, R. M., Maraschi, L., & Urry, C. M. 1996, ApJ, 463, 444
- (211)
- (212) Savage, B. D., & Mathis, J. S. 1979, ARA&A, 17, 73
- (213)
- (214) Sazonov, S. Y., & Revnivtsev, M. G. 2004, A&A, 423, 469
- (215)
- (216) Scoville, N., Aussel, H., Brusa, M., et al. 2007, ApJS, 172, 1
- (217)
- (218) Skrutskie, M. F., Cutri, R. M., Stiening, R., et al. 2006, AJ, 131, 1163
- (219)
- (220) Stern, D., Eisenhardt, P., Gorjian, V., et al. 2005, ApJ, 631, 163
- (221)
- (222) Stern, D., Assef, R. J., Benford, D. J., et al. 2012, ApJ, 753, 30
- (223)
- (224) Stern, D., & Assef, R. J. 2013, ApJ, 764, L30
- (225)
- (226) Stocke, J. T., Liebert, J., Schmidt, G., et al. 1985, ApJ, 298, 619
- (227)
- (228) Swartz, D. A., Soria, R., Tennant, A. F., & Yukita, M. 2011, ApJ, 741, 49
- (229)
- (230) Szokoly, G. P., Bergeron, J., Hasinger, G., et al. 2004, ApJS, 155, 271
- (231)
- (232) Treister, E., Cardamone, C. N., Schawinski, K., et al. 2009, ApJ, 706, 535
- (233)
- (234) Treister, E., & Urry, C. M. 2006, ApJ, 652, L79
- (235)
- (236) Treister, E., Urry, C. M., & Virani, S. 2009, ApJ, 696, 110
- (237)
- (238) Tueller, J., Mushotzky, R. F., Barthelmy, S., et al. 2008, ApJ, 681, 113
- (239)
- (240) Tueller, J., et al. 2010, ApJS, 186, 378
- (241)
- (242) Ueda, Y., Akiyama, M., Ohta, K., & Miyaji, T. 2003, ApJ, 598, 886
- (243)
- (244) Urry, C. M., Scarpa, R., O’Dowd, M., et al. 2000, ApJ, 532, 816
- (245)
- (246) Vasudevan, R. V., Brandt, W. N., Mushotzky, R. F., et al. 2013, ApJ, 763, 111
- (247)
- (248) Veilleux, S., & Osterbrock, D. E. 1987, ApJS, 63, 295
- (249)
- (250) Watson, M. G., Schröder, A. C., Fyfe, D., et al. 2009, A&A, 493, 339
- (251)
- (252) Winter, L. M., Mushotzky, R. F., Reynolds, C. S., & Tueller, J. 2009, ApJ, 690, 1322
- (253)
- (254) Worsley, M. A., Fabian, A. C., Bauer, F. E., et al. 2005, MNRAS, 357, 1281
- (255)
- (256) Wright, E. L., Eisenhardt, P. R. M., Mainzer, A. K., et al. 2010, AJ, 140, 1868
- (257)
- (258) Wu, X.-B., Hao, G., Jia, Z., Zhang, Y., & Peng, N. 2012, AJ, 144, 49
- (259)
- (260) Xue, Y.Q., et al. 2010, ApJ, 720, 368
- (261)
- (262) Xue, Y. Q., et al. 2011, ApJS, 195, 10
- (263)
- (264) Xue, Y. Q., Wang, S. X., Brandt, W. N., et al. 2012, ApJ, 758, 129
- (265)
- (266) Yan, L., Donoso, E., Tsai, C.-W., et al. 2013, AJ, 145, 55
- (267)
- (268) Yang, Y., Zabludoff, A., Tremonti, C., Eisenstein, D., & Davé, R. 2009, ApJ, 693, 1579
- (269)
- (270) York, D. G., Adelman, J., Anderson, J. E., Jr., et al. 2000, AJ, 120, 1579
- (271)
| Target Field | HLX 1 | NGC 1320 | Geminga | SDSS J1157+6003 | IC 751 | NGC 4151 | Cen X-4 | WISE J1814+3412 | 3C 382 | AE Aqr |
|---|---|---|---|---|---|---|---|---|---|---|
| Observatory | NuSTAR | NuSTAR | NuSTAR | NuSTAR | NuSTAR | NuSTAR | NuSTAR | NuSTAR | NuSTAR | NuSTAR |
| Observation | 30001030002 | 60061036002 | 30001029(002–028) | 60001071002 | 60061217004 | 60001111005 | 30001004002 | 6000111402 | 60061286002 | 30001120004 |
| Start date | 2012-11-19 | 2012-10-25 | 2012-09-26 | 2012-10-28 | 2013-02-04 | 2012-11-14 | 2013-01-20 | 2012-10-30 | 2012-09-18 | 2012-09-05 |
| Exposure | 177.1 ks | 14.5 ks | 142.6 ks | 21.7 ks | 56.1 ks | 61.8 ks | 116.4 ks | 21.3 ks | 16.6 ks | 71.3 ks |
| Observatory | Swift-XRT | Swift-XRT | Chandra | Chandra | Swift-XRT | XMM-Newton | XMM-Newton | Swift-XRT | XMM-Newton | |
| Observation | 00031287003 | 00080314001 | 7592 | 5698 | 00080073001 | 0144900101 | 0693750101 | 00080217001 | 0111180201 | |
| Start date | 2008-11-07 | 2012-10-26 | 2007-08-27 | 2005-06-03 | 2012-11-20 | 2003-03-01 | 2012-10-07 | 2012-09-18 | 2001-11-07 | |
| Exposure | 11.3 ks | 6.8 ks | 77.1 ks | 7.0 ks | 1.1 ks | 55.3 ks | 29.6 ks | 6.6 ks | 4.3 ks |
Note. — the nominal on-axis exposure time (for NuSTAR the exposure is from FPMA), corrected for background flaring and bad events; the range of observation numbers that have been combined to produce the final image (only the 15 observations ending in even numbers are used).
| Target Field | HLX 1 | NGC 1320 | Geminga | SDSS J1157+6003 | IC 751 | NGC 4151 | Cen X4 | WISE J1814+3412 | 3C 382 | AE Aqr |
|---|---|---|---|---|---|---|---|---|---|---|
| Source Name | 011042-4604.2 | 032459-0256.1 | 063358+1742.4 | 115746+6004.9 | 115912+4232.6 | 121027+3929.1 | 145856-3135.5 | 181428+3410.8 | 183443+3237.8 | 204021-0056.1 |
| RA (J2000) | 01:10:42.7 | 03:24:59.5 | 06:33:58.2 | 11:57:46.2 | 11:59:12.4 | 12:10:27.0 | 14:58:56.6 | 18:14:28.2 | 18:34:43.6 | 20:40:21.0 |
| DEC (J2000) | 46:04:17 | 02:56:09 | +17:42:25 | +60:04:55 | +42:32:37 | +39:29:07 | 31:35:34 | +34:10:51 | +32:37:52 | 00:56:06 |
| Exposure (A) | 159.8 | 8.0 | 92.4 | 18.2 | 31.0 | 42.1 | 27.4 | 18.4 | 9.2 | 52.4 |
| Exposure (B) | 159.4 | 5.9 | 93.0 | 18.5 | 31.2 | 39.9 | 46.0 | 20.0 | 9.6 | 51.7 |
| 3–24 keV (A) | () | |||||||||
| 3–8 keV (A) | () | () | ||||||||
| 8–24 keV (A) | () | () | ||||||||
| 3–24 keV (B) | () | |||||||||
| 3–8 keV (B) | () | |||||||||
| 8–24 keV (B) | () | () | () | |||||||
| Aperture | 45 | 60 | 45 | 45 | 45 | 30 | 45 | 45 | 45 | 45 |
| Flux (3–24 keV) | 1.3 | 9.2 | 0.8 | 1.2 | 5.6 | 12.1 | 0.6 | 0.9 | 3.5 | 1.6 |
| Flux (3–8 keV) | 0.4 | 3.9 | 0.3 | 0.5 | 1.9 | 6.7 | 0.2 | 0.3 | 1.1 | 0.7 |
| Flux (8–24 keV) | 0.8 | 5.8 | 0.6 | 0.7 | 4.1 | 5.9 | 0.9 | 0.7 | 3.2 | 1.0 |
| X-ray offset | 4.3 | 7.6 | 0.9 | 4.6 | 4.9 | 6.5 | 9.9 | 8.6 | 4.5 | |
| Flux (3–8 keV; other data) | 0.8 | 2.7 | 0.2 | 0.8 | 7.5 | 0.4 | 0.4 | 1.5 | 0.7 |
Note. — source name (NuSTAR J), based on the counts-weighted NuSTAR source position following the IAU source-name convention (see Footnote 3); counts-weighted NuSTAR source position measured in the 3–24 keV energy band (see §2.1.4); effective exposure at the source position in FPMA and FPMB in units of ks. The effective exposure is measured from the exposure maps (see §2.1.1); net counts, 1 uncertainties, and 3 upper limits measured at the counts-weighted NuSTAR source position in the 3–24 keV, 3–8 keV, and 8–24 keV bands for FPMA and FPMB (see §2.1.2). The values in parentheses indicate a lower significance counterpart (see §2.1.1); radius (in arcseconds) of the circular aperture used to measure the source photometry (see §2.1.2); aperture-corrected flux in the 3–24 keV, 3–8 keV, and 8–24 keV energy bands in units of erg s cm (see §2.1.3); positional offset (in arcseconds) between the counts-weighted NuSTAR source position and the closest source detected in the lower-energy X-ray data (i.e., Chandra, Swift-XRT, XMM-Newton). See Table 1; low-count source and is used to convert the NuSTAR count rates into fluxes; flux at 3–8 keV measured from the lower-energy X-ray data (either Chandra, Swift-XRT, or XMM-Newton; see Table 1) in units of erg s cm (see §2.2).