Observation of a narrow baryon resonance with positive strangeness formed in Xe collisions
Abstract
The charge-exchange reaction is investigated using the data of the DIANA experiment. The distribution of the effective mass shows a prominent enhancement near 1538 MeV formed by nearly 80 events above the background, whose width is consistent with being entirely due to the experimental resolution. Under the selections based on a simulation of Xe collisions, the statistical significance of the signal reaches 5.5. We interpret this observation as strong evidence for formation of a pentaquark baryon with positive strangeness, , in the charge-exchange reaction on a bound neutron. The mass of the baryon is measured as MeV. Using the ratio between the numbers of resonant and non-resonant charge-exchange events in the peak region, the intrinsic width of this baryon resonance is determined as MeV.
PACS numbers: 13.75.Jz, 25.80.Nv
1 Introduction
The baryons built of four quarks and an antiquark as the lowest Fock component, referred to as pentaquarks, are not forbidden by theory and have been discussed ever since the appearance of the quark model [1]. The critical prediction by Diakonov, Petrov and Polyakov [2] has been that the lightest explicitly exotic baryon with positive strangeness, the , must be relatively light and narrow, which would have made its experimental observation rather difficult. Specifically, they predicted the mass MeV and width MeV for the , the lightest member of the pentaquark antidecuplet, that should decay to the and final states. More recent theoretical analyses suggest that the intrinsic width may be on the order of 1 MeV or even less [3].
Narrow peaks near 1540 MeV in the and mass spectra were initially detected in low-energy photoproduction by LEPS [4] and in the charge-exchange reaction by DIANA [5]. Subsequently, both experiments were able to confirm their initial observations [6, 7, 8]. Moreover, increasing the statistics of the charge-exchange reaction allowed DIANA to directly estimate the intrinsic width: MeV [7, 8]. More recently, observation of a narrow peak near 1.54 GeV in the missing mass of the meson in the reaction was reported by a group from the CLAS collaboration [9]. Other searches for the baryon in different reactions and experimental conditions yielded both positive and negative results, see the review papers [10] and [11] and references therein. The bulk of null results can be probably explained by the extreme smallness of the width that implies the smallness of production cross-sections [12]. Azimov et al. [13] argue that the published null results fail to rule out the existing positive evidence, and advocate a new approach to detecting the in hard collisions.
The charge-exchange reaction on a bound neutron, that is investigated by DIANA and BELLE [14], is particularly interesting because it allows to probe the intrinsic width in a model-independent manner. The existing data on low-energy scattering have been found to leave room for a resonance with mass near 1540 MeV, provided that its width is less than 1 MeV [15, 16, 17, 18, 19]. An important advantage of the reaction is that the strangeness of the final-state system is a priori known to be positive. In this paper, the DIANA data on the charge-exchange reaction are analyzed using nearly 2.5 times more statistics than in [5].
2 The experiment and the data
The DIANA bubble chamber [20] filled with liquid Xenon was exposed to a separated beam with momentum of 850 MeV from the 10-GeV proton synchrotron at ITEP, Moscow. The density and radiation length of the fill were 2.2 g/cm3 and 3.7 cm, respectively. The chamber had a fiducial volume of cm3 viewed by four optical cameras, and operated without magnetic field. In the fiducial volume of the bubble chamber, momentum varies from MeV for entering kaons to zero for those that range out through ionization. Throughout this momentum interval, all collisions and decays of incident mesons are efficiently detected. The momentum at interaction point is determined from the spatial distance between the detected vertex and the mean position of the vertices due to decays of stopping mesons. The estimate of the momentum based on the measured position of the interaction vertex has been verified by detecting and reconstructing the decays in flight, which provided an independent estimate of the momentum. Charged secondaries are identified by ionization and momentum-analyzed by their range in Xenon. The detection efficiency for -quanta with MeV is close to 100%.
On total, some tracks of incident mesons have been recorded on film. Scanning of the film yielded nearly 55,000 events with visible decays, and , inside the fiducial volume of the bubble chamber. The ratio between the numbers of detected and decays is consistent with the ratio between the corresponding branching fractions [21]. These decays could be associated with primary Xe vertices with various multiplicities of secondary particles. Finally, events that featured a decay, a measurable proton with track length over some 3.5 mm, and no additional measurable or stub-like protons in the final state, were selected as candidates for the charge-exchange reaction free of intranuclear rescatterings. The decays with a large spatial angle between the decay pions, , were rejected.
The selected events are then fully measured and reconstructed in space using specially designed stereo-projectors. In a selected event, we measure the polar and azimuthal angles of the and proton with respect to the direction, similar angles of the and with respect to the parent direction, and the proton and pion ranges in Xenon. We additionally measure the opening angle between the and proton directions which allows the most accurate estimate of the effective mass. The momentum is estimated by range for the proton, and by kinematic reconstruction for the using the ranges and emission angles of decay pions. For further rejection of mesons that may have scattered by small angles in liquid Xenon but passed the pointback criteria, we then apply the selection where is the measured proper lifetime and is its tabulated mean value [21]. The quality of the data is best reflected by the experimental resolution on effective mass of the system, estimated as MeV by error propagation for observed events and by a simulation. As expected, the resolution on the effective mass is similar to the instrumental width of the peak, MeV, previously observed in the antiproton exposure of DIANA [22, 5]. Further details on the experimental procedure may be found in [23, 24, 7].
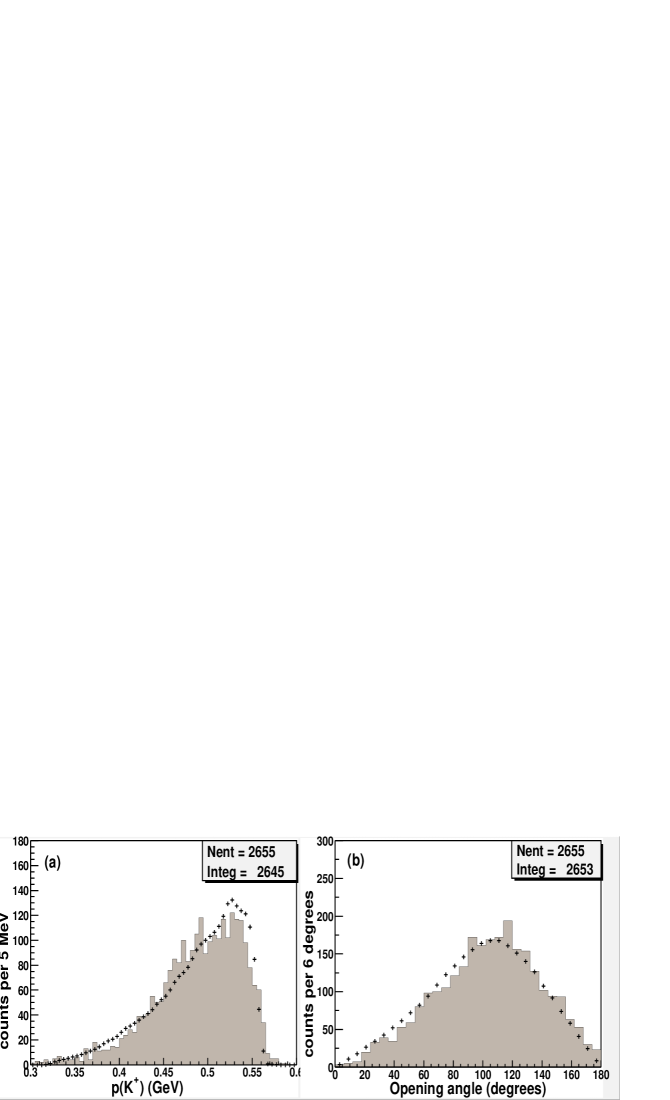
The measurements have been restricted to the region mm, where is the length of the path in liquid Xenon before the collision. (Note that there is no one-to-one correspondence between and momentum, because the original beam momentum varied by some MeV in different exposures.) The laboratory momentum of the incident at collision point is shown in Fig. 1a for all measured events of the reaction with and proton momenta above 155 and 165 MeV, respectively (instrumental thresholds). The measured opening angle between the and proton directions is shown in Fig. 1b. The dataset comprises the data treated in our initial analysis [5] and the subsequent measurements. The statistics of the charge-exchange reaction has been increased by a factor as compared to [5].
3 The Monte-Carlo description of the data
Rescattering of either the or proton in the Xenon nucleus distorts the effective mass of the system originally formed in the charge-exchange reaction on a bound neutron. In formulating the selection criteria for unrescattered events, we rely on a Monte-Carlo simulation of and collisions in nuclear medium. We simulate the original collision that may be either , , or , and then follow the development of the intranuclear cascade that also involves the elastic NN reactions , , , and . In order to reproduce the experimental selections for the measured events, we then select those simulated events that feature a final-state with lab momentum MeV and , a proton with MeV, and no extra protons with MeV which corresponds to the experimental threshold for proton detection. On the other hand, any number of emitted neutrons is allowed.
The cross-sections of the aforementioned and reactions as functions of collision energy are parametrized using the existing data [25, 26, 27]. We substitute , and invoke the isospin relations and for the elastic cross sections that have not been measured directly. The effective radius of the target nucleus is taken in the form fm where for Xenon, and the neutron and proton densities are assumed to be uniform throughout the nucleus volume. For the same nucleus, we use a realistic form of the Fermi-momentum distribution with maximum near 160 MeV [28]. For the unbound nucleons, Pauli blocking is approximated by the cut MeV on nucleon momentum, and absorption is treated according to [29]. For the real intranuclear potentials of the nucleon and the meson in the Xenon mucleus, we assume MeV and MeV [26, 30]. The flux of incident mesons as a function of momentum at collision point is inferred from the observed distribution of range in Xenon before interaction or decay, see [5]. The experimental losses of soft protons and mesons, that largely occur at lab momenta below some 200 MeV, are accounted for. The experimental uncertainties and measurement errors are included in the simulation. The simulation adequately reproduces the proportion among the numbers of scanned events with different multiplicities of detected protons.
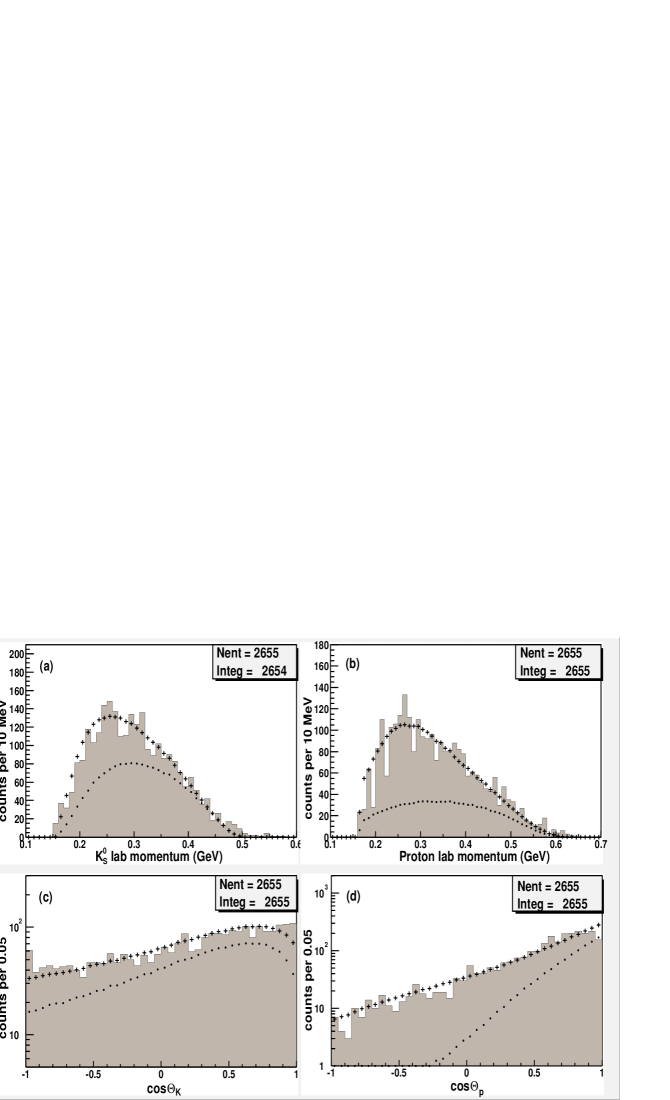
In Figures 2 and 3, some distributions of measured (or live) events are compared with those of simulated events. Here and in what follows, the total number of simulated events is normalized to that of live events prior to analysis selections. Laboratory momenta of the and proton are shown in Figs. 2a and 2b, and their emission angles with respect to the incident — in Figs. 2c and 2d. Shown by dots in Figs. 2a and 2c are the simulated spectra of unrescattered mesons (in the same event, the proton may rescatter or not). Simularly, the dots in Figs. 2b and 2d are the spectra of unrescattered protons (the may rescatter or not). More originally-produced mesons than protons are seen to escape from the nucleus without rescattering. On average, the rescattered mesons and protons have smaller momenta and broader emission angles than the unrescattered ones. Therefore, rejecting the mesons and protons that travel in the backward hemisphere in lab will enhance the fraction of rescattering-free events (those in which both products of the primary collision escaped from the nucleus without rescattering).
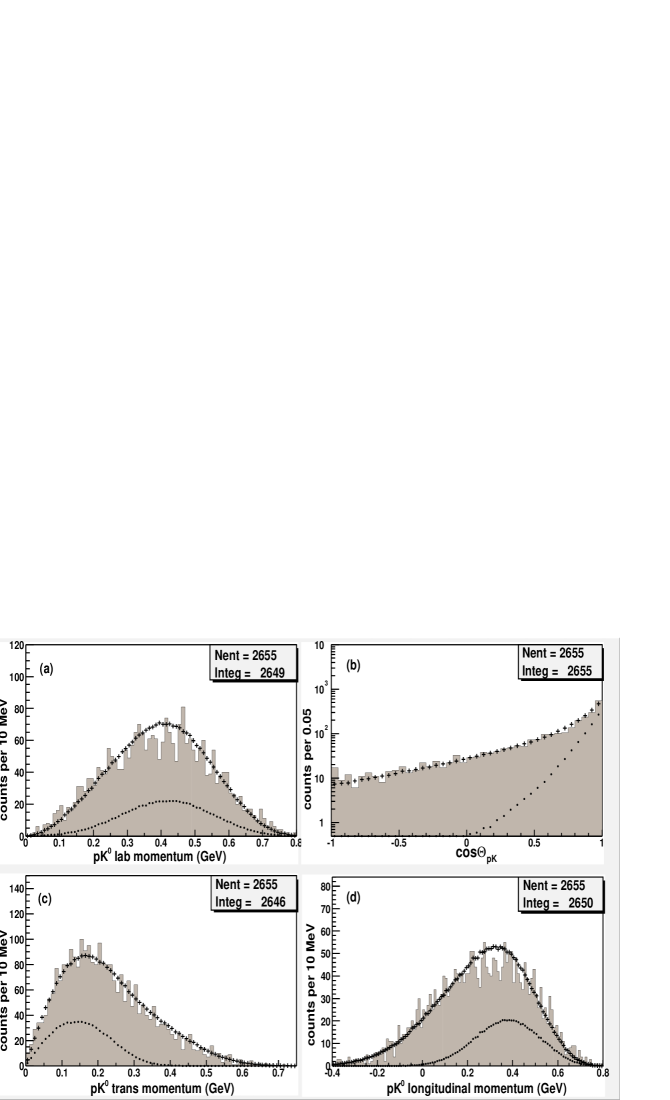
The quantities that describe the system as a whole are plotted in Fig. 3. Here, the dots refer to the rescattering-free collisions. The distributions of rescattering-free and rescattered events have similar shapes for the absolute lab momentum of the pair (Fig. 3a), but very different shapes for its transverse and longitudinal components and , see Figs. 3c and 3d. The bulk of rescattering-free events lie in the region MeV, whereas the rescattered events transcend the domain of target Fermi-motion by reaching up to some 600 MeV. On the other hand, the simulation predicts that rescattering-free events should populate the region MeV unlike the rescattered ones that extend to negative values of . As a result, the rescattered systems are emitted at broader angles to the beam than the unrescattered ones, see Fig. 3b. Therefore, the fraction of rescattered events will be reduced by rejecting events with large and small of the emitted system, or those emitted at broad angles to the beam.
4 The signal of the baryon prior to analysis selections
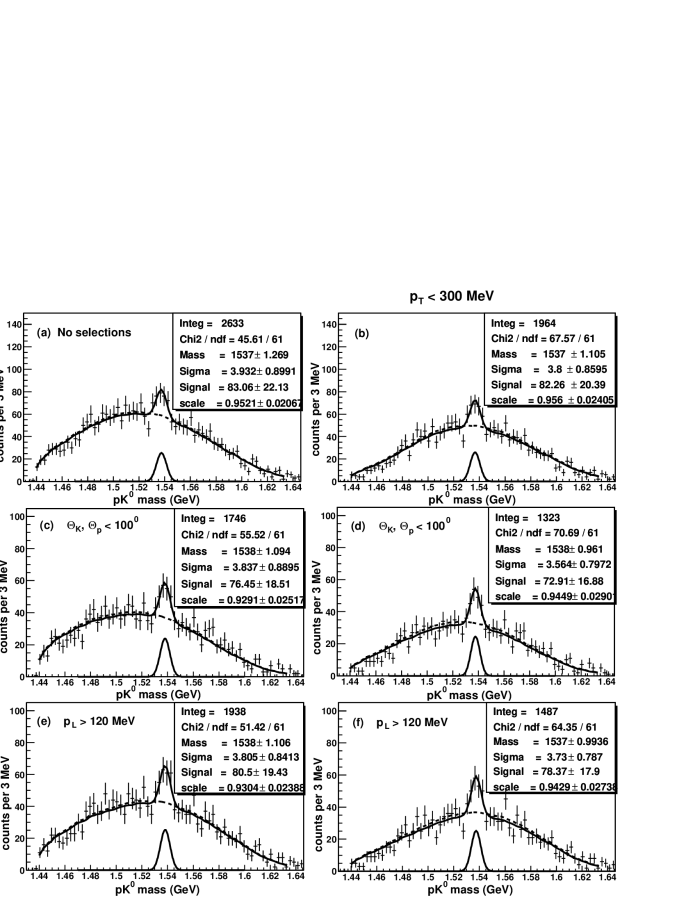
The effective-mass spectrum for all measured events of the reaction , that is shown in Fig. 4a, is enhanced in the region MeV. This distribution is fitted to a Gaussian plus a background function, constructed by scaling the simulated distribution by a factor that is treated as a free parameter of the fit. (In this and subsequent fits, the maximum-likelihood algorithm is used.) The fitted position of the enhancement is close to 1538 MeV, and its fitted width is consistent with the simulated experimental resolution on : MeV. As compared with our initial analysis [5], the fitted signal has increased in magnitude according to the increase of the total statistics of measured events. The same distribution is also fitted to the background function alone, which corresponds to the null hypothesis. (This is shown by the dashed line in Fig. 4a.) The naive estimate of statistical significance is , where the signal and background have been derived from the signal hypothesis alone over the 90% area of the Gaussian.
For formation of the putative pentaquark baryon in the reaction on a free stationary neutron, the resonant value of beam momentum is MeV. For formation on a bound neutron, will be shifted up by some 50 MeV by the intranuclear potential, and smeared by Fermi motion of the neutron target. Despite the smearing of the resonance lineshape in by nuclear effects, a combined analysis of the two variables may prove to be more sensitive to formation than the analysis of alone. The scatter plot in and for all live events, shown in Fig. 5a, is indeed enhanced in the region MeV and MeV. The corresponding scatter plot for simulated events proves to be regular over the full area of and , see Fig. 5b. In Fig. 5a, the distribution of live events is fitted to a two-dimensional Gaussian plus a background function, again constructed by scaling the simulated distribution by a factor which is a free parameter of the fit. The same distribution has also been fitted to the background function alone, which corresponds to the null hypothesis.
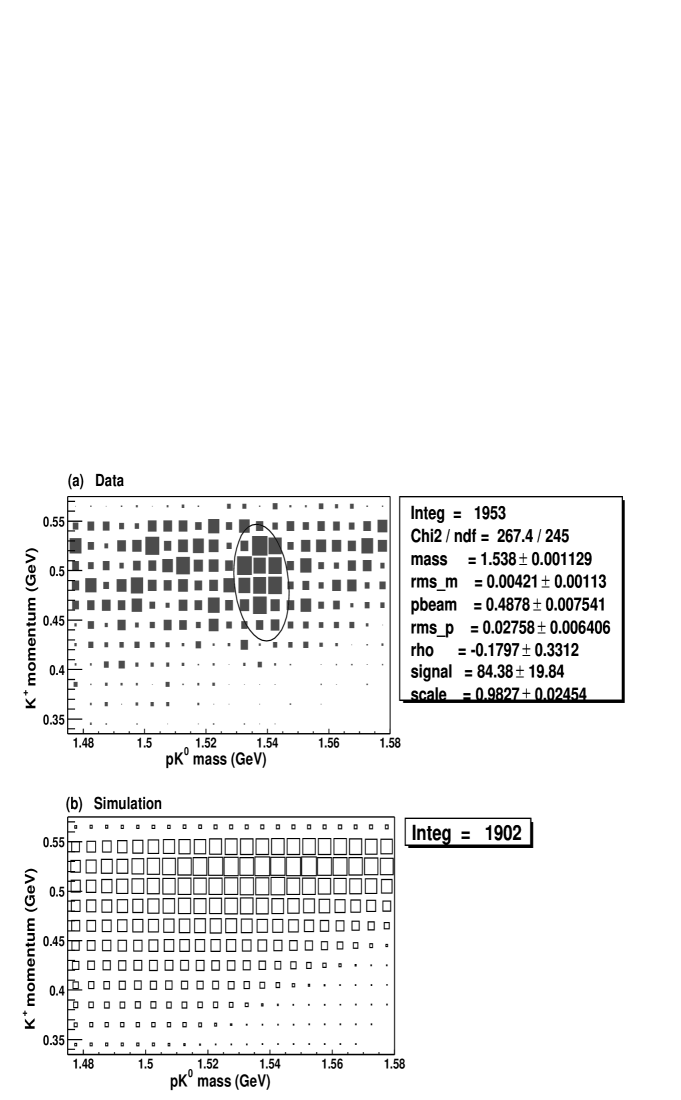
The correlation parameter of the two-dimensional Gaussian (line 7 in the box in Fig. 5a) is consistent with , as physically expected for formation of a narrow resonance. The enhancement is centered at MeV and MeV, see lines 3 and 5 in the box. The rms width of the enhancement in is consistent with the experimental resolution, and that in is MeV (lines 4 and 6 in the box). The observed spread of the signal in is consistent with the smearing of a narrow resonance by nuclear effects [7]. The fitted signal (line 8) is in good agreement with the one-dimensional signal in Fig. 4a, but proves to be more significant : . This is because the fitted signal is spread over a narrower interval of than the nonresonant background.
5 Applying additional selections
In order to verify that the enhancement at MeV is formed by rescattering-free events, as expected for the signal of a narrow resonance, one has to use additional selections that reduce the fraction of rescattered events. We apply the following selections:
-
1.
and for the and proton emission angles, suggested by the distributions of these variables shown in Figs. 2c and 2d. This selection has already been used in our previous papers [5, 7, 8], and was found to produce no artificial structures in the spectrum by an independent theoretical analysis [31]. The simulation predicts that this selection retains 77% of all rescattering-free events.
-
2.
MeV for the longitudinal lab momentum of the system, as suggested by the data shown in Fig. 3d. The acceptance to simulated rescattering-free events is %.
The effects of the selections and MeV are shown in Figs. 4c and 4e, respectively. Each mass spectrum is fitted to a Gaussian plus a background function, that is constructed by scaling the simulated distribution under similar selections. The signal and null fits are shown by the solid and dashed lines, respectively. The value of is 5.6 for the enhancement in Fig. 4c, and 5.5 for that in Fig. 4e. Each additional selection is seen to render the signal more significant than in Fig. 4a. The selection MeV, that is suggested by the data of Fig. 3c, is additionally applied in the right-hand panels of Fig. 4. This further increases the value by .
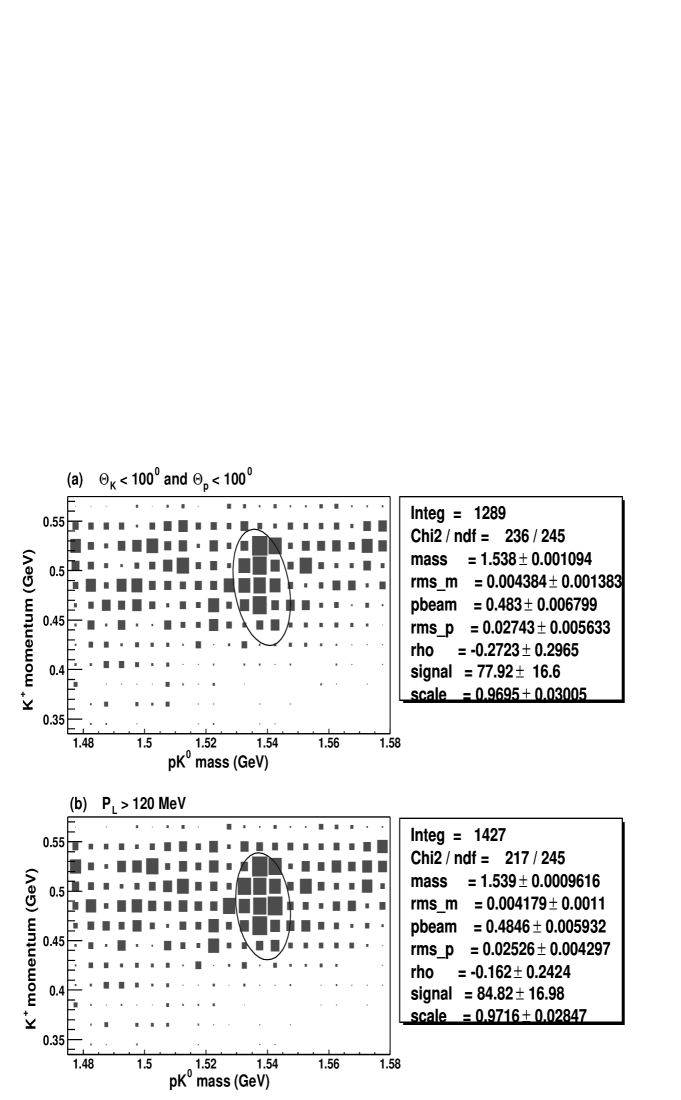
The experimental scatter plots in and under the selections and MeV are shown and fitted in Figs. 6a and 6b, respectively. (The simulated scatter plots under these selections are again regular throughout the full area of and .) The positions and rms widths of the enhancement are consistent with those in Fig. 5. The two-dimensional signals in Figs 6a and 6b are similar in magnitude to the corresponding one-dimensional signals in Figs. 4c and 4e, but have higher values of (5.8 and 6.2, respectively).
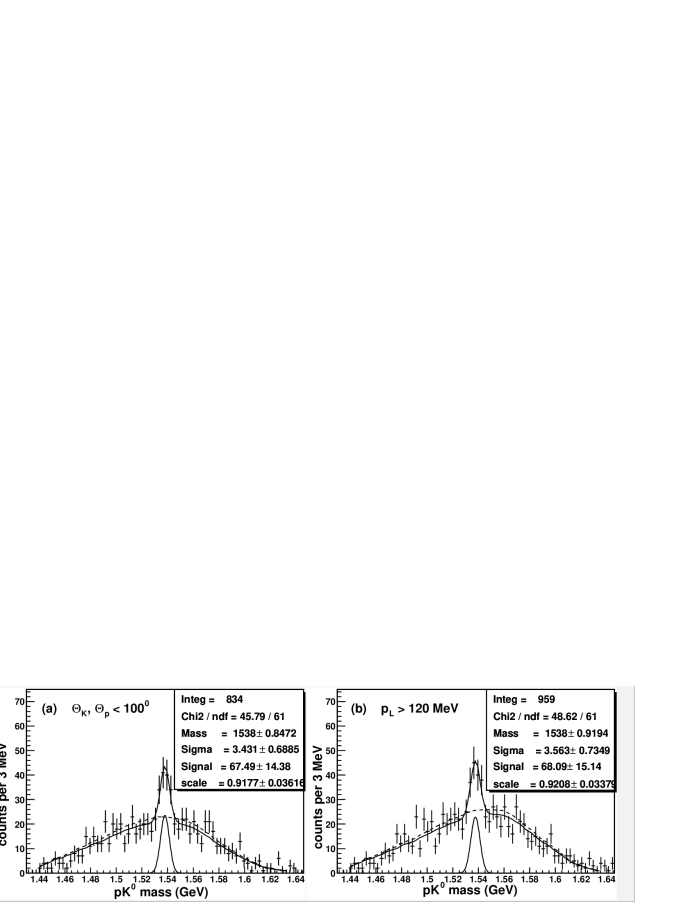
The fits of the scatter plots in and shown in Figs. 5 and 6 suggest that the signal populates a limited range of , as it should for formation of a narrow resonance [7]. In Fig. 7 the effective mass is plotted under the selections or MeV plus the common selections MeV and MeV. The null fits demonstrate that the extra selection MeV does not produce any spurious structures in the spectrum, while substantially increasing the signal-to-background ratio: we have and 6.4 for the signals in Figs. 7a and 7b, respectively.
6 Statistical significance of the signal
In all one- and two-dimensional fits shown in the previous sections, the fitted width of the enhancement in is consistent with being entirely due to the experimental resolution. So in order to reduce the number of free parameters, the mass width is constrained to the simulated value of MeV when estimating the statistical significance of the signal.
For the fits of the scatter plots in and shown in Figs. 5 and 6, the correlation parameter of the two-dimensional Gaussian is always consistent with , as physically expected for the signal from formation of a narrow resonance. Indeed, in this case the variation of is totally due to measurement errors on the and proton momenta and on the opening angle, and should be fully independent from the variation of that arises from Fermi motion of the target neutron. Therefore, we use the constraint when estimating the statistical significance of the two-dimensional signal.
The results of the constrained fits of the mass spectra and of the scatter plots in and are shown in Tables 1 and 2, respectively. Also shown for each fit is the difference between the log-likelihood values for the signal and null hypotheses, . The number of degrees of freedom is and 4 for the constrained one- and two-dimensional fits, respectively. The statistical significance of the signal is estimated using the value of for one degree of freedom which corresponds to the same -value as for ndf degrees of freedom [21].
We see that the statistical significance of the signal is enhanced by the additional kinematic selections based on the Monte-Carlo simulation, reaching some 5.5 standard deviations. The two-dimensional signals are more significant than the one-dimensional ones under similar selections.
| Selections | (MeV) | Signal (ev) | Stat. | |||
| ndf | ndf | sign. | ||||
| (signal fit) | (null fit) | |||||
| None | 47.6 | 65.7 | 18.1 | 4.0 | ||
| 4.8 | 45.9/62 | 62.9/64 | ||||
| MeV | 65.7 | 88.9 | 23.2 | 4.4 | ||
| 5.3 | 67.8/62 | 91.9/64 | ||||
| MeV | 51.6 | 75.0 | 23.4 | 4.4 | ||
| MeV | 5.6 | 45.7/62 | 66.2/64 | |||
| 69.0 | 92.8 | 23.8 | 4.5 | |||
| 5.6 | 55.7/62 | 77.0/64 | ||||
| 80.9 | 109.9 | 28.9 | 5.1 | |||
| MeV | 6.0 | 70.7/62 | 99.8/64 | |||
| 61.8 | 96.9 | 35.1 | 5.5 | |||
| MeV | 6.8 | 45.8/62 | 77.3/64 | |||
| MeV | ||||||
| MeV | 58.0 | 81.8 | 23.8 | 4.5 | ||
| 5.5 | 51.6/62 | 72.8/64 | ||||
| MeV | 68.6 | 97.1 | 28.5 | 5.0 | ||
| MeV | 6.0 | 64.5/62 | 93.0/64 | |||
| MeV | 57.8 | 89.1 | 31.3 | 5.3 | ||
| MeV | 6.4 | 48.6/62 | 78.5/64 | |||
| MeV |
| Selections | (MeV) | (MeV) | Signal (ev) | Stat. | |||
| (MeV) | ndf | ndf | sign. | ||||
| (signal fit) | (null fit) | ||||||
| None | 315.2 | 341.8 | 26.6 | 4.3 | |||
| 5.4 | 268.5/247 | 305.8/251 | |||||
| 315.8 | 350.2 | 34.3 | 5.0 | ||||
| 6.1 | 236.7/247 | 279.7/251 | |||||
| MeV | 295.6 | 333.9 | 38.2 | 5.3 | |||
| 6.5 | 218.0/247 | 266.0/251 |
7 Intrinsic width of the baryon
Intrinsic width of a resonance formed in an -channel reaction like can be estimated by comparing the signal magnitude with the level of non-resonant background under the peak, see e.g. [16]. However, this method cannot be directly applied to collisions with heavy nuclei because the resonant signal and the underlying non-resonant background may be very differently affected by rescattering of the and proton in nuclear medium. That is, the non-resonant background under the peak is a mixture of unrescattered and rescattered events, whereas a true signal should consist of unrescattered events only.
As soon as the decay width is on the order of 1 MeV or less, the peak will not be depleted by the and proton rescatterings because the bulk of produced baryons will decay upon leaving the nucleus. Therefore, for a consistent determination of the intrinsic width based on the method [16] one will need the distribution of non-resonant events in the effective mass of the originally formed system prior to any rescatterings, . The distribution of non-resonant events can only be obtained through a simulation. Pauli blocking for protons in nuclear matter does not affect the process of formation and decay, and therefore should be switched off when consistently simulating the “equivalent” non-resonant background. Then, assuming for the spin and using the observed signal and simulated non-resonant background, the intrinsic width of the baryon can be derived as
| (1) |
Here, is the fitted number of events in the peak
corrected for experimental losses;
is the interval of the original mass
centered on peak position, that is populated by
simulated non-resonant events;
mb is the measured cross section
of the charge-exchange reaction for the center-of-mass energy
equal to the mass [25];
and and are the branching fractions for the initial and
final states ( for the isospin of either
or ).
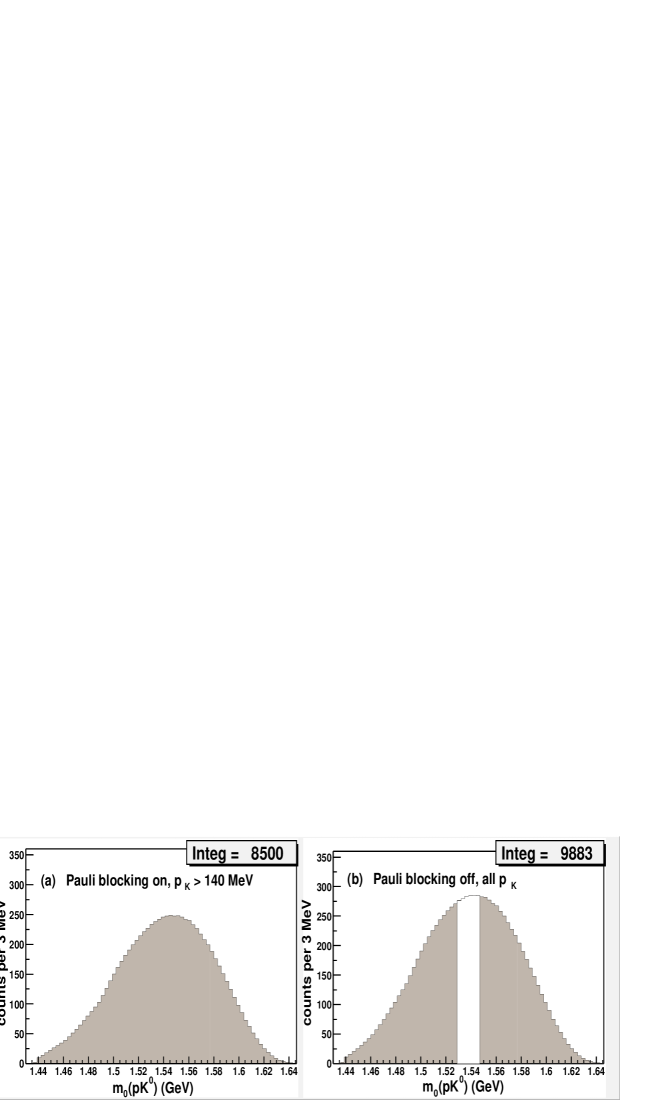
For the simulated charge-exchange collisions on a bound neutron in the bubble chamber DIANA, the effective mass of the original system is plotted in Fig. 8a. At this stage, Pauli blocking is still present in the simulation to allow for an absolute normalization based on the scanning information. The lab momentum is restricted to MeV which is the (effective) threshold for detecting the decays in the scan. The simulated distribution of Fig. 8a has been scaled to the total number of collisions with decays and any number of detected protons, that have been found by the scan in the restricted fiducial volume mm ( events). Thereby, we obtain the correctly normalized distribution for all events of the charge-exchange reaction found by the scan in the part of the detector fiducial volume where throughput measurements were made. The next step is to switch off the Pauli suppression and lift the selection MeV in the simulation. The resultant distribution, that is shown in Fig. 8b, can be directly used for estimating the “equivalent” non-resonant background under the peak.
In Eq. 1, we substitute MeV and events that populate the mass interval MeV of the simulated distribution of Fig. 8b. The fit of the resonant signal prior to analysis selections, shown in Fig. 4a, returned events above the background. This has to be corrected for the experimental losses due to secondary interactions of the or proton in liquid Xenon, mesons decaying too close to the primary vertex, and technical reasons for which some events could not be properly measured. The correction factor for these losses is estimated as . The signal must also be corrected for the cuts MeV and MeV and the losses of soft secondaries, as well as for the experimental selections and MeV for the decays . The corresponding correction factor is estimated as 1.43 using a simulation of formation and decay. And finally, the signal must be corrected for the cut on the proper lifetime. As a result, in Eq. 1 we have to substitute for the acceptance-corrected signal of the baryon.
Finally, for the intrinsic width of the baryon we obtain MeV, where the error does not include the systematic uncertainties of the simulation procedure. This estimate of the intrinsic width has been derived assuming that the bulk of produced baryons decay upon leaving the nucleus. The value of obtained in this analysis is consistent with our earlier estimates [7, 8], and does not violate the upper limits set by BELLE [14] and by the E19 experiment at J-PARC [32].
8 Summary and conclusions
We have analyzed the DIANA data on the charge-exchange reaction using increased statistics and modified selections. The distribution of the effective mass shows a prominent enhancement at 1538 MeV whose width is consistent with being entirely due to the experimental resolution. Applying the same selections as in our previous analysis [5], we find that this narrow enhancement has increased proportionally to the increase of the data sample. A corresponding enhancement at MeV and MeV, formed by nearly 80 events above the background, is observed in the scatter plot in the variables and . Relying on a simulation of Xe collisions that includes the development of the intranuclear cascade, we have shown that the observed signal is not a spurious structure created by the selections. Under the additional kinematic selections based on the simulation, the statistical significance of the signal reaches 5.5 standard deviations. We interpret our observations as strong evidence for formation of a pentaquark baryon with positive strangeness, , in the charge-exchange reaction on a bound neutron. The mass of the baryon has been measured as MeV. Using the ratio between the numbers of resonant and non-resonant charge-exchange events in the peak region, the intrinsic width of this baryon resonance has been determined as MeV. The results reported in this paper confirm our earlier observations based on part of the present statistics of the charge-exchange reaction [5, 7, 8].
We wish to thank M. B. Zhalov for communicating his results on Fermi momentum in the Xe nucleus. We also thank Ya. I. Azimov, L. N. Bogdanova, D. I. Diakonov, and I. I. Strakovsky for useful comments. This work is supported by the Russian Foundation for Basic Research (grant 10-02-01487).
References
-
[1]
M. Gell-Mann, Phys. Lett. 8, 214 (1964);
R.L. Jaffe, Phys. Rev. D15, 281 (1977);
A.T.M. Aerts, P.J.G. Mulders, and J.J. de Swart, Phys. Rev. D17, 260 (1978);
M. de Crombrugghe, H. Hogaasen, and P. Sorba, Nucl. Phys. B156, 347 (1979). - [2] D. Diakonov, V. Petrov, and M. Polyakov, Z. Phys. A359, 305 (1997).
-
[3]
D. Diakonov and V. Petrov, Phys. Rev. D72, 074009 (2005);
C. Lorce, Phys. Rev. D74, 054019 (2006);
A.G. Oganesian, JETP Lett. 84, 409 (2006); Int. J. Mod. Phys. A22, 2093 (2007);
Hyun-Chul Kim, Tim Ledwig, and Klaus Goeke, Mod. Phys. Lett. A23, 2238 (2008);
Tim Ledwig, Hyun-Chul Kim, and Klaus Goeke, Phys. Rev. D78, 054005 (2008); Nucl. Phys. A811, 353 (2008). - [4] T. Nakano et al. (LEPS Coll.), Phys. Rev. Lett. 91, 012002 (2003).
- [5] V. V. Barmin et al. (DIANA Coll.), Yad. Fiz. 66, 1763 (2003) and Phys. Atom. Nucl. 66, 1715 (2003).
- [6] T. Nakano et al. (LEPS Coll.), Phys. Rev. C79, 025210 (2009), arXiv:0812.1035 [nucl-ex].
- [7] V.V. Barmin et al. (DIANA Coll.), Yad. Fiz. 70, 39 (2007) and Phys. Atom. Nucl. 70, 35 (2007), arXiV:hep-ex/0603017.
- [8] V.V. Barmin et al. (DIANA Coll.), Yad. Fiz. 73, 1 (2010) and Phys. Atom. Nucl. 73, 1168 (2010), arXiv:09094183 [hep-ex].
- [9] M.J. Amaryan et al., Phys. Rev. C85, 035209 (2012), arXiv:1110.3325 [hep-ex].
- [10] Volker D. Burkert, Int. J. Mod. Phys. A21, 1764 (2006), arXiv:hep-ph/0510309.
- [11] M.V. Danilov and R.V. Mizuk, Phys. Atom. Nucl. 71, 605 (2008), arXiv:0704.3531 [hep-ex].
- [12] Dmitri Diakonov, AIP Conf. Proc. 892, 258 (2007), arXiv:hep-ph/0610166.
- [13] Y. Azimov, K. Goeke, and I. Strakovsky, Phys. Rev. D76, 074013 (2007), arXiv:0708.2675 [hep-ph].
- [14] R. Mizuk et al. (BELLE Coll.), Phys. Lett. B632, 173 (2006).
- [15] R.A. Arndt, I.I. Strakovsky, and R.L. Workman, Phys. Rev. C68, 042201 (2003), arXiv:nucl-th/0308012.
- [16] R.N. Cahn and G.H. Trilling, Phys. Rev. D69, 011501 (2004), arXiv:hep-ph/0311245.
- [17] A. Sibirtsev et al., Phys. Lett. B599, 230 (2004), arXiv:hep-ph/0405099.
- [18] W. Gibbs, Phys. Rev. C70, 045208 (2004), arXiv:nucl-th/0405024.
- [19] Ya.I. Azimov et al., Eur. Phys. J. A26, 79 (2005), arXiv:hep-ph/0504022.
- [20] V.V. Barmin et al. (DIANA Coll.), Prib. Tekhn. Eksp. 4, 61 (1984).
- [21] Particle Data Group, Journal of Physics G37, 1 (2010).
- [22] V.V. Barmin et al. (DIANA Coll.), Nucl. Phys. A683, 305 (2001).
- [23] V.V. Barmin et al. (DIANA Coll.), Nucl. Phys. A556, 409 (1993).
- [24] V.V. Barmin et al. (DIANA Coll.), Phys. Atom. Nucl. 57, 1655 (1994).
- [25] U. Casadei et al., CERN–HERA 75-1.
- [26] C.B. Dover and G.E. Walker, Physics Reports 89, 1 (1982).
- [27] See http://pdg.lbl.gov/2006/hadronic-xsections/hadron.html.
- [28] M.B. Zhalov, private communication.
- [29] G. Bernardini, E.T. Booth, and S.J. Lindenbaum, Phys. Rev. 88, 1017 (1952).
-
[30]
Joseph E. Lannutti et al., Phys. Rev. 109, 2121 (1958);
George Igo at al.,, Phys. Rev. 109, 2133 (1958);
B. Sechi Zorn and G.T. Zorn, Phys. Rev. 120, 1898 (1960). - [31] A. Sibirtsev, J. Haidenbauer, S. Krewald, and Ulf-G. Meissner, Eur. Phys. J. A23, 491 (2005), arXiv:nucl-th/0407011.
- [32] K. Shirotori et al., Phys. Rev. Lett. 109, 132002 (2012), arXiv:1203.3604 [nucl-ex].