The dynamical status of ZwCl 2341.1+0000: a very elongated galaxy structure with a complex radio emission
Abstract
We study the dynamical status of the galaxy system ZwCl 2341.1+0000, a filamentary multi-Mpc galaxy structure associated with a complex diffuse radio emission.
Our analysis is mainly based on new spectroscopic data for 128 galaxies acquired at the Italian Telescopio Nazionale Galileo. We also use optical data available in the Sloan Digital Sky Survey and X-ray data from the Chandra archive.
We select 101 cluster member galaxies and compute the cluster redshift and the global line-of-sight velocity dispersion km s-1.
Our optical analysis agrees with the presence of at least three, likely four or more, optical subclusters causing the south-south-east–north-north-west (SSE–NNW) elongation of the galaxy distribution and a significant velocity gradient in the south-north direction. In particular, we detect an important low-velocity subclump in the southern region, roughly coincident with the brightest peak of the diffuse radio emission but with a clear offset between the optical and radio peaks. We also detect one (or two) optical subcluster(s) at north, in correspondence with the second brightest radio emission, and another one in the central cluster region, where a third diffuse radio source has been recently detected. A more refined analysis involving the study of the 2D galaxy distribution suggests an even more complex structure. Depending on the adopted model, we obtain a mass estimate 1-3 for the whole system.
As for the X-ray analysis, we confirm the SSE–NNW elongation of the intracluster medium and detect four significant peaks. The X-ray emission is strongly asymmetric and offsetted with respect to the galaxy distribution, thus suggesting a merger caught in the phase of post–core–core passage.
Our findings support two possible hypotheses for the nature of the diffuse radio emission of ZwCl 2341.1+0000: a two relics + halo scenario or diffuse emission associated with the infall and merging of several galaxy groups during the first phase of the cluster formation.
keywords:
galaxies: clusters: general - galaxies: cluster: individual: ZwCl 2341.1+0000 - galaxies: kinematics and dynamics - X-rays: galaxies: clusters.1 Introduction
An increasing fraction of galaxy clusters exhibits diffuse (on Mpc scale) radio emission which is not associated with the nuclear activity of member galaxies (e.g., Ferrari et al. 2008; Venturi 2011). The non-thermal nature of these sources and their steep radio spectra can be interpreted admitting the existence of relativistic intracluster particles moving in large-scale cluster magnetic fields.
In the literature these radio sources are usually classified as relics and haloes. For both types of sources, cluster mergers have been proposed as the process responsible for their origin (e.g., Feretti 1999). Nevertheless, the location and observational properties of relics and haloes are quite different. Relics are elongated polarized sources found at the cluster outskirts and are thought to be connected with shocks occurring during mergers (e.g., Ensslin et al. 1998; Hoeft et al. 2004). Radio haloes, instead, have rounder morphologies, are unpolarized and fill the central cluster regions. They are probably related to the turbulent motions of the intracluster medium (ICM) following a merger (e.g., Cassano et al. 2006; Brunetti et al. 2009), but the detailed scenario is still under discussion.
Very interestingly, in a few cases diffuse non-thermal radio emission have been found on even larger scales. An example are the bridges between relics and haloes observed in a few clusters, e.g. Abell 1656 (Coma; Kim et al. 1989) and Abell 2744 (Govoni et al. 2001). There have also been detections of diffuse radio sources at large distances from a few clusters, e.g. Abell 2255 (Pizzo et al. 2008) and Abell 2256 (van Weeren et al. 2009b). An intriguing case is also that of the diffuse source 0809+39 (Brown & Rudnick 2009), whose southern component is possibly associated with a galaxy filament 5 Mpc long at 0.04. We refer to the recent review by Feretti et al. (2012) for further details and open issues.
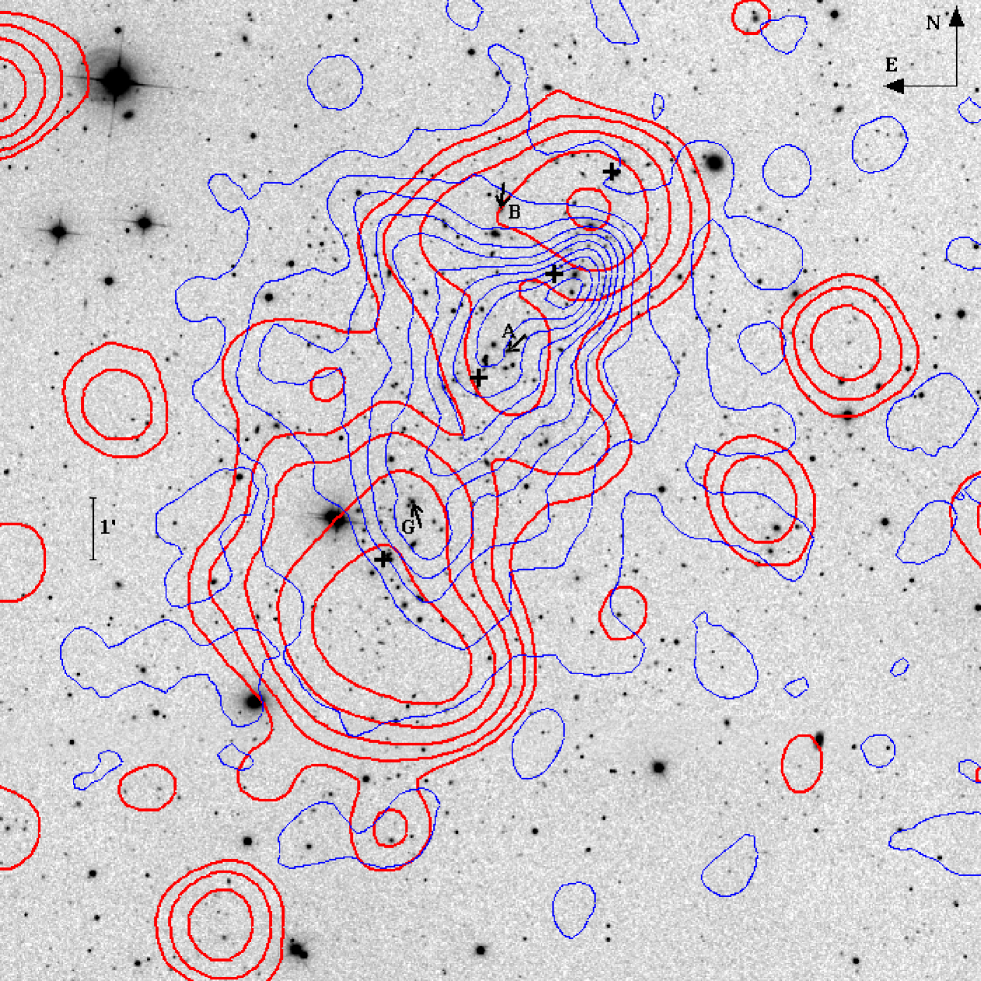
In this paper we focus on a exceptional radio emission associated with a filamentary multi-Mpc galaxy structure in the ZwCl 2341.1+0000 (hereafter ZwCl2341+00) cluster region, stretching over an area of at least 4 Mpc, as found by Bagchi et al. (2002, Very Large Array, VLA, data). Bagchi et al. argue that this region is the site of cosmic shocks originating in multiple mergers during the large scale structure formation. The radio images obtained from Giant Metrewave Radio Telescope (GMRT) observations show two diffuse sources to the north and south of the cluster, interpreted as a double relic, arising from outgoing shock fronts because of a cluster merger (van Weeren et al. 2009a). In addition to the above relics, ad hoc VLA observations have allowed Giovannini et al. (2010) to detect radio emission in the optical filament of galaxies between (see Fig. 1). The size of the radio emission is 2.2 Mpc. In light of their new results, Giovannini et al. discuss three possible scenarios: the radio emission associated with the cosmic shocks as suggested by Bagchi et al. (2002), a giant radio halo in-between two symmetric relics, or the merging of two clusters both hosting a central radio halo. X-ray data from ROSAT, Chandra, XMM–Newton and Suzaku show that ZwCl2341+00 has a complex structure (Bagchi et al. 2002; van Weeren et al. 2009a; Bagchi et al. 2011; Akamatsu & Kawahara 2013), with a global X-ray temperature keV and luminosity (0.3–8.0 keV)=3 erg s-1 (van Weeren et al. 2009a). The galaxy distribution, as derived from photometric data of the Sloan Digital Sky Survey (SDSS), is quite elongated (van Weeren et al. 2009a). However, no extensive optical spectroscopy exists for galaxies in the ZwCl2341+00 region and no dynamical analysis has ever been performed, SDSS data only allowing to estimate the cluster redshift (z=0.267; Bagchi et al. 2002).
In the context of our observational program aimed to study the internal dynamics of clusters with diffuse radio emission (Dynamical Analysis of Radio Clusters – DARC; see Girardi et al. 2010a), we performed an intensive study of ZwCl2341+00. In particular, we obtained new spectroscopic data by using the Telescopio Nazionale Galileo (TNG). Our present analysis is mainly based on these optical data. We also used archival optical data from the SDSS and X-ray data from the Chandra archive. These optical and X-ray data complement each other to provide a more complete picture of the dynamical status of this cluster, as widely demonstrated by our previous works on other clusters (e.g., Barrena et al. 2011; Boschin et al. 2012b) and also by the Multiwavelength Sample of Interacting Clusters (MUSIC) project (Maurogordato et al. 2011 and references therein).
This paper is organized as follows. We present the optical data and the cluster catalogue in Section 2. We present our results about the cluster structure based on optical and X-ray data in Sections 3 and 4, respectively. We discuss our results and present our conclusions in Section 5. Unless otherwise stated, we indicate errors at the 68 per cent confidence level (hereafter c.l.). Throughout this paper, we use km s-1 Mpc-1 and km s-1 Mpc-1) in a flat cosmology with and . In the adopted cosmology, 1 arcmin corresponds to kpc at the cluster redshift.
2 Spectroscopic observations
Multi-object spectroscopic observations of ZwCl2341+00 were carried out at the TNG in 2009 October, 2011 August and 2011 December. We used the instrument Device Optimized for the Low Resolution (DOLORES) in multi-object spectroscopy (MOS) mode with the LR-B Grism.111http://www.tng.iac.es/instruments/lrs In summary, we observed four MOS masks for a total of 142 slits. The total exposure time was 3600 s for three masks and 5400 s for the last one.
Reduction of spectra and radial velocities computation with the cross-correlation technique (Tonry & Davis 1979) were performed using standard IRAF222IRAF is distributed by the National Optical Astronomy Observatories, which are operated by the Association of Universities for Research in Astronomy, Inc., under cooperative agreement with the National Science Foundation. tasks, as done with other clusters included in our DARC sample (for a detailed description see, e.g., Boschin et al. 2012a). In seven cases (IDs. 21, 30, 39, 45, 47, 58, and 69; see Table 1) the redshift was estimated measuring the wavelength location of emission lines in the spectra. Our spectroscopic catalogue lists 128 galaxies in the field of ZwCl2341+00.
Comparing the velocity measurements for the seven galaxies observed with multiple masks (see discussion in, e.g., Boschin et al. 2004, Girardi et al. 2011), we corrected the velocity errors provided by the cross-correlation technique by multiplying them by a factor of 2.2. Taking into account the above correction, the median value of the errors is 92 km s-1. Three galaxies have spectroscopic redshifts in the SDSS (Data Release 7), in good agreement with our values. With the exception of one galaxy, SDSS dereddened magnitudes , , and are available.
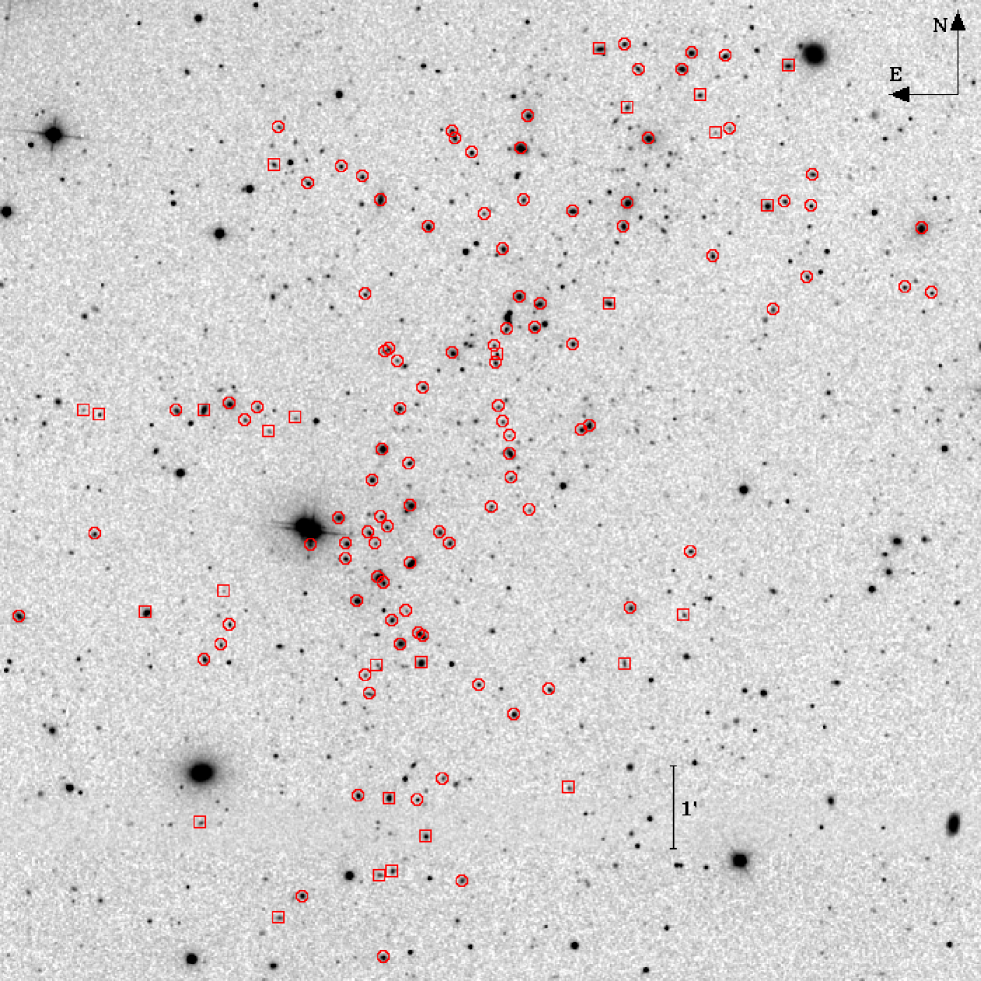
Table 1 lists the velocity catalogue (see also Fig. 2): identification number of each galaxy, ID (column 1); right ascension and declination, and (J2000, column 2); SDSS (dereddened) magnitude (column 3); heliocentric radial velocities, (column 4) with errors, (column 5).
2.1 Notable galaxies
No galaxy dominates the galaxy population of ZwCl2341+00, with five galaxies in the brightest magnitude range (ID 2, 20, 41, 72 and 91).
The region is populated by a number of radio and X-ray sources. In particular, van Weeren et al. (2009a) took high-resolution GMRT images at 650 MHz and detected 12 radio sources associated with individual galaxies. Among them, sources A, B and G are classified as head–tail galaxies (see Fig. 1). Their optical counterparts are member galaxies ID 36, 39 and 73, respectively. Other unresolved radio sources are C (galaxy ID 41), F (ID 20), H (ID 72), I (ID 101) and L (ID 95).
Our analysis of Chandra X-ray data (see Sect. 4) also detects several X-ray pointlike sources in the field of ZwCl2341+00. Two of them are galaxies ID 124 (nonmember) and ID 21 (member).
3 Analysis of the optical data
3.1 Member selection
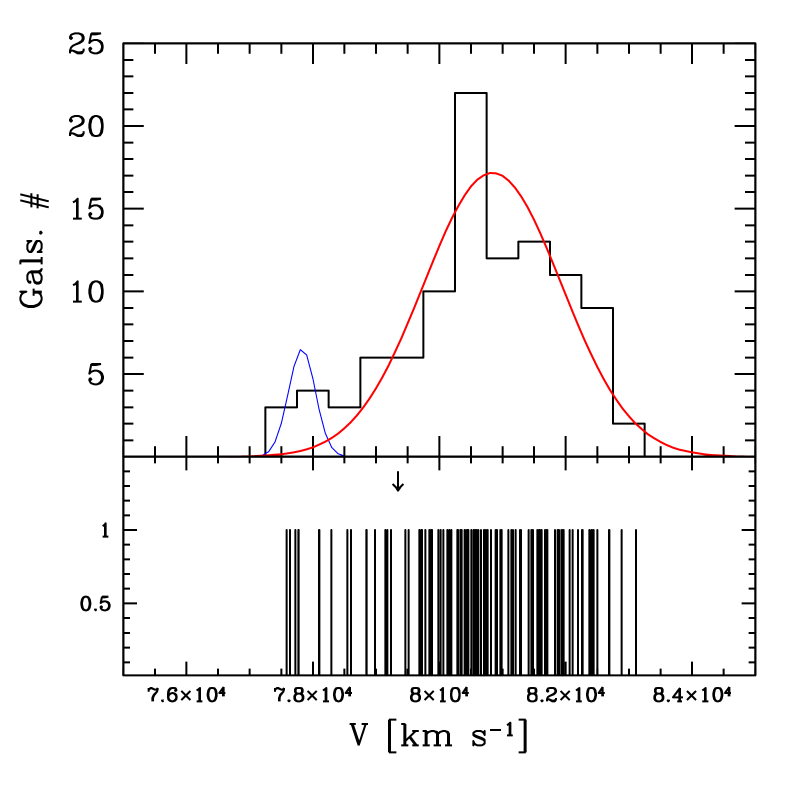
As usual in the analysis of our DARC clusters, the selection of cluster members was performed by running two statistical tests. First, we run the 1D adaptive-kernel method (hereafter 1D-DEDICA; Pisani 1993 and 1996) on the 128 galaxies of our spectroscopic catalogue. This procedure detects ZwCl2341+00 as a peak at populated by 101 galaxies considered as fiducial cluster members (in the range km s-1, see Fig. 3). The 27 non-members are 15 and 12 foreground and background galaxies, respectively.

In a second step, we combined the spatial and velocity information by running the ‘shifting gapper’ test by Fadda et al. (1996; see also e.g. Girardi et al. 2011 for details). This procedure confirms the 101 fiducial cluster members selected with the 1D-DEDICA method. We are aware that the results of the ‘shifting gapper’ can be sensitive to the choice of the cluster centre. Since ZwCl2341+00 is a complex of three or more groups (see the analysis in Sect. 3.3), this choice is not obvious. In this study we adopted the coordinates of the central galaxy clump as estimated in the following Sect. 3.3.2 [R.A.=, Dec.= (J2000.0)]. However, we verified that other possible reasonable choices for the centre, e.g. the highest peak in the X-ray emission (Bagchi et al. 2002) or the original Zwicky centre, do not affect too much the results of the procedure, leading to the rejection of, at most, two more galaxies.
3.2 Global cluster properties
The analysis of the velocity distribution of the 101 cluster members was performed by using the biweight estimators of location and scale (Beers et al. 1990). Our measurement of the mean cluster redshift is 0.0003 (i.e., 103 km s-1). As for the second moment of the velocity distribution (i.e., the global radial velocity dispersion), our result is km s-1.
3.3 Optical substructures
In this subsection we analyse the internal structure of the cluster and search for eventual substructures. Most of the techniques adopted in this analysis have already been presented in previous studies of the DARC clusters and we briefly hint to the reference papers. We only detail the new developments and the specific results obtained for ZwCl2341+00.
3.3.1 Analysis of the velocity distribution of member galaxies
The velocity distribution was first analysed to search for possible deviations from Gaussianity that might provide important signatures of complex dynamics. In particular, we considered several shape estimators, e.g. the kurtosis, the skewness and the Scaled Tail Index (see Bird & Beers 1993). We found that the velocity distribution is significantly skewed (at the 95-99 per cent c.l., see table 2 of Bird & Beers 1993). Moreover, we also applied the W-test (Shapiro & Wilk 1965) and found a departure from the Gaussian significant at the 99.6 per cent c.l.
We then investigated the presence of gaps in the velocity distribution performing the weighted gap analysis (Beers et al. 1991; 1992). We detect one significant gap (at the 97 per cent c.l.), which divides the cluster into two groups, GV1 and GV2, of 16 and 85 galaxies from low to high velocities, respectively (see Fig. 4).
The 1D-Kaye’s mixture model test (1D-KMM; Ashman et al. 1994), which fits a user-specified number of Gaussian distributions to a data set and assesses the improvement of that fit over a single Gaussian (see, e.g., Boschin et al. 2012a for details), also detects a significant two-group partition (at the 98.7 per cent c.l.; seven and 94 galaxies). For the two groups (hereafter KMM1D-LV and KMM1D-HV) we obtain mean velocities, km sand km s-1, and velocity dispersions, km sand km s-1, where the galaxies are weighted according to their partial membership to both the groups. The weights help to avoid possible underestimates due to an artificial truncation of the tails of the velocity distributions. A three-group partition of 15, 53 and 33 galaxies also provides a fit better than the single Gaussian, but only at a 95 per cent c.l., thus it was not considered according to Bird (1994).
Both GV1 and KMM1D-LV are two low-velocity groups concentrated in the SE cluster region (see Fig. 5). According to the 2D Kolmogorov–Smirnov test (Fasano et al. 1987) the spatial distributions of the galaxies of GV1 and GV2 (KMM1D-LV and KMM1D-HV) are different at the 99.4 per cent c.l. (97 per cent c.l.). This result suggests that the cluster structure can be revealed by the analysis in the phase space (i.e., combining velocities and sky positions; see Sect. 3.3.3).
3.3.2 Analysis of the spatial distribution of member galaxies
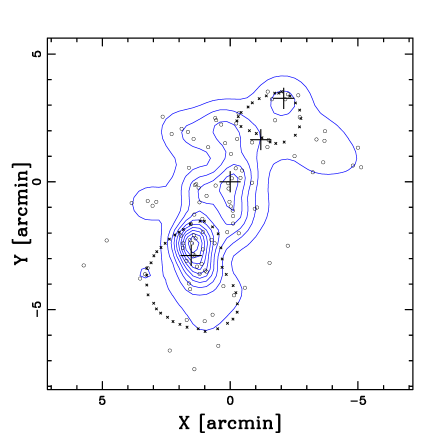
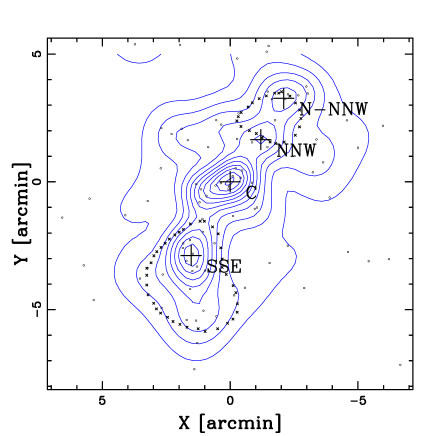
We analysed the spatial distribution of the 101 member galaxies by using the 2D adaptive-kernel method (hereafter 2D-DEDICA). We highlight a south-south-east–north-north-west (SSE-NNW) elongated structure with three very significant galaxy peaks (Fig. 6, upper panel), the SSE one being the most important.
Our spectroscopic data do not cover the entire cluster field and are affected by magnitude incompleteness due to unavoidable constraints in the design of the MOS masks. In particular, comparing the photometric and spectroscopic samples in the sky region explored by the four MOS masks we estimate that we retrieved spectroscopic redshifts for the 75 per cent (60 per cent) of the galaxies with 19.0 (20.0). To overcome the incompleteness of the spectroscopic sample we resorted to the photometric SDSS catalogues extracted in a 30 arcmin radius region from the cluster centre. In particular, we selected likely members on the basis of both (– versus ) and (– versus ) colour-magnitude relations (CMRs), which indicate the early-type galaxies locus (e.g. Dressler 1980; see Boschin et al. 2012a for details on the technique used for the determination of the CMRs and the selection of member galaxies). The equations of the two CMRs are –=1.033-0.027 and –=2.523-0.056.
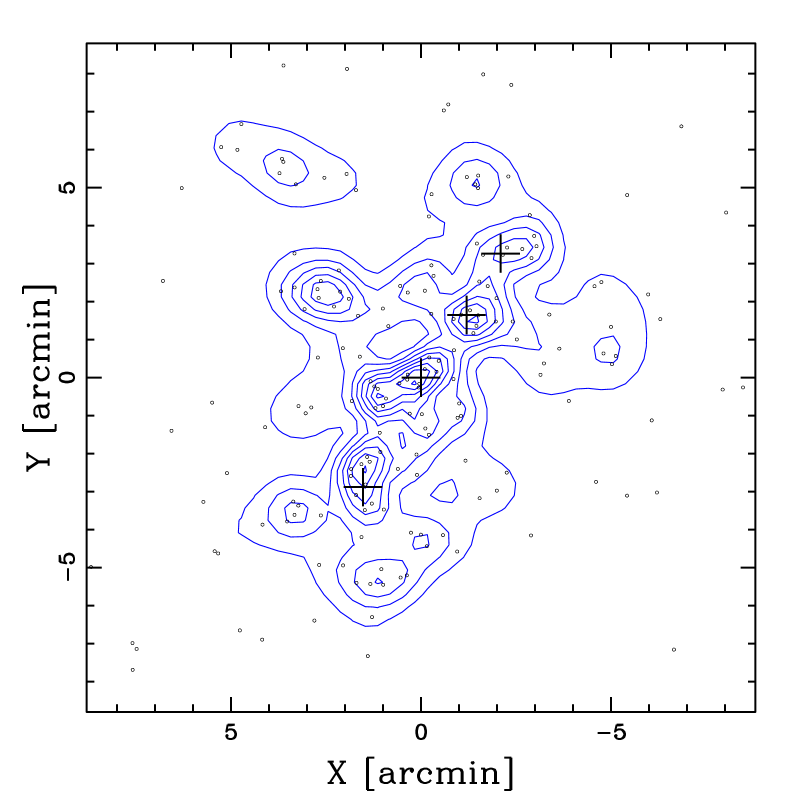
Fig. 6 (lower panel) shows a zoom of the contour map for the likely cluster members with in the region comparable to that sampled by the spectroscopic data: the results of the spectroscopic sample are confirmed, with the difference that the main peak is now the central one (C peak) and the presence of the additional peak NNW (other peaks shown in the figure are SSE and N-NNW ones). Fig. 7 shows the results for the catalogue of likely members with : it shows an even more complex structure with several subclumps. Two external peaks, corresponding to other galaxy clusters are outside of the boundaries of the figure. Table 2 lists information for the peaks obtained from the photometric samples: the number of assigned members, (column 2); the peak position (column 3); the density (relative to the densest peak), (column 4); the value of for each peak, (column 5). We list all the very significant peaks (at per cent c.l.) with relative density .
3.3.3 3D analysis: combining velocity and spatial information
Here we present our analysis of the structure of ZwCl2341+00 combining the spatial and velocity information of the catalogue of spectroscopic cluster members. Several approaches were explored.
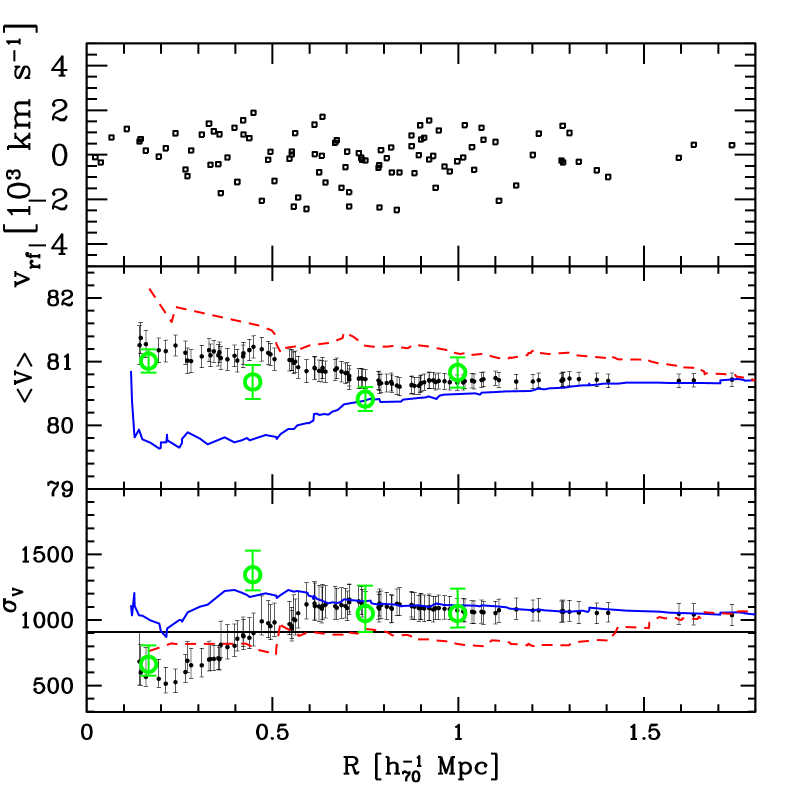
First, we checked for a velocity gradient in the set of the 101 cluster members (see e.g. den Hartog & Katgert 1996 and Girardi et al. 1996). We found a significant velocity gradient (at the 98 per cent c.l.) with a position angle of PA (measured counter clock wise from north, see Fig. 5). This means that higher velocity galaxies lie at the north and lower velocity galaxies at the south (see also Fig. 8).
Then, we applied the classical -statistics (Dressler & Schectman 1988, hereafter DS-test) to detect the presence of substructure. In particular, we considered the modified version of this test which splits the contribution of the local mean velocity (DS-test) and dispersion (DS-test; see for details, e.g., Girardi et al. 1997; Ferrari et al. 2003; Girardi et al. 2010b). The DS-test detects substructure significant at the 99.9 per cent c.l., mainly due to the mean velocity estimator (for the DS-test the significance is at the 99.9 per cent c.l.).
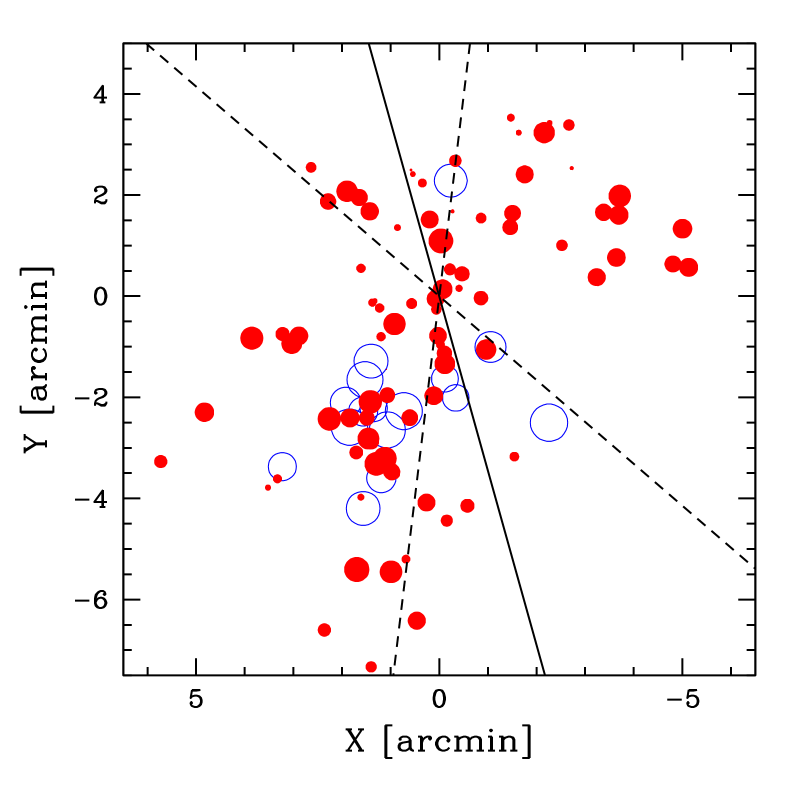
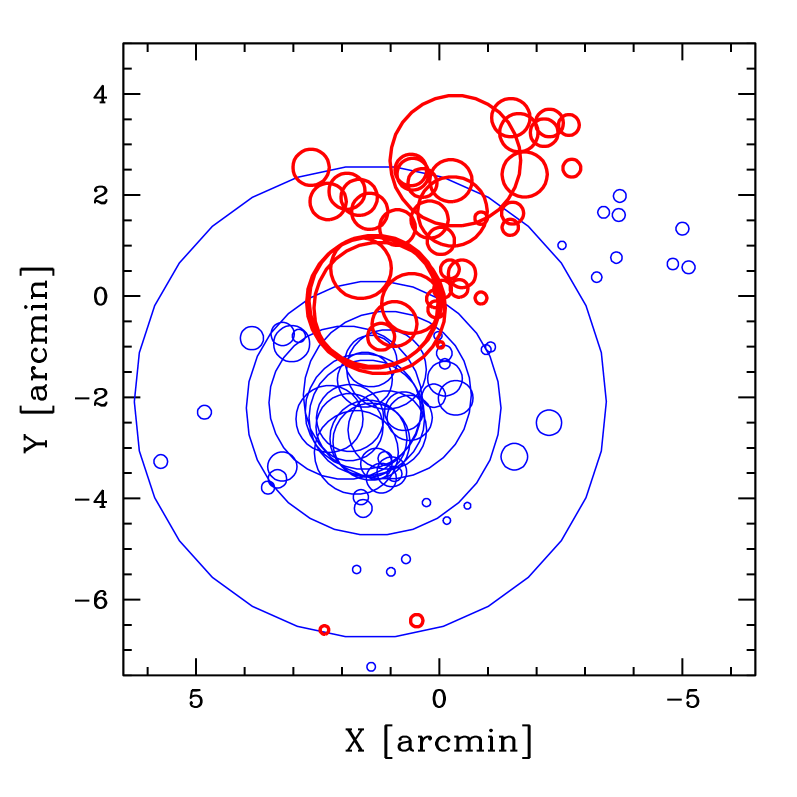
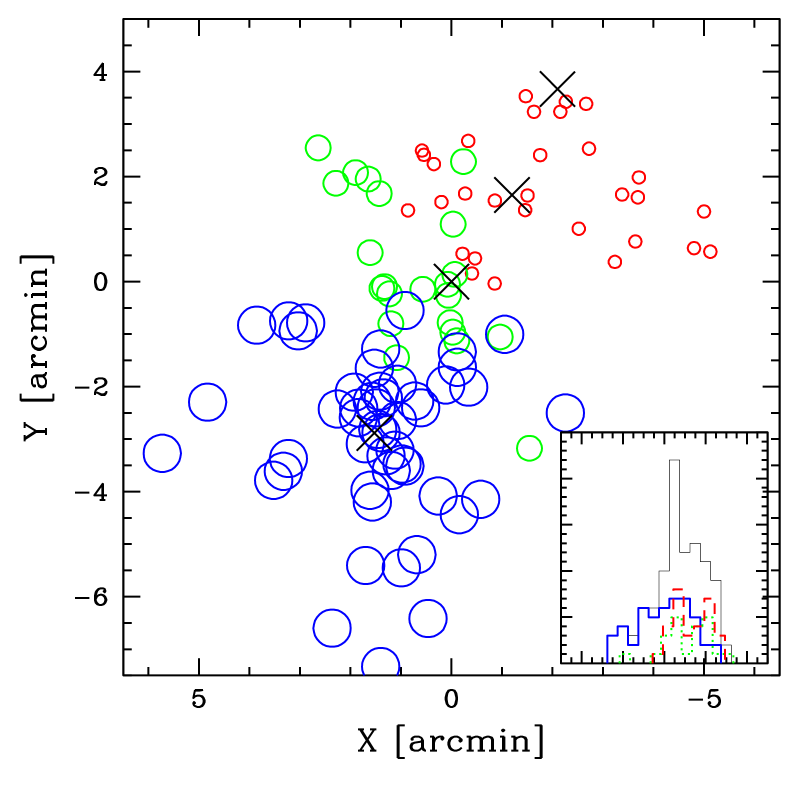
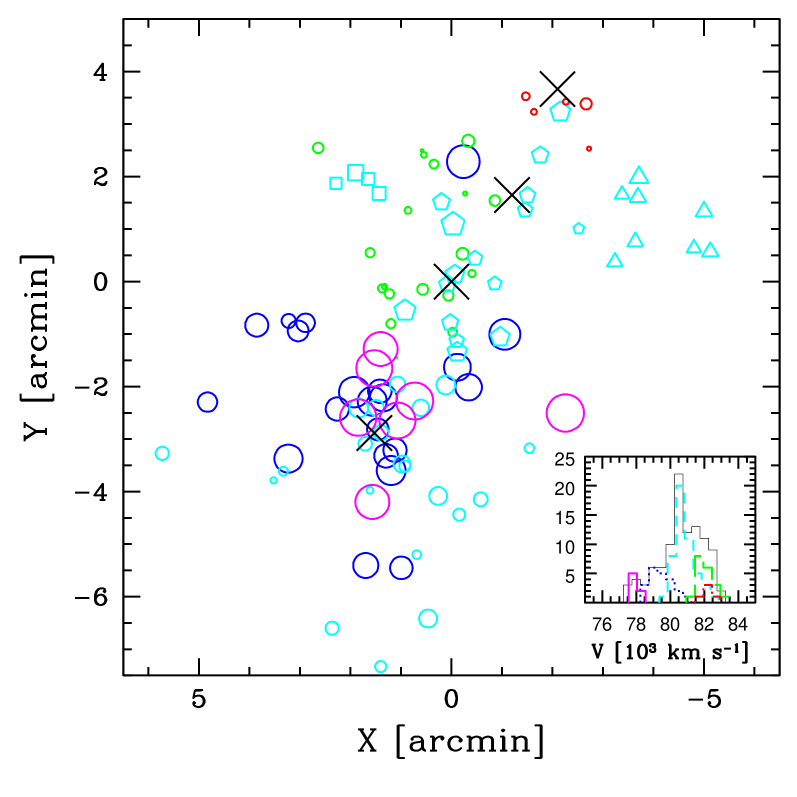
We also analysed the profiles of mean velocity and velocity dispersion using as centres the C, SSW and N-NNW peaks, which are detected by the 2D analysis of both the spectroscopic and photometric samples (Sect. 3.3.2). The integral profiles are flat within the errors in the external regions (see Fig. 9), thus suggesting that we obtain a robust value of for the whole cluster. However, the values of the mean velocity and the velocity dispersion depend on the galaxy peak assumed as the cluster centre. The ‘C’ subcluster is well detected as a group with -600 km sand km swithin 0.3 Mpc, then quickly increases due to the inclusion of other subclusters. As for the ‘SSE’ and ‘N-NNW’ subclusters, they show lower and higher mean velocities, respectively. We also used the galaxies around the three galaxy peaks (i.e. within 0.25 Mpc) as seeds to check for a significant three-group partition through the 3D-KMM test. We find that a partition of 33, 22 and 49 galaxies (hereafter KMM3D-N-HV, KMM3D-C-HV, KMM3D-S-LV groups) is a significantly more accurate description of the 3D galaxy distribution than a single 3D Gaussian (at the per cent c.l.). The groups are well separated in the plane of the sky and the southern group (KMM3D-S-LV) is characterized by a lower mean velocity (see Fig. 10).
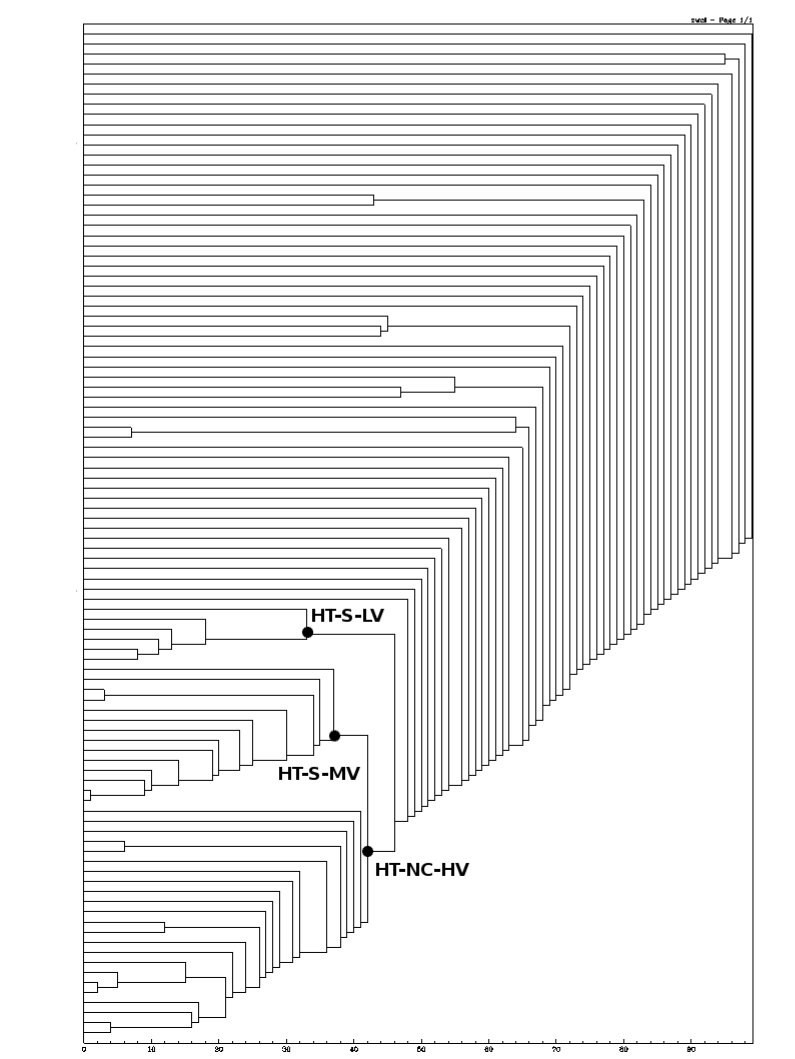
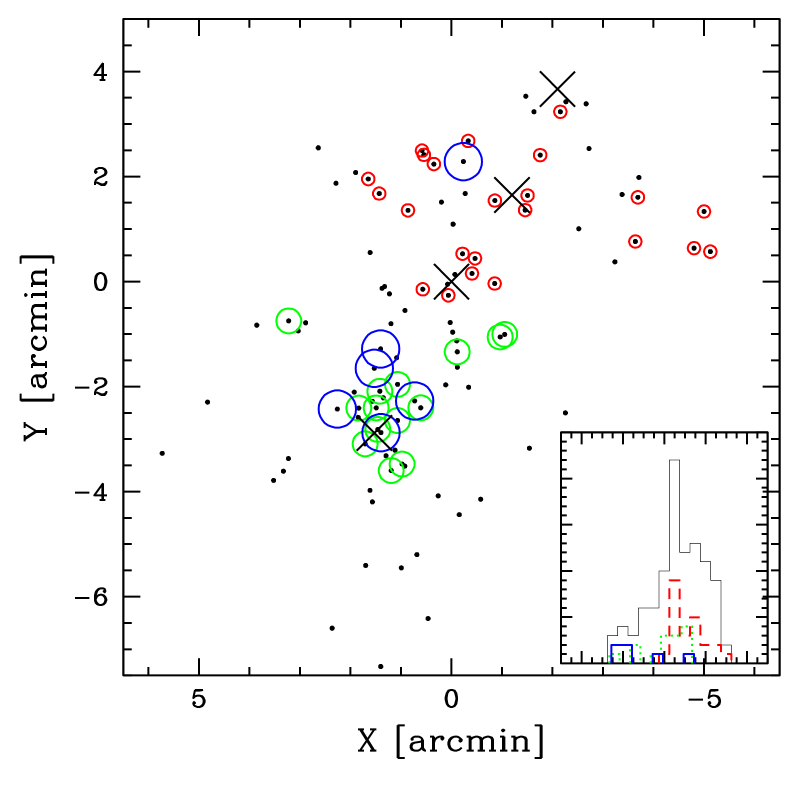
We also resorted to the Htree method devised by Serna & Gerbal (1996; see also Girardi et al. 2011 for a recent application and Serra & Diaferio 2013, where a similar technique is also used to determine cluster members). The method uses a hierarchical clustering analysis to determine the relationship between galaxies according to their relative binding energies. Fig. 11 shows the resulting dendogram, where three subclusters are identified: one occupying the north and central regions, characterized by a high mean velocity (HT-NC-HV), and two at the south with lower mean velocities (HT-S-LV and HT-S-MV; see Fig. 12).
Finally, we applied the 3D adaptive-kernel method (hereafter 3D-DEDICA; Pisani 1996, see Girardi et al. 2011 for a recent application). This technique detects eight groups (see Fig. 13). Among them, the two groups with the lowest mean velocity lie at south (DED3D-S-LLV, DED3D-S-LV), and the two ones with the highest mean velocity lie at north and in the central region (DED3D-N-HHV, DED3D-NC-HV). There are also four groups with similar mean velocities, all closely around the cluster mean velocity: we join them together in a single subcluster (DED3D-NCS-MV) in the insert figure of Fig. 13 and in Tab. 3. Table 3 lists the properties of the subclusters detected by the 3D-DEDICA technique and the methods described above.
3.4 Computation of the cluster mass
As for the determination of global virial quantities, we followed the prescriptions of Girardi & Mezzetti (2001, see also Girardi et al. 1998) considering different models for ZwCl2341+00, from a single spherical system to the sum of several subsystems using the values of the velocity dispersions listed in Tab. 3. For the single system, we obtain . For other models, each based on a different substructure test, we sum the mass values obtained for each subcluster but with a rough rescaling with the respective (i.e., ) in such a way to estimate the mass for a corresponding similar 2.2 Mpc-radius region. We find: , , , . The cluster is thus confirmed to be quite massive, although the precise mass value is uncertain, depending on the adopted model.
4 Analysis of the X-ray data
In this work we are mainly interested in comparing the spatial galaxy distribution with the morphology of the ICM. To this aim, we considered archival X-ray data taken with Chandra Advanced CCD Imaging Spectrometer (ACIS-I; exposure ID #5786, total exposure time 30.2 ks). We reduced the data using the package CIAO333see http://asc.harvard.edu/ciao/ (version 4.2) on chips I0, I1, I2, and I3 (field of view arcmin2) in a standard way (see e.g. Boschin et al. 2004).
The photon counts of the reduced image are affected by the poorly exposed ACIS-I CCD gaps (see Fig. 14). We corrected this effect by binning the reduced image, applying a soft smoothing and, finally, dividing by an exposure map. The result is an image whose contour levels are plotted in Fig. 1. A simple look at the X-ray contours shows the complex morphology of the ICM, which appears elongated in the SSE–NNW direction, i.e. the direction defined by the spatial distribution of member galaxies (see Sect. 3.3.2).
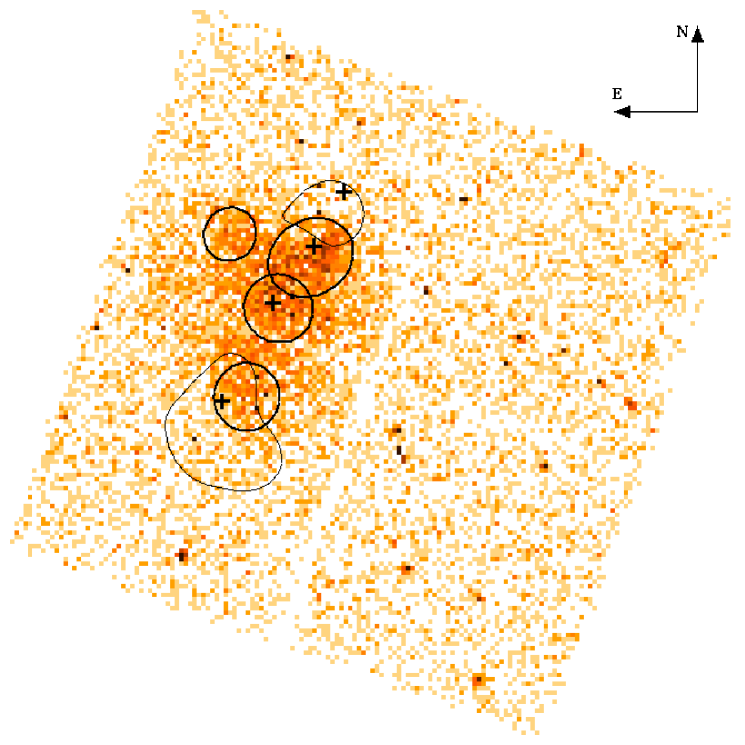
A quantitative analysis of the ICM morphology can be performed by executing a multiscale wavelet analysis. We consider the counts in the soft band (0.5–2 keV) corrected for the exposure map. After removal of point-like sources, we run the task CIAO/wavdetect and detect four substructures (see Fig. 14 and Table 4). Three of the four X-ray peaks follow the SSE–NNW direction defined by the optical peaks, with Wav-NNW and Wav-C being the most significant ones. The structure Wav-NE seems an ICM filament pointing to the location of the optical NE peak detected by 2D-DEDICA (see Fig. 7 and Table 2).
As for the spectral properties of the ICM, van Weeren et al. (2009a) and Bagchi et al. (2011) have already measured the overall temperature by analysing both the Chandra data considered in this work and XMM–Newton data. Moreover, Akamatsu & Kawahara (2013) present a temperature profile based on deeper Suzaku data. We refer to their results in the discussion. Because of the relatively low photon count statistics (in particular in the peripheral regions of the ICM) of Chandra and XMM-Newton data we omit the computation of an accurate temperature map, although it would be desirable to characterize the X-ray properties of the detected substructures.
5 Discussion and conclusions
We confirm that ZwCl2341+00 has a complex structure. With respect to the previous detection of a northern and a central peaks in the galaxy distribution (see fig. 1 of van Weeren et al. 2009a), we also detect an important peak at south. Using our spectroscopic sample we can detect these galaxy clumps in the 3D phase space, in particular it is quite clear the presence of a southern low-velocity structure and a northern high-velocity one. Depending on the adopted method for the analysis, the cluster structure is less or more complex, going from a simple two-clump structure in the velocity space to several clumps in the 3D-DEDICA analysis. Several results support the existence of at least three structures, at north and south and in the central regions. The projected cluster structure is strongly elongated along the SSE–NNW direction, and the angle between the cluster axis and the plane of sky is probably intermediate, as suggested by the fact that we detect the subclusters both in the velocity and in the 2D space.
The ICM X-ray emission roughly follows the distribution of the cluster galaxies. However, it is strongly asymmetric, with the X-ray peak located at north with respect to the central (and densest) galaxy group. Moreover, there is no one-to-one correspondence between the optical subclumps and the X-ray structures detected by the wavelet analysis (Table 4). We deduce that ZwCl2341+00 is caught during or after the merging phase. In this scenario, the hot region detected by Akamatsu & Kawahara (2013) in the cluster centre could be due to an enhancement of the temperature related to a three-body merger.
Some hints on the direction of the merger could also be given by the three head-tail radio galaxies observed in the cluster region (see Sect. 2.1 and Fig. 1). Radio sources A and B lie at the north and point towards the C optical subclump. Considering that their radial velocities are not extreme and we can see their radio tails, it is clear that they are moving on the plane of the sky or, at most, at an intermediate angle. If they are falling into the cluster following the global direction of the merger, this could be another clue in support of the feeling that the merging process is occurring along a direction quite far from the line-of-sight. Similar considerations could be done also for radio source G, which lies at the south and is moving inward (but not pointing exactly towards the cluster centre).
In the context of the scenario described above, we can re-examine the three hypotheses discussed by Giovannini et al. (2010) to explain the quite complex radio emission of this cluster. Their major concern about the hypothesis of two clusters hosting two radio haloes is that in the southern radio-emitting region there was yet no evidence of a galaxy overdensity. Our detection of an important southern subcluster allows now to overcome this concern. However, Fig. 6 (lower panel) shows that the north and south radio emissions are shifted with respect to the centre of the northern and southern subclusters, at the contrary of the well known case of Abell 399/401 where two radio haloes are hosted in the two pre-merger clusters (Murgia et al. 2010). Even if we cannot exclude that the shifting in ZwCl2341+00 be due to a more advanced but still pre-merging phase, our above comparison between optical and X-ray data rather suggests we are in a quite different temporal phase. Moreover, the detection of polarized flux (quite rare in radio haloes; Giovannini et al. 2010) in the north and south radio-emitting regions cannot be easily reconciled with this scenario.
As for the hypothesis that the radio emission is due to two peripheral relics and a central radio halo, the presence of the two external radio emissions at the border of the X-ray emission reminds the typical clusters with double relics like, e.g., Abell 3667, where two galaxy subclusters are detected (Roettiger et al. 1999). In the case of ZwCl2341+00 the presence of both relics and halo seems well supported by the existence of, at least, three subclusters. The central one could be connected to the radio halo, while the northern and southern subclusters could be responsible for the relics within a three-body merger scenario. However, we point out that, if ZwCl2341+00 hosts a central radio halo, its global ICM temperature ( keV; e.g., Bagchi et al. 2011) is an evident anomaly among the X-ray temperatures (in the range 7–10 keV) of the clusters hosting radio haloes included in the DARC sample. At the same time, the detection of polarization (Giovannini et al. 2010) also in the central radio emission casts doubt on the real nature of this source.
Finally, both the 3D-DEDICA analysis of the spectroscopic sample and the 2D analysis of the likely members distribution () suggest that the cluster and the large-scale structure around it have an even higher degree of complexity. This can agree with the hypothesis that the whole region is experiencing a large-scale structure formation with many shocks originated in a complex multiple merger. In particular, fig. 3 by Giovannini et al. (2010) shows the presence of polarized emission along the east side and they suggest that it could be related to the direction and dynamics of the merging process. Indeed, Fig. 7 shows several galaxy groups just in the east region, in particular the very significant NE group (possibly associated with the X-ray structure Wav-NE), supporting the hypothesis proposed by Giovannini et al. (2010).
In conclusion, ZwCl2341+00 is a massive galaxy system characterized by a complex merging process involving several subsystems. Thus, the detection of diffuse radio emission associated with this cluster is not surprising evidence. However, the measurement of a larger number of galaxy redshifts on a wider sky region would be desirable to better characterize the dynamical properties of the detected subsystems and to extend the investigation to the large-scale galaxy structure around the cluster. At the same time, new long exposure time (100 ks) X-ray data would greatly increase our knowledge of the thermal properties of this cluster and its substructures.
Acknowledgements
We are in debt with Gabriele Giovannini for the VLA radio image he kindly provided us. We also thank the anonymous referee for his/her useful comments and suggestions. MG acknowledges financial support from PRIN-INAF2010 and PRIN-MIUR 2010-11 (J91J12000450001). RB acknowledges financial support from the Spanish Ministry of Economy and Competitiveness (MINECO) under the 2011 Severo Ochoa Program MINECO SEV-2011-0187 and the Programa Nacional de Astronomía y Astrofísica AYA2010-21887-C04-04.
This publication is based on observations made on the island of La Palma with the Italian Telescopio Nazionale Galileo (TNG), which is operated by the Fundación Galileo Galilei – INAF (Istituto Nazionale di Astrofisica) and is located in the Spanish Observatorio of the Roque de Los Muchachos of the Instituto de Astrofísica de Canarias.
This research has made use of the galaxy catalogue of the Sloan Digital Sky Survey (SDSS). The SDSS web site is http://www.sdss.org/, where the list of the funding organizations and collaborating institutions can be found.
References
- Akamatsu & Kawahara (2013) Akamatsu H., Kawahara H., 2013, PASJ, 65, 16
- Ashman et al. (1994) Ashman K. M., Bird C. M., Zepf S. E., 1994, AJ, 108, 2348
- Bagchi et al. (2002) Bagchi J., Ensslin T. A., Miniati F., Stalin C. S., Singh M., Raychaudhury S., Humeshkar N. B., 2002, New Astron., 7, 249
- Bagchi et al. (2011) Bagchi J., et al., 2011, Mem. Soc. Astron. Ital., 82, 561
- Barrena et al. (2011) Barrena R., Girardi M., Boschin W., de Grandi S., Eckert D., Rossetti M., 2011, A&A, 529, A128
- Beers et al. (1990) Beers T. C., Flynn K., Gebhardt K., 1990, AJ, 100, 32
- Beers et al. (1991) Beers T. C., Forman W., Huchra J. P., Jones C., Gebhardt K., 1991, AJ, 102, 1581
- Beers et al. (1992) Beers T. C., Gebhardt K., Huchra J. P., Forman W., Jones C., Bothun G. D., 1992, ApJ, 400, 410
- Bird (1994) Bird C. M., 1994, AJ, 107, 1637
- Bird & Beers (1993) Bird C. M., Beers, T. C., 1993, AJ, 105, 1596
- Boschin et al. (2004) Boschin W., Girardi M., Barrena R., Biviano A., Feretti L., Ramella M., 2004, A&A, 416, 839
- Boschin et al. (2012a) Boschin W., Girardi M., Barrena R., Nonino M., 2012a, A&A, 540, A43
- Boschin et al. (2012b) Boschin W., Girardi M., Barrena R., 2012b, A&A, 547, A44
- Brown & Rudnick (2009) Brown S., Rudnick L., 2009, AJ, 137, 3158
- Brunetti et al. (2009) Brunetti G., Cassano R., Dolag K., Setti G., 2009, A&A, 507, 661
- Cassano et al. (2006) Cassano R., Brunetti G., Setti G., 2006, MNRAS, 369, 1577
- den Hartog & Katgert (1996) den Hartog R., Katgert P., 1996, MNRAS, 279, 349
- Dressler (1980) Dressler A., 1980, ApJ, 236, 351
- Dressler & Schectman (1988) Dressler A., Shectman S. A., 1988, AJ, 95, 985
- Ensslin et al. (1998) Ensslin T. A., Biermann P. L., Klein U., Kohle S., 1998, A&A, 332, 395
- Fadda et al. (1996) Fadda D., Girardi M., Giuricin G., Mardirossian F., Mezzetti M., 1996, ApJ, 473, 670
- Fasano et al. (1987) Fasano G., Franceschini A., 1987, MNRAS, 225, 155
- Feretti (1999) Feretti L., 1999, MPE Rep., 271, 3
- Feretti et al. (2012) Feretti L., Giovannini G., Govoni F., Murgia M., 2012, A&AR, 20, 54
- Ferrari et al. (2003) Ferrari C., Maurogordato S., Cappi A., Benoist C., 2003, A&A, 399, 813
- Ferrari et al. (2008) Ferrari C., Govoni F., Schindler S., Bykov A. M., Rephaeli Y., 2008, Space Sci. Rev., 134, 93
- Giovannini et al. (2010) Giovannini G., Bonafede A., Feretti L., Govoni F., Murgia M., 2010, A&A, 511, L5
- Girardi & Mezzetti (2001) Girardi M., Mezzetti M., 2001, ApJ, 548, 79
- Girardi et al. (1996) Girardi M., Fadda D., Giuricin G., Mardirossian F., Mezzetti M., Biviano A., 1996, ApJ, 457, 61
- Girardi et al. (1997) Girardi M., Escalera E., Fadda D., Giuricin G., Mardirossian F., Mezzetti M., 1997, ApJ, 482, 11
- Girardi et al. (1998) Girardi M., Giuricin G., Mardirossian F., Mezzetti M., Boschin W., 1998, ApJ, 505, 74
- Girardi et al. (2010a) Girardi M., Barrena R., Boschin W., 2010a, in ‘Galaxy Clusters: Observations, Physics and Cosmology’. Published online at the site http://www.mpa-garching.mpg.de/clust10/
- Girardi et al. (2010b) Girardi M., Boschin W., Barrena R., 2010b, A&A, 517, A65
- Girardi et al. (2011) Girardi M., Bardelli S., Barrena R., Boschin W., Gastaldello F., Nonino M., 2011, A&A, 536, A89
- Goto et al. (2002) Goto T. et al., 2002, AJ, 123, 1807
- Govoni et al. (2001) Govoni F., Ensslin T. A., Feretti L., Giovannini G., 2001, A&A, 369, 441
- Hoeft et al. (2004) Hoeft M., Brüggen M., Yepes G., 2004, MNRAS, 347, 389
- Kim et al. (1989) Kim K.-T., Kronberg P. P., Giovannini G., Venturi T., 1989, Nature, 341, 720
- Maurogordato et al. (2011) Maurogordato S., Sauvageot J. L., Bourdin H., Cappi A., Benoist C., Ferrari C., Mars G., Houairi K., 2011, A&A, 525, A79
- Murgia et al. (2010) Murgia M., Govoni F., Feretti L., Giovannini G., 2010, A&A, 509, A86
- Pisani (1993) Pisani A., 1993, MNRAS, 265, 706
- Pisani (1996) Pisani A., 1996, MNRAS, 278, 697
- Pizzo et al. (2008) Pizzo R. F., de Bruyn A. G., Feretti L., Govoni F., 2008, A&A, 481, L91
- Roettiger et al. (1999) Roettiger K., Burns J. O., Stone J. M., 1999, ApJ, 518, 603
- Serna & Gerbal (1996) Serna A., Gerbal D., 1996, A&A, 309, 65
- Serra & Diaferio (2013) Serra A. L., Diaferio A., 2013, ApJ, 768, 116
- Shapiro & Silk (1965) Shapiro S. S., Wilk M. B., 1965, Biometrika, 52, 591
- Tonry & Davis (1979) Tonry J., Davis M., 1979, AJ, 84, 1511
- van Weeren et al. (2009a) van Weeren R. J. et al., 2009a, A&A, 506, 1083
- van Weeren et al. (2009b) van Weeren R. J., Intema H. T., Oonk J. B. R., Röttgering H. J. A., Clarke T. E., 2009b, A&A, 508, 1269
- Venturi (2011) Venturi T., 2011, Mem. Soc. Astron. Ital., 82, 499
-
a
These quantities are computed weighting galaxies according to their partial membership to both the 1D-KMM groups (see text). For other subclusters we use the usual robust estimates on group members.
-
a
Significance estimate in units of , computed by dividing the net source counts by the “Gehrels error” of the background counts in the source region (see CIAO manual for details).