Deep Luminosity Functions and Colour-Magnitude Relations for Cluster Galaxies at
Abstract
We derive deep band luminosity functions and colour-magnitude diagrams from HST imaging for eleven clusters observed at various stages of merging, and a comparison sample of five more relaxed clusters at similar redshifts. The characteristic magnitude evolves passively out to , while the faint end slope of the luminosity function is at all redshifts. Cluster galaxies must have been completely assembled down to out to . We observe tight colour-magnitude relations over a luminosity range of up to 8 magnitudes, consistent with the passive evolution of ancient stellar populations. This is found in all clusters, irrespective of their dynamical status (involved in a collision or not, or even within subclusters for the same object) and suggests that environment does not have a strong influence on galaxy properties. A red sequence luminosity function can be followed to the limits of our photometry: we see no evidence of a weakening of the red sequence to . The blue galaxy fraction rises with redshift, especially at fainter absolute magnitudes. We observe bright blue galaxies in clusters at that are not encountered locally. Surface brightness selection effects preferentially influence the detectability of faint red galaxies, accounting for claims of evolution at the faint end.
keywords:
Galaxies: luminosity functions, mass functions — Galaxies: formation — Galaxies: dwarf1 Introduction
Galaxy populations in clusters may be regarded as a volume-limited sample of objects, observed at the same cosmic epoch and lying within similar peaks in the dark matter distribution at each lookback time. Cluster members have a high surface density on the sky and can therefore be identified (in a statistical sense) from the surrounding field, allowing us to study the properties of galaxies (even at high redshift, with bona fide clusters now known at ; Zeimann et al. 2012) without observationally expensive spectroscopic campaigns. The evolution of cluster galaxies provides a benchmark to test theories of galaxy formation and especially the relative influence of initial conditions versus environmental effects. Mechanisms such as ram stripping by the hot X-ray gas, multiple interactions between galaxies (harassment) and tides induced by the cluster potential may all conspire to alter the evolution of galaxies in clusters. Nevertheless, these objects still provide useful clues to the history of galaxy assembly and the formation of their stellar populations. We may envisage that through studies of clusters of different masses, and lower density regions within individual objects (e.g., outskirts, subclusters) we will be able to relate cluster galaxy evolution to the more general case of field galaxies, while a comparison between the behaviour in the field and clusters may yield experimental tests of how galaxy evolution depends on their surroundings.
A series of papers have examined the luminosity function of galaxies in clusters to trace the history of mass assembly and these have generally agreed that most massive cluster galaxies have formed rapidly at high redshift (e.g., De Propris et al. 1999; Andreon 2006; De Propris et al. 2007; Muzzin et al. 2008; Mancone et al. 2010 and references therein). Local and high redshift cluster galaxies also exhibit a well-defined ‘red sequence’ of early-type galaxies. The red sequence is observed even in the most distant clusters yet studied in detail (e.g., Papovich et al. 2010) and is believed to be driven by a mass-metallicity relation, with the small intrinsic scatter representing a small spread in ages. Together with the tight Fundamental Plane relations, even at high redshifts (Holden et al., 2010), this is consistent with the pure passive evolution of the stellar populations formed at high redshift in short star formation episodes.
While massive galaxies may have formed early, it is likely that low luminosity (dwarf) galaxies have undergone a more extended formation history, as in the ‘downsizing’ model of Cowie et al. (1996). For example, Local Group dwarfs have complex stellar populations, with multiple star formation and enrichment episodes (e.g., Weisz et al. 2011). In particular, star-forming dwarf irregulars may be efficiently quenched to produce quiescent dwarf spheroidals, with this process moving progressively to higher masses with increasing redshift (Cowie et al. 1996; Perez-Gonzalez et al. 2008). In agreement with this picture, the luminosity function of red sequence galaxies appears to weaken at the faint end as a function of redshift in the COSMOS and Extended Groth Strip fields (Bell et al. 2004; Faber et al. 2007 et seq.). A similar decrease in the fraction of red sequence galaxies may be taking place in clusters as well (De Lucia et al. 2007 and subsequent studies, but see Andreon 2008 for an opposing view). However, Mancone et al. (2012) determine the faint end slope of the luminosity function in the rest-frame band for seven clusters and find that it is consistent with the local value of , which implies an early formation history for these low luminosity objects as well.
In order to explore complex themes, such as these, it is often useful to examine possible extreme cases. In particular, one of the proposed mechanisms for the quenching of star formation in cluster galaxies is ram pressure stripping as galaxies move through the cluster gas (e.g., Quilis, Moore & Bower 2000). The most extreme such cases are collisions between clusters, as for instance in the ‘Bullet’ cluster (1E0657-558; Tucker et al. 1998; Markevitch et al. 2002), where X-ray observations show a bullet-like cloud which has passed through the main cluster at a velocity estimated at km s-1 around 150 Myr ago. Combinations of optical, X-ray and gravitational weak lensing maps demonstrate that the shocked, colliding gas has been swept out of the clusters and is now situated between the outward travelling galaxies and dark mass concentrations (see e.g., Markevitch et al. 2004; Clowe et al. 2006). This is equivalent to a ram stripping wind at least two orders of magnitude greater than has been experienced by any galaxy in its motion through its own cluster X-ray gas. In these environments, the effects of ram stripping should trump any other influence on the evolution of cluster members and can be studied in relative isolation.
In the present paper, we therefore consider the effect that a major, supersonic, collision between clusters has had on the evolution of the galaxies they contain. Besides being an extreme dynamical environment, there may in this case also be the opportunity to look at the individual influences of the gas, galaxies and dark matter. This provides a useful counterpart to the similar study of more ‘normal’ clusters that we have initially carried out in Harsono & De Propris (2009) and a few comparison objects that we present here as part of a broader analysis.
The following sections describe, in this order, the dataset and its analysis, the luminosity functions for the whole population (split by subcluster where possible), the colour-magnitude relations and from these the luminosity distributions for galaxies in the red sequence and blue cloud. We finally discuss our findings in context and present avenues for future work. We assume the latest cosmological parameters from the WMAP 9 year dataset presented in Hinshaw et al. (2012). Extinction values for our fields are derived from the latest reanalysis of COBE/DIRBE data by Schlafly & Finkbeiner (2011).
2 Dataset
The clusters selected for this study consist of a sample of 11 ‘collisional’ clusters, identified on the basis of deep X-ray observations, optical data and analysis of the weak and strong lensing. In addition, our sample includes a few ‘normal’ clusters at similar redshifts, which are part of a broader study we are carrying out. These are discussed separately, although the analysis we describe below also applies to these latter objects.
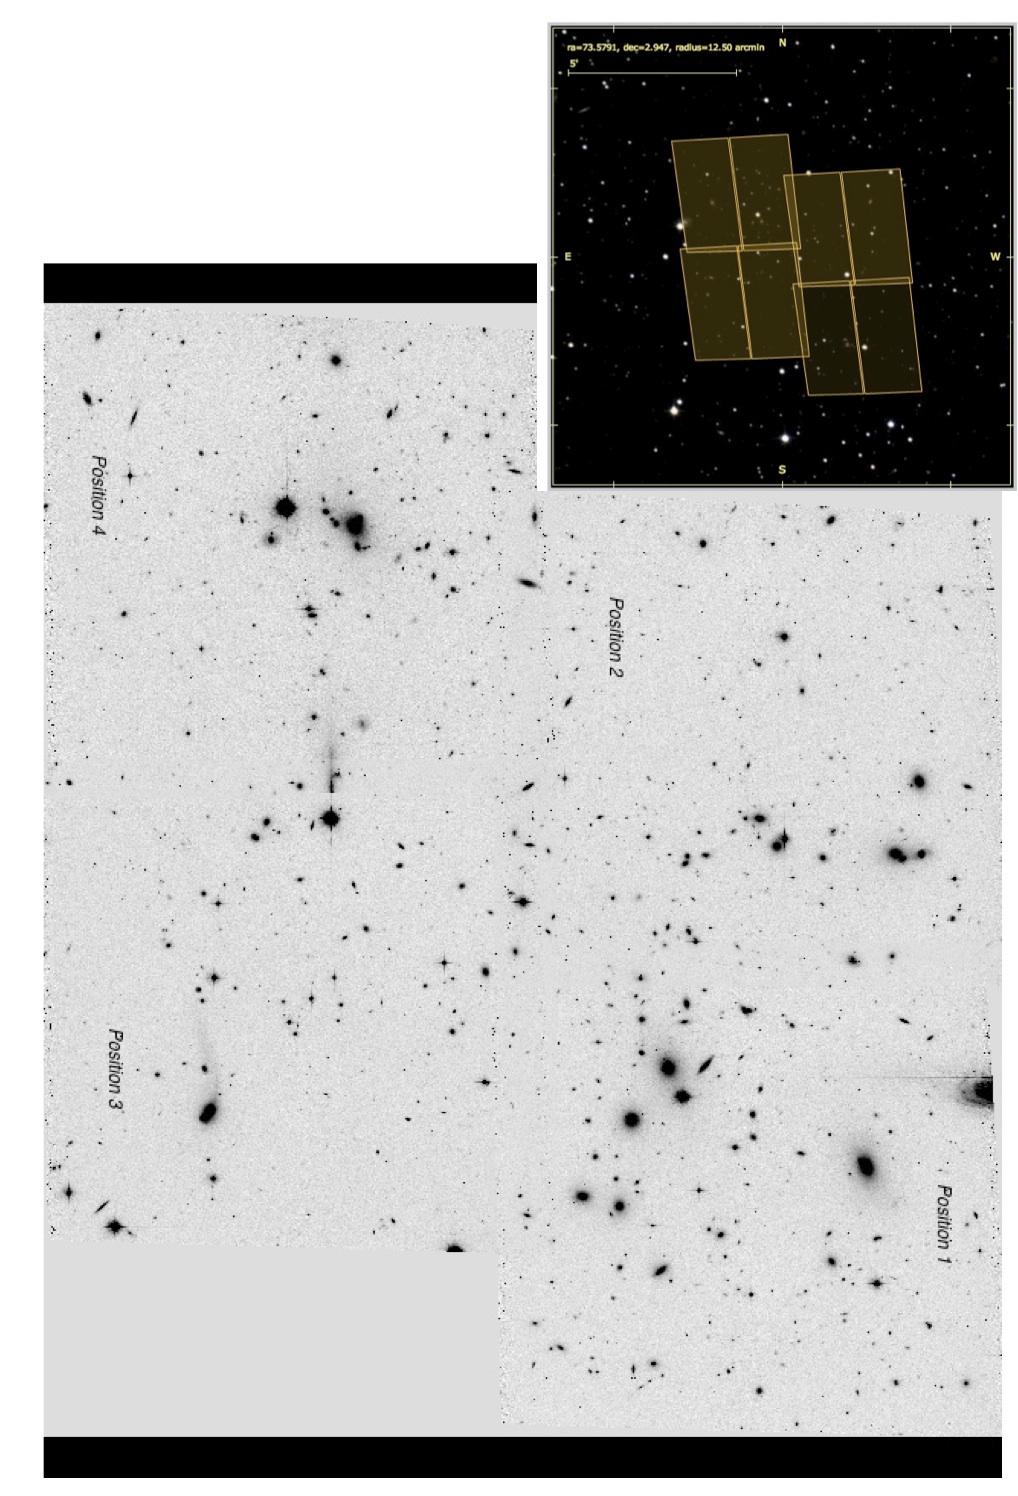
We have retrieved (F606W) and (F814W) images of our selected objects from the Hubble Legacy Archive (HLA). Table 1 presents a summary of the images, exposure times, program IDs and other necessary information. In some cases we have photometry for other bands and this will be considered in future papers and in other contexts. All data were retrieved as fully calibrated and drizzled files from the HLA server and/or the Barbara Mikulski Archive for the Space Telescope (MAST). Grayscale images of these objects, from the Palomar Observatory Sky Survey (POSS), with the positions of ACS fields superposed, can be found in the Appendix section. Here we show the one for Abell 520 in Figure 1 by way of example.
Our sample includes the following clusters:
-
•
Abell 520 is arguably the most primitive object and consists of three separate groups accreting along filaments to form a massive cluster (Girardi et al., 2008). The X-ray plasma appears to be separate from the galaxies, which instead coincide with the dark matter distribution (Clowe et al., 2012). The data here consist of four ACS fields in and (see Table 1 for a summary) in a mosaic with a slight overlap. Figure 1 shows the ACS footprints over a Palomar Observatory Sky Survey plate. We refer to these as Positions 1-4 in a ’Z’ pattern, with position 1 at the top right. In order to provide an idea of the quality of the data, we also show an HST mosaic for this object in Figure 1. Similar figures (showing the HST footprints, but not the HST images, which can be easily retrieved from the archives) are presented for all other clusters we consider in this paper in the Appendix.
-
•
Abell 1758 contains two subclusters, each of which seems to be undergoing a separate merger. The Northern cluster (studied here) has a double peaked X-ray structure, of which one component coincides with the galaxy distribution (Ragozzine et al., 2012). Two ACS fields have been observed, one on each peak in the Northern cluster. Position 1 in Table 1 is to the South-East and Position 2 to the North West.
-
•
Abell 2163 also has complex dynamics and exceptional X-ray properties (high temperature and luminosity) and is believed to be a multiple merger observed 1 Gyr after the main crossover (Bourdin et al., 2011; Soucail, 2012). Two ACS pointings are available in this field. Position 1 in Table 1 is to the North East and position 2 to the South West.
-
•
The Bullet cluster has been discussed in detail above. The available HST pointings image both the main cluster to the East and the bow shock region corresponding to a lower mass subcluster to the West that has crossed the more massive object about 0.2 Gyr ago.
-
•
Abell 2744 appears to have a very complex structure, with ‘dark’, ‘ghost’, ‘bullet’ and ‘stripped’ substructures (Merten et al., 2011), and may be a very active cluster merger. Owers et al. (2011) have used radial velocity information to trace the paths of three merger components (two major and one minor) in this cluster. We use a single HST image in this cluster, covering the main structures.
-
•
MACS0553.4-3342 lies at , is very luminous in the X-rays and seems to consist of a linear collision between nearly equal mass subclusters (Ebeling et al., 2010).
-
•
MACS J0358.8-2955 is a massive cluster merger at where Chandra images show a strong separation between dark matter and the X-ray gas with a linear post-collision geometry. It appears to be the results of a complex merger of at least three subclusters (Hsu et al., 2012).
-
•
MACS1226.8+2153 is a rare triple cluster merger at lying in a deep node of filaments and dark matter structures, showing several large arcs (Ebeling et al., 2010). The three regions are denominated in Table 1 as the Central, North Eastern and Southern components and these can also be identified from the associated POSS images with the ACS coverage in the Appendix.
-
•
DLSCL J0916.2+2951 is a dissociative cluster merger at observed about 0.7 Gyr after first pass and may represent a more evolved version of the Bullet Cluster (Dawson et al., 2012). The two components (see Appendix for the HST coverage) are referred here as the Southern and Western one.
- •
-
•
CL 0025-1222 consists of two merging subclusters of nearly equal mass at , with the dark matter distribution coinciding with the galaxies and clearly separated from the X-ray emitting gas (Bradac et al., 2008).
| Cluster | Passband | Exposure | Area | Proposal | PI | |
|---|---|---|---|---|---|---|
| [s] | [arcmin2] | |||||
| A520a | 0.199 | 2332 | 45.19 | 12253 | Clowe | |
| 4570 | ||||||
| A2163b | 0.203 | 2340 | 23.33 | 12253 | Clowe | |
| 4596 | ||||||
| A1758b | 0.279 | 2544 | 12.42 | 12253 | Clowe | |
| 2500 | 12.40 | |||||
| Bulletb | 0.296 | 2336 | 18.06 | 10200 | Jones | |
| 4004 | 11.33c | 10200 | Jones | |||
| 4480 | 11.33d | 11491e | Kneib | |||
| A2744 | 0.308 | 5356 | 12.05f | 11689 | Dupke | |
| MACS0553.4-3342 | 2092 | 11.70g | 12362 | Ebeling | ||
| 4572 | 11.70 | |||||
| MACS1226.8+2153 Ch | 1200 | 11.88 | 12166 | Ebeling | ||
| 1440 | 11.87 | |||||
| MACS1226.8+2153 NE | 2040 | 8.35 | 12368 | Morris | ||
| 2040 | 8.35 | |||||
| MACS1226.8+2153 S | 2040 | 12.05 | 12368 | Morris | ||
| 2040 | 12.05 | |||||
| MACS0358.8-2955 | 2120 | 11.70 | 12313 | Ebeling | ||
| 4620 | 11.70 | |||||
| J0916+2951 South | 2520 | 12.41 | 12377 | Dawson | ||
| 4947 | 11.88 | |||||
| J0916+2951 West | 2520 | 11.88 | 12377 | Dawson | ||
| 4947 | 11.88 | |||||
| J0717+3745 | ||||||
| CL0025-1222 | 4140 | 11.71 | 10703 | Ebeling | ||
| 4200 | 11.71 | |||||
| CL0025-1222i | 4470 | 11.71 | 9722 | Ebeling | ||
| 4560 | 11.71 |
-
a
mosaic covering Chandra image
-
b
2 separate pointings on each concentration
-
c
Eastern Subcluster
-
d
Western Subcluster
-
e
Total coverage is 19.34 arcmin2; combined + area is 16.28 arcmin2
-
f
Combined and area is 10.21 arcmin2
-
g
Combined and area is 9.13 arcmin2
-
h
and overlap is 8.75 arcmin2
-
i
Outer field
3 Data Analysis: The Bullet Cluster
For each cluster we ran Sextractor (Bertin & Arnouts, 1996) with parameters as defined in Harsono & De Propris (2009) to yield accurate and complete detections with a minimum of contamination from cosmetic features and especially arclets which are present in abundance in the cluster fields. We obtained both a ‘total’ magnitude and an aperture value, set to match the metric aperture of kpc (diameter) for Coma galaxies presented in Eisenhardt et al. (2007). All magnitudes are in the AB system, using the latest zeropoints as calculated on the HST web site. The images were then visually inspected to remove spurious objects, arcs, bleeding trails from bright stars, detections on CCD edges, satellite streaks and other contaminants. Here we present our analysis of the Bullet cluster as an example of the procedures we carried out on all objects in our sample.
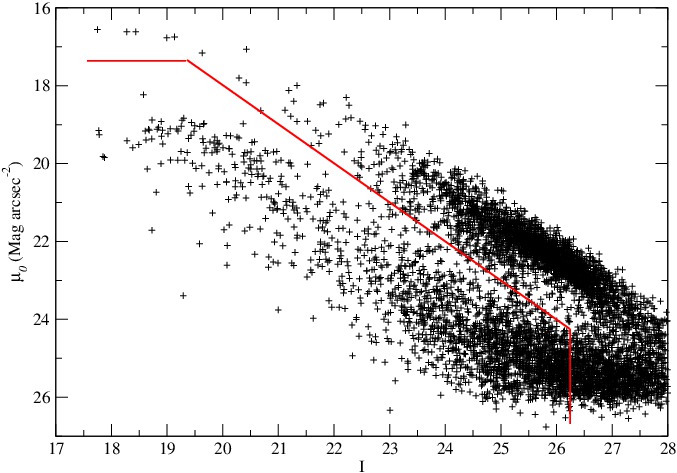
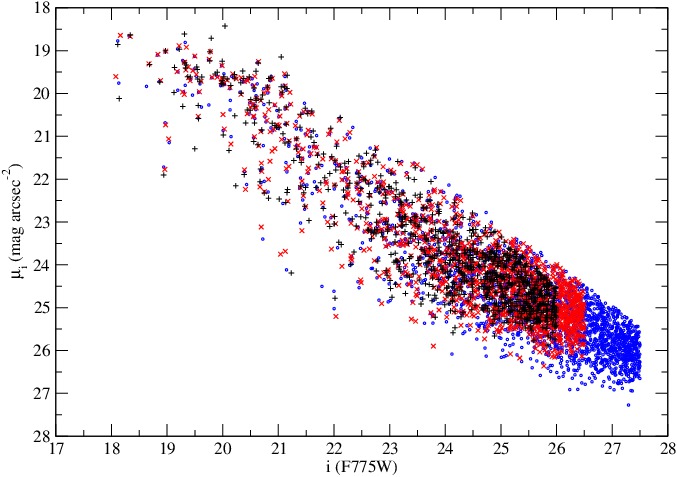
We used a comparison between the aperture magnitude (used for detection) and total magnitude to carry our star-galaxy separation, as shown in Figure 2 for an example object. As we can see in this figure, we are also complete, in surface brightness, to about where we see a sharp cut in the central surface brightness distribution at mag arcsec-2. Based on stellar counts and simulations, the actual image completeness is 100% at and the detection threshold is close to , but galaxies are detected on the basis of their central surface brightness, which is much lower than for a star. Below the mag arcsec-2 limit galaxies do exit, but are not detected and therefore not measured; correcting for this incompleteness requires knowledge of the surface brightness distribution of galaxies, which is poorly known (see discussion of MS1358+62 below). We adopt as our photometric limit, where we are still highly complete and we can adequately separate stars and galaxies on their basis of their central concentrations. However, it is clear that at the galaxy counts are incomplete because of surface brightness selection effects (not the image detection limits), although we apply a similar surface brightness cut to the background fields (see below) we use, so that we are not favouring or disfavouring cluster members.
 |
 |
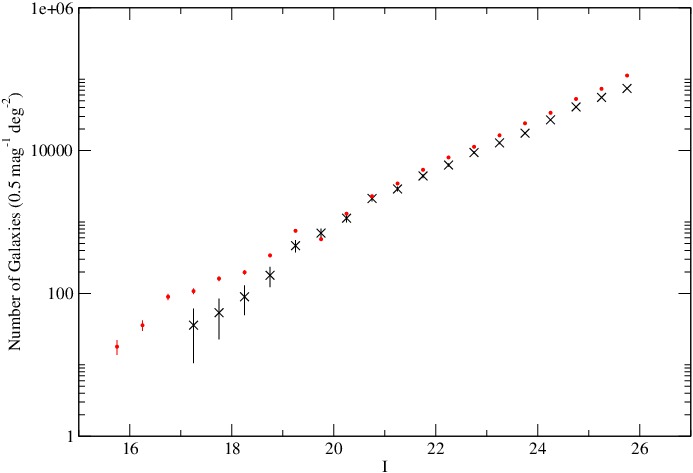
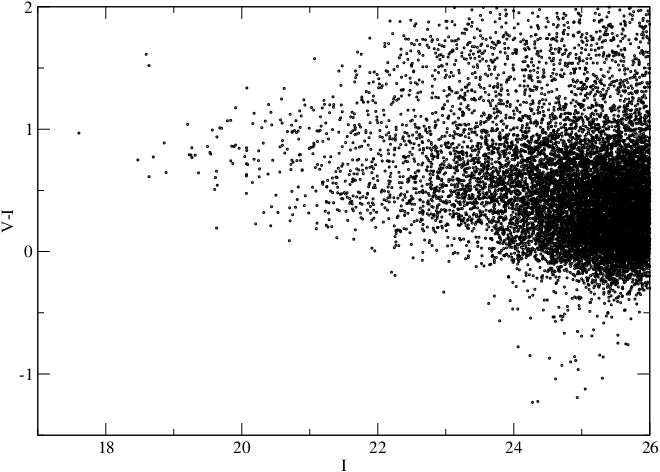
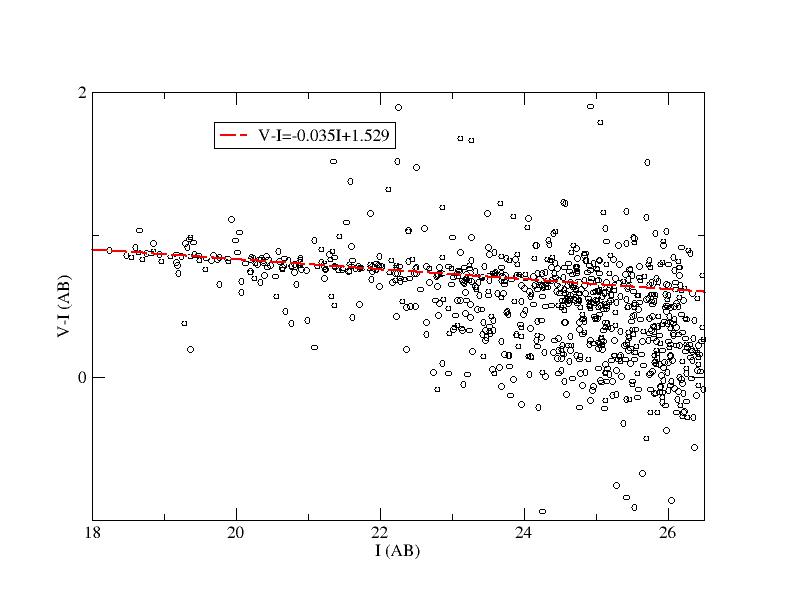
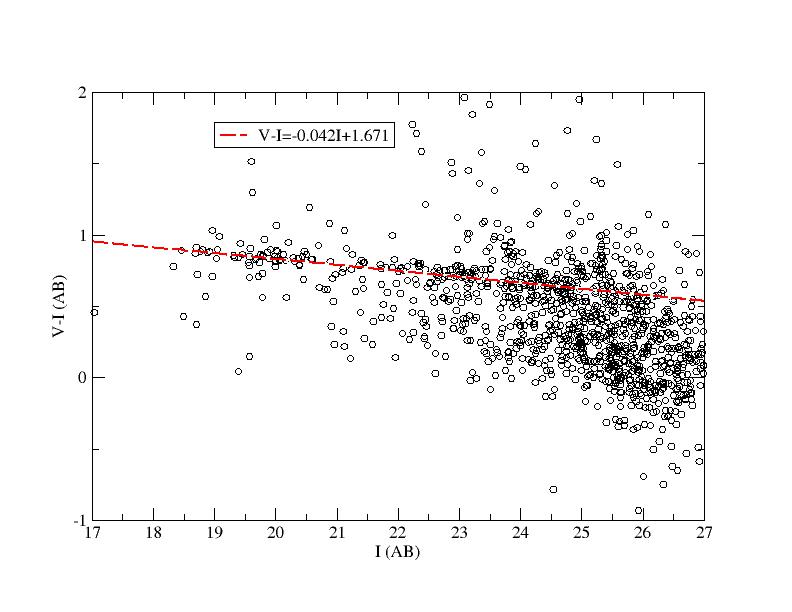
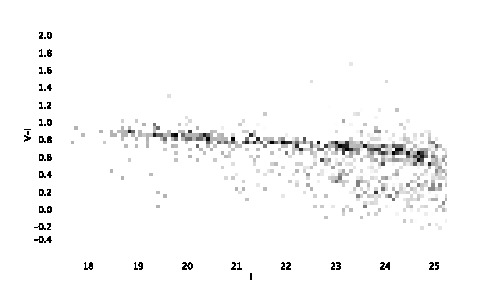
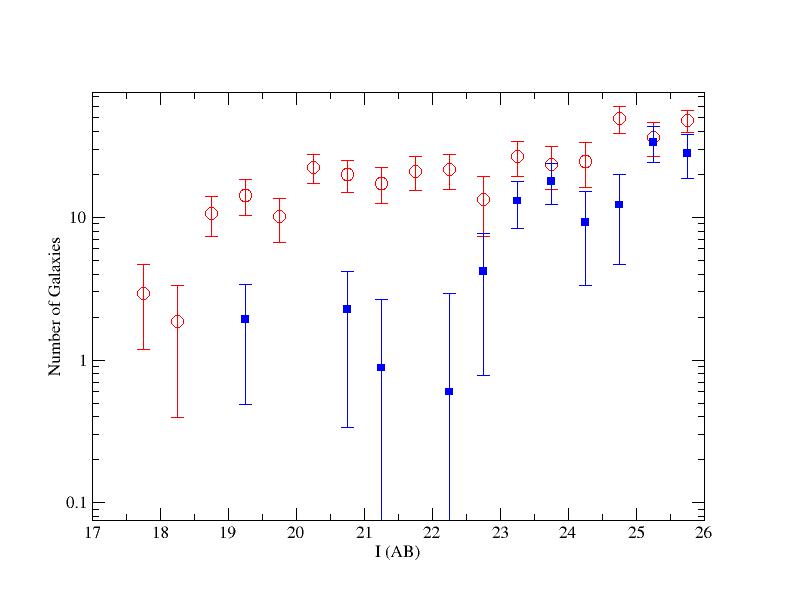
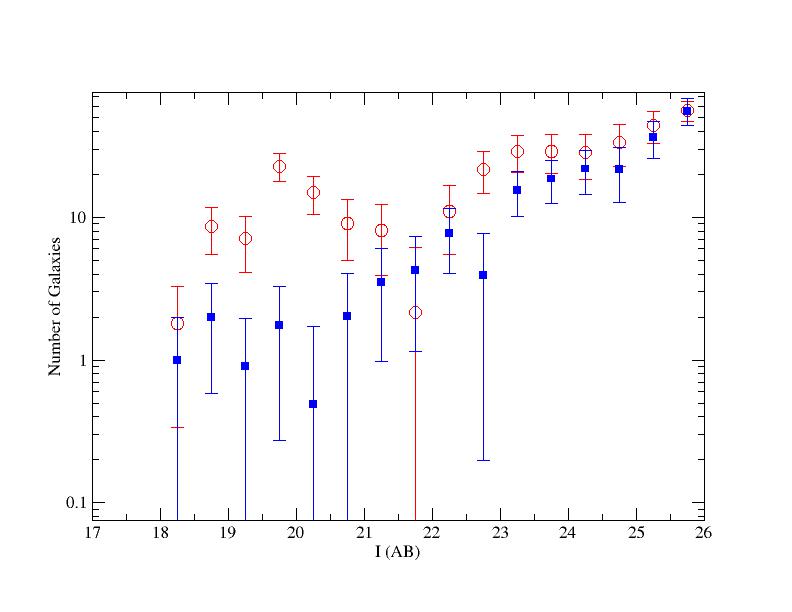
Galaxies in the cluster fields consist of cluster members plus foreground and background objects along the line of sight from Earth orbit to the cluster. We remove intervening galaxies statistically, by using counts in publicly available fields imaged with HST, chiefly the GOODS (Giavalisco et al., 2004) and CANDELS (Grogin et al., 2011; Koekemoer et al., 2011) surveys, that have the required depth and are wide enough to allow us to minimise the effects of clustering variations from intervening large scale structures. These are analysed in the same fashion as the cluster fields (photometry with the same parameters followed by similar visual inspection and selection of targets). Number counts in for the whole fields analysed so far as well as the selected colour-magnitude distribution are shown in Figure 3 and Figure 4 (where we show one subfield only, for purposes of illustration).
For all clusters we scaled the galaxy number counts in the field to the areas covered and subtracted the non-cluster contribution statistically, including contributions to the errors due to clustering variations (Peebles, 1975), following the method of Huang et al. (1997) as applied by Driver et al. (2003) in Abell 863 and Pracy et al. (2004) in Abell 2218. We should note here that the redshifts of our clusters are such that their distance is much greater than the largest structures observed in the 2dF and SDSS surveys and well beyond the maximum scale expected in CDM cosmology, and therefore that galaxy counts in their direction should approximate homogeneity.
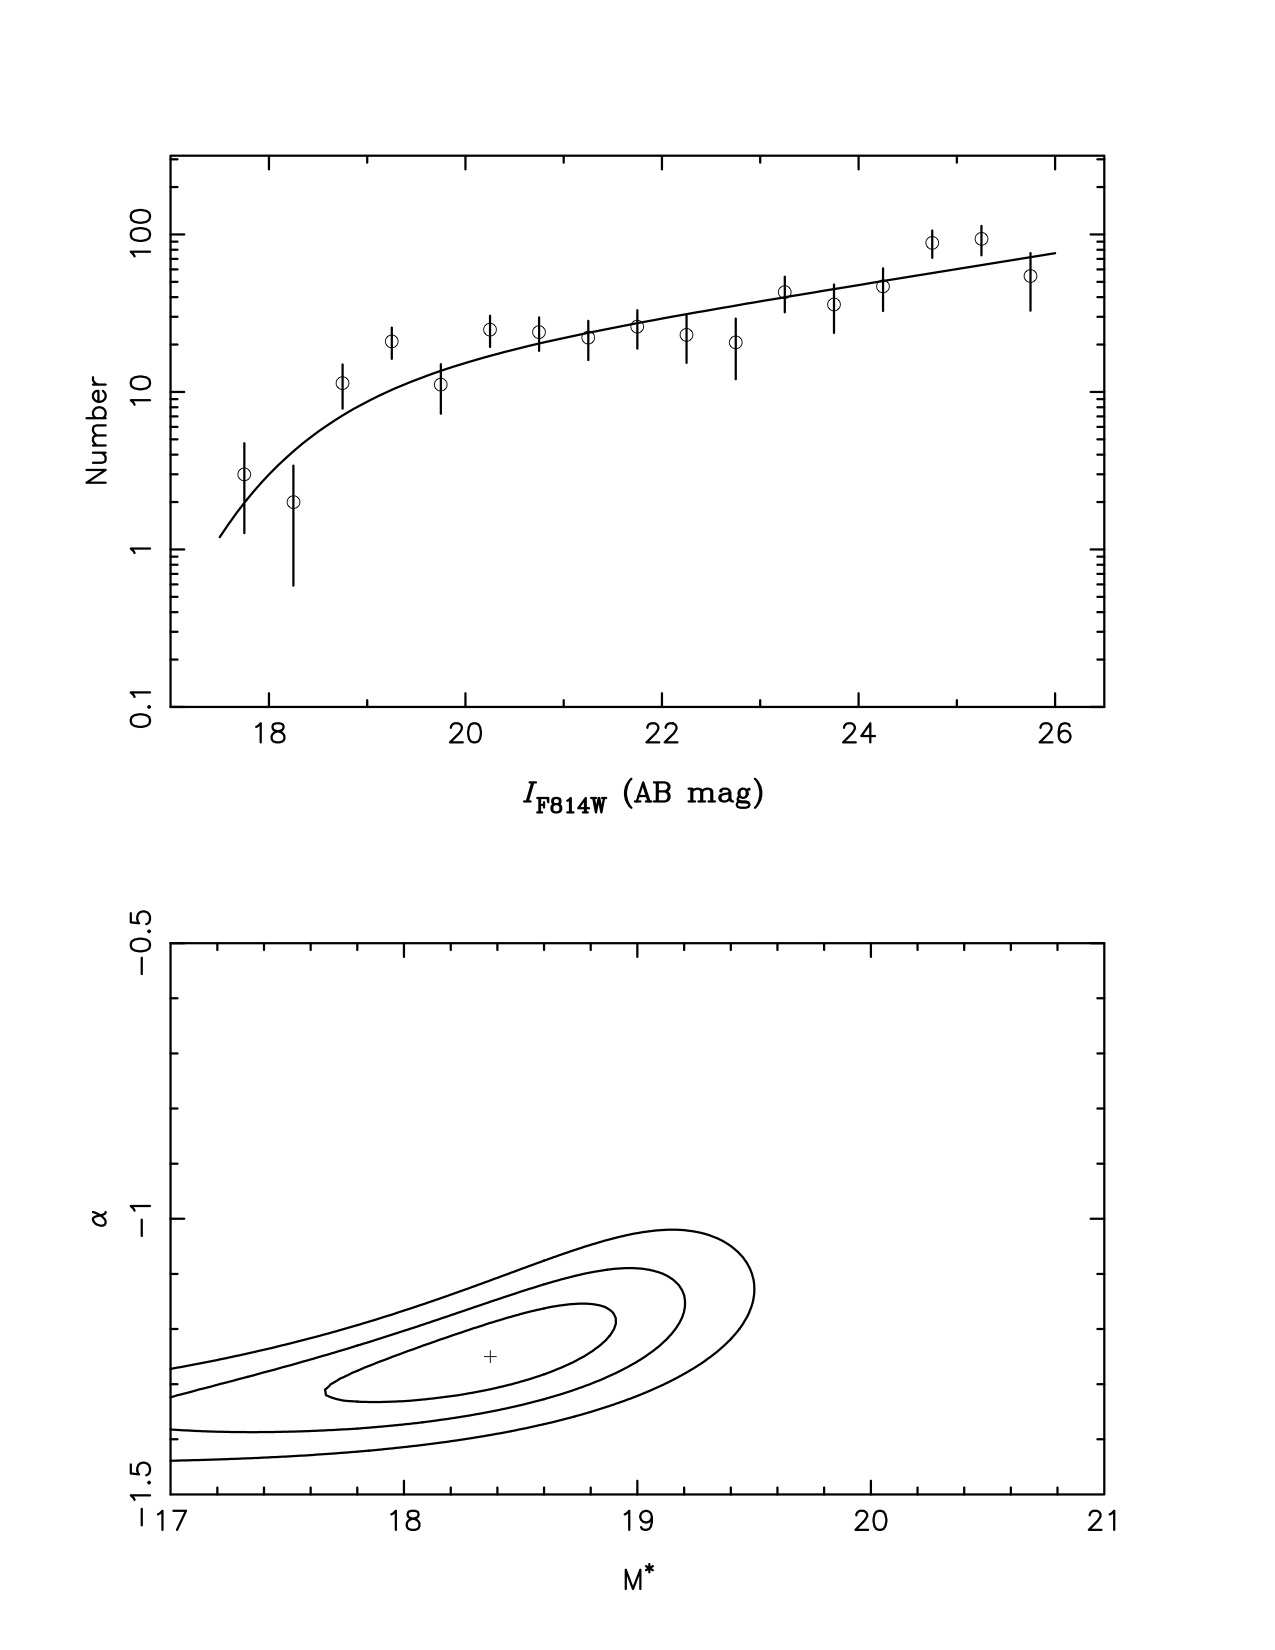
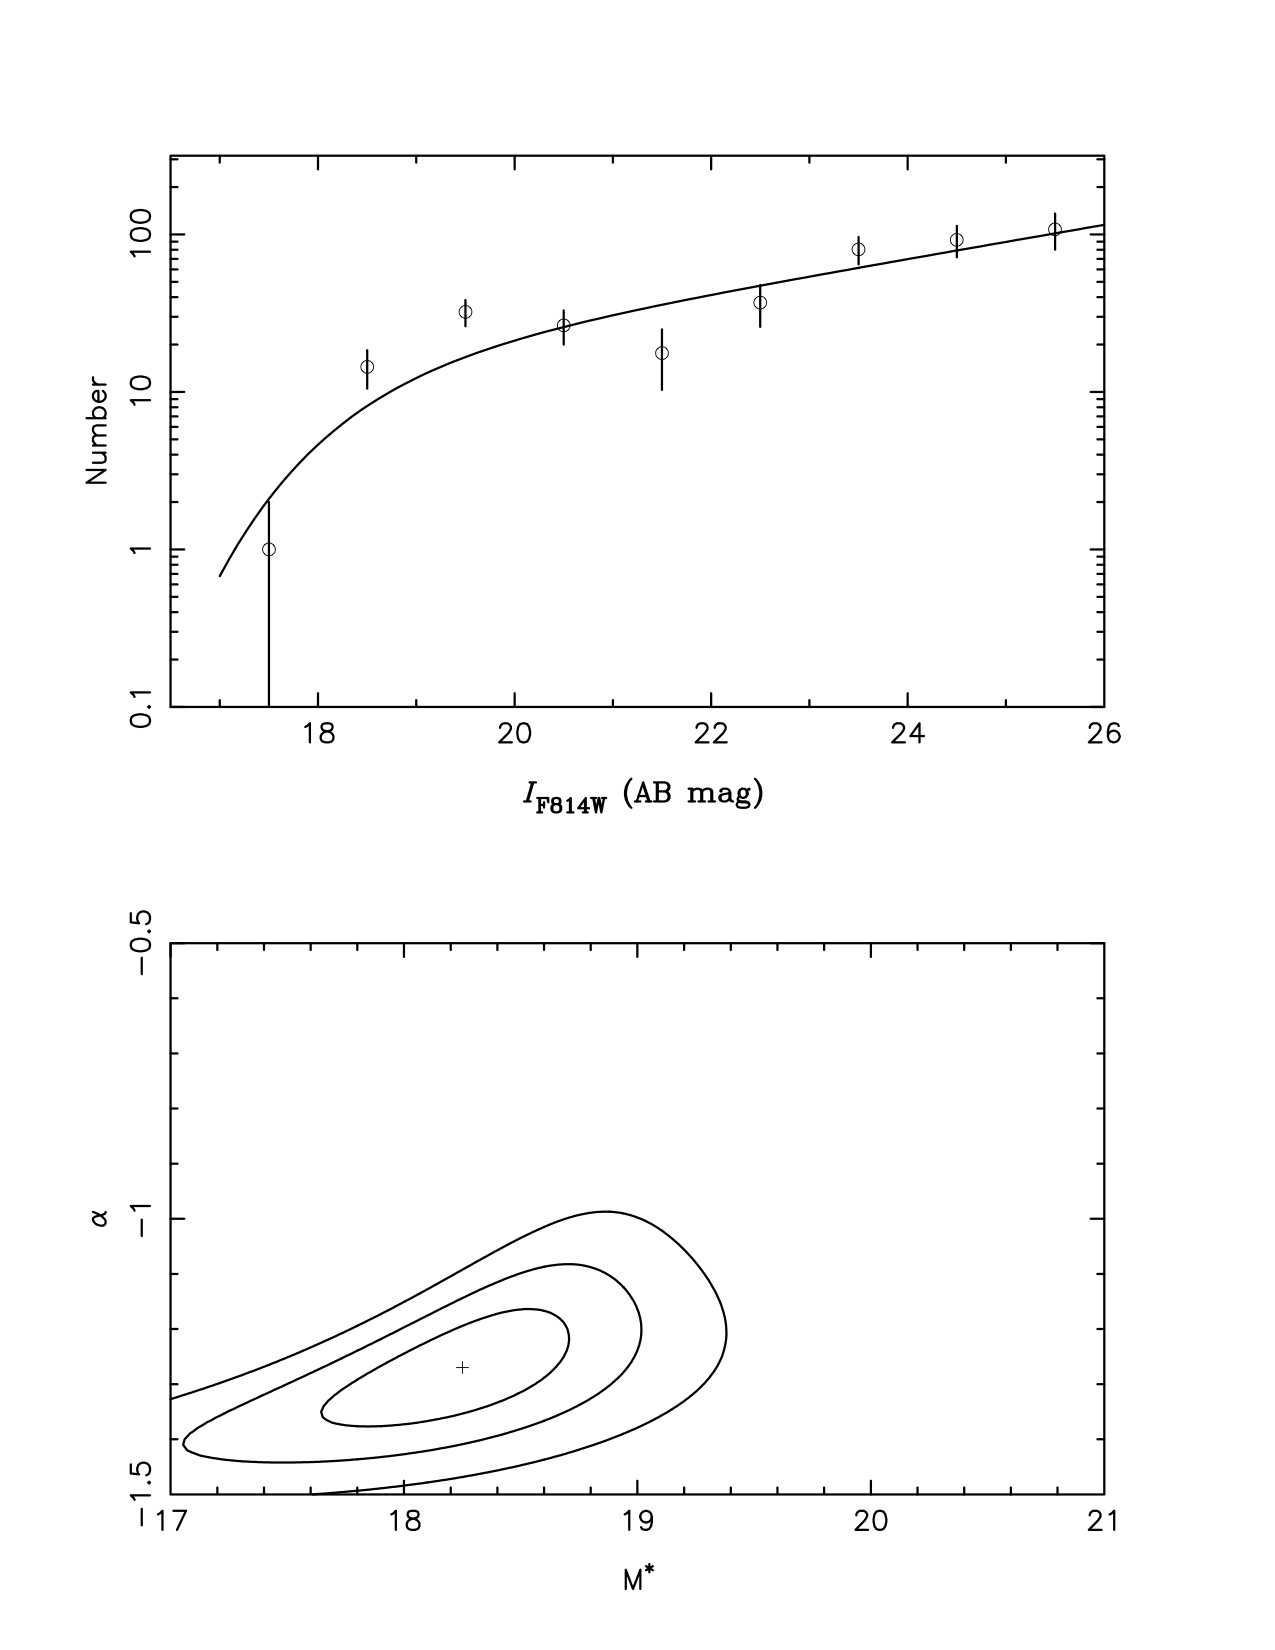
The subtracted counts yield a luminosity function for cluster galaxies (in a statistical sense), which we fit with a standard Schechter (1976) function, using an amoeba-like fitting package, that also gives us error ellipses at the level. As an example of our approach we show here the luminosity function in the band for the Bullet Cluster (both subclusters separately) and its best fit (with the associated error ellipse) in Figure 5. Other LFs for individual clusters are shown in the Appendix (on-line only). The luminosity function of galaxies in the Bullet subclusters appears to be a reasonable fit to a single Schechter function with parameters as given in Table 2.
We also derive a colour magnitude relation, by plotting colours (in fixed apertures) vs. total magnitude and using a ’robust’ routine to derive the best fitting straight line to the red sequence (Armstrong & Kung, 1978). These are plotted, for the Bullet the colour-magnitude relations and best fits are plotted in Fig 6, while the slope and intercept of the relations are also shown in Table 2.
 |
 |
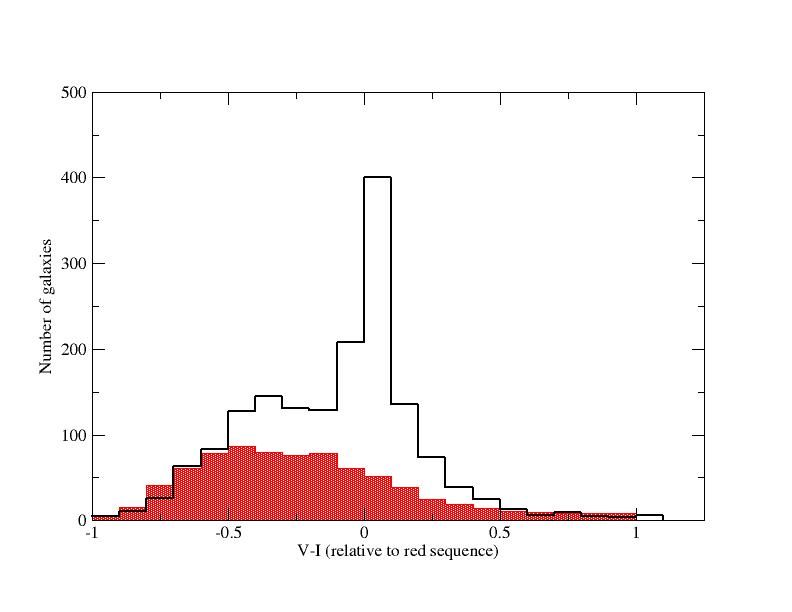
From this we can assign galaxies to the red sequence and blue cloud, and derive independent luminosity distributions for galaxies in these colour ranges. We plot the colour distribution relative to the red sequence (where the colour of the sequence itself is set to 0 at all ) for galaxies in the Bullet cluster in Figure 8. This shows a characteristic shape with a peak corresponding to the red sequence and a tail to redder colours (mostly background galaxies but possibly including dusty cluster members) and a second peak for the blue cloud (which includes background galaxies). The two peaks can be separated roughly at a colour difference of which we adopt here as a first order discriminant between red sequence and blue cloud objects. For example, De Lucia et al. (2007) use a colour range of mag. around the red sequence as their definition. The blue objects here include a wider range of galaxies than those usually considered within the classical Butcher-Oemler effect (Butcher & Oemler, 1978, 1984), which are usually bluer than the red sequence by about 0.4 mag. (in colour at these redshifts), and therefore represent a more complete sampling of the population of recently star-forming galaxies in each cluster.
For each cluster, we carry out an equivalent colour-cut on the field galaxy distributions (these of course differ from cluster to cluster) and then subtract the expected number counts for field galaxies within the colour regions corresponding to red and blue galaxies in each case. We show the colour distribution of the reference fields for the case of the Bullet cluster in Figure 8, where we can graphically see the impact of contamination on cluster membership (in a statistical sense) as a function of colour. We carry out a similar analysis for all other clusters in the sample. We then derive luminosity distributions for galaxies in the red sequence and blue cloud.
The colour split is illustrated in a different way in Figure 7. Each galaxy in the Bullet cluster field has been weighted by its cluster membership ‘likelihood’ and the density of weighted points in the colour-magnitude is shown. To obtain the likelihood (of being a cluster member) for any particular galaxy, we determine the number of ’background field’ (GOODS/CANDELS) galaxies () which have that galaxy as their nearest match in C-M space. If the background field has an area times the area of the cluster field then the likelihood that the chosen galaxy is a cluster member can be represented by . This can be negative, due to random fluctuations (though the sum of the weights gives the correct total number of cluster galaxies), so we smoooth slightly over the C-M distribution. Almost all galaxies redder than the red sequence are removed but the cluster’s blue cloud is preserved.
Figure 9 shows the derived red sequence and blue cloud luminosity functions for the two subclusters in the Bullet. The shape of the red sequence luminosity function is not well represented by a single monotonic Schechter function, but shows a ’dip’ or ’plateau’ at intermediate luminosities (), followed by a power-law rise at lower luminosities. These may be best fitted by a double Schechter function or a single Schechter function plus a power-law as in Phillipps & Driver (1995) and Popesso et al. (2006). The strength of this dip appears to depend on the richness of the cluster being observed. There is a clear lack of intermediate luminosity galaxies in the poorer Western subcluster whereas the dip shows as a flattening of the cluster number counts in the richer Eastern object, which is not easily distinguishable (at least in a statistical sense) from a single Schechter function. Similar behaviors are observed in other clusters in the sample as well: there is a clear inflection in the luminosity functions of red sequence galaxies in Abell 520 for example and in Abell 2744, but this is less evident in other clusters. The red sequence luminosity function of relatively massive nearby Abell clusters in Barkhouse et al. (2007) presents a similar behaviour, while Popesso et al. (2006) find a ’double-Schechter’ fit to the total luminosity functions of clusters in their SDSS/REFLEX sample.
4 Results
Here we discuss the luminosity functions, colour-magnitude relations and red sequence/blue cloud luminosity distributions for our full sample of collisional clusters and a comparison sample of clusters regarded as non-interacting, with the analysis as carried out above for the Bullet Cluster.
4.1 Luminosity Functions for Collisional Clusters
 |
 |
We show the luminosity function parameters (the apparent characteristic luminosity) and (the faint-end slope) for the best fits to a single Schechter function for all clusters (and their subclusters) in Table 2. The best fits and the relative error ellipses are presented in a series of figures similar to Figure 5 in the Appendix (we do not show these in the printed version in order to save space and focus the attention of the reader on the scientific results of this analysis).
| Cluster | CMR Slope | Intercept | ||
|---|---|---|---|---|
| A520a | 0.872e | |||
| A520b | ||||
| A520c | … | … | ||
| A520d | … | … | ||
| A2163a | 0.708e | |||
| A2163b | ||||
| A1758a | 0.886f | |||
| A1758b | ||||
| Bullet Eastern | 0.865f | |||
| Bullet Western | ||||
| Abell 2744 | 0.895f | |||
| MACS0553.4-3342 | 1.070g | |||
| MACS1226.8+2153 Center | 1.065g | |||
| MACS1226.8+2153 NE | ||||
| MACS1226.8+2153 S | ||||
| MACS0358.8-2955 | 1.045g | |||
| J0916+2951 South | 1.257g | |||
| J0916+2951 West | ||||
| J0717+3745 | 1.219g | |||
| CL0025-1222 |
-
a
Position 1
-
b
Position 2
-
c
Position 3
-
d
Position 4
-
e
Fit to all positions, intercept for
-
f
Fit to all positions, intercept for
-
g
Fit to all positions, intercept for
Within errors, and are very similar for clusters in the same redshift ranges, although errors on are above 0.3 mag. (this is poorly determined for single clusters because of small number statistics and the difficulty in fitting such a steeply varying function at the bright end) while typical errors on the faint-end slope are of the order of 20%. We find (including an -correction from a Bruzual & Charlot 2003 model assuming a formation redshift , a 1 Gy e-folding time and solar metallicity), and , over a range of up to 8 magnitudes (a factor of 1,000 in luminosity) reaching well into the regime of true dwarf galaxies, with , about 600 times fainter than the Milky Way and resembling Local Group dwarf spheroidals such as the Fornax and Carina dwarfs.
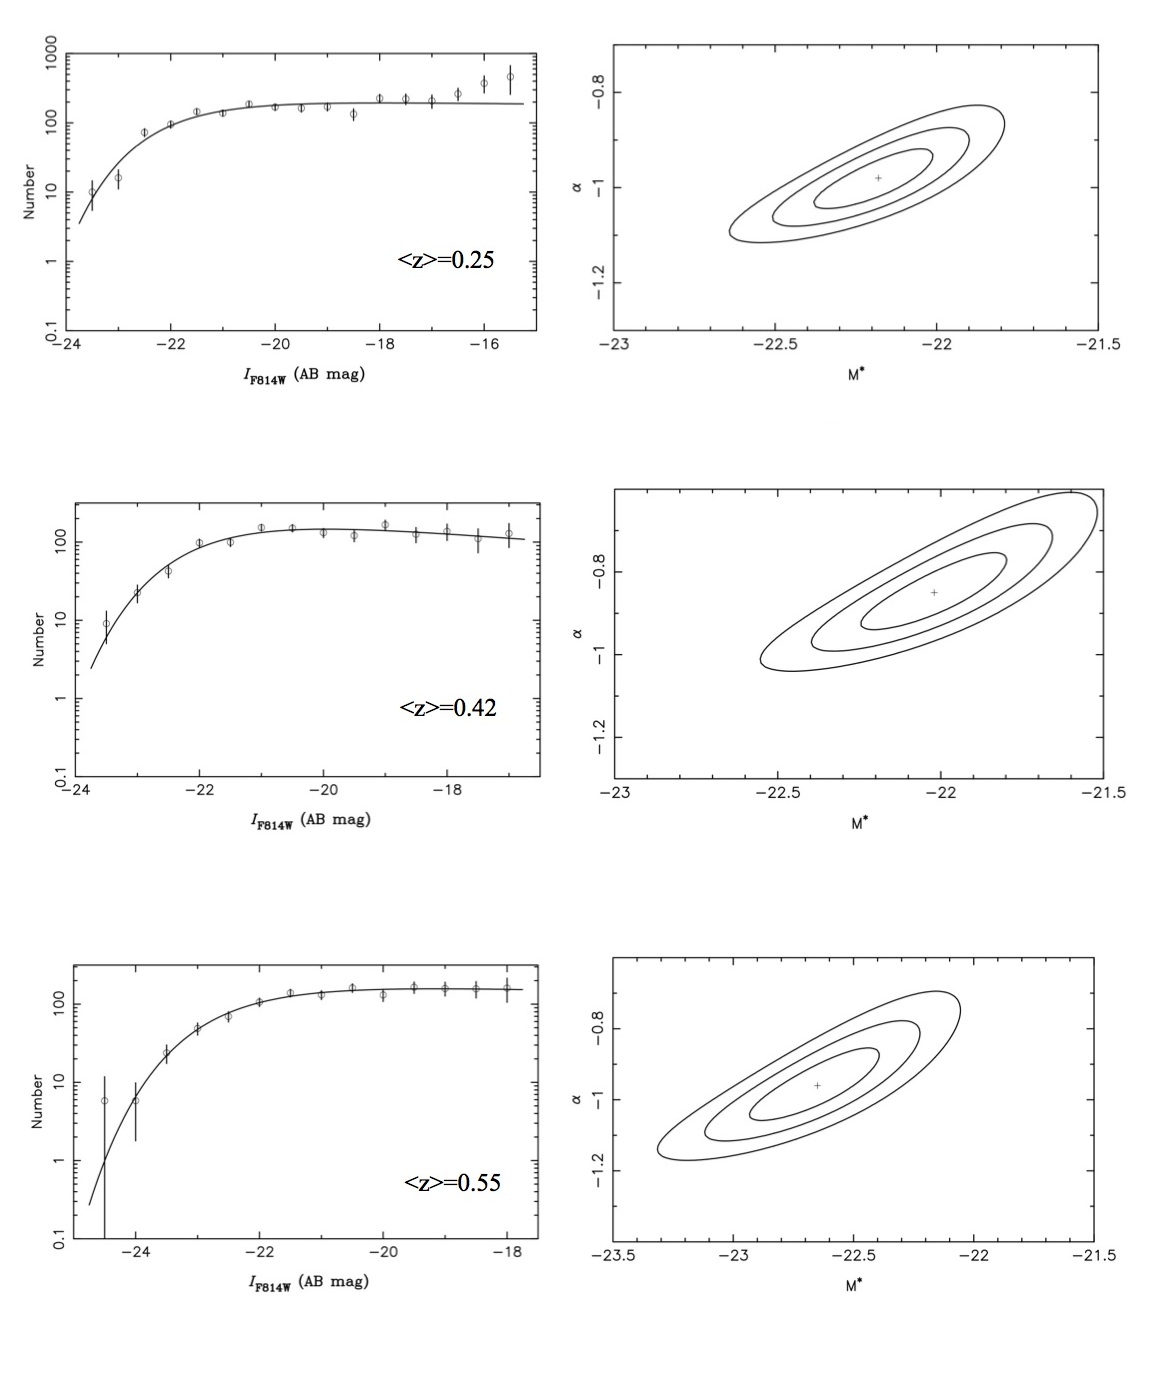
We derive a composite luminosity function for clusters within small redshift intervals, in our case at , and , to improve our estimates of and , using the method by Colless (1989): this assumes that there is relatively little variation from cluster to cluster, which is consistent with the individual luminosity functions shown in Table 2.
Figure 10 shows the composite luminosity function for all collisional clusters and the best fitting single Schechter function with the corresponding error ellipse. We have again used the model by Bruzual & Charlot (2003) to shift all the data (for distance modulus and -correction) to .
We find and for the five clusters with . For the three collisional clusters at ; the best fitting parameters are: , . The composite luminosity function for the three clusters at has best fitting parameters of: and .
4.2 The colour-magnitude relations
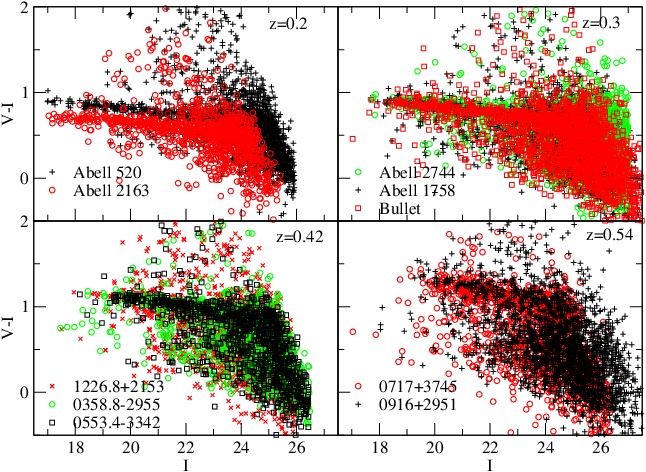
Figure 11 plots the colour-magnitude diagrams for all galaxies in the collisional clusters. We show the two clusters at , the three at and then those at and at , each in the same diagram. Figures for all individual clusters are shown in the Appendix. The best fitting slopes and intercepts to a straight line (using a robust fitting method) are given in Table 2. In order to better show the cosmic variation in colour for massive cluster galaxies we calculate the intercept at the apparent magnitudes cited in Table 2, which is chosen to be close to the point. All clusters contain well-defined red sequences, which can be fitted by a single straight line, and can be followed for nearly 7 magnitudes (and sometimes more) to the photometric limits of the data The red sequences appear to be very narrow, with a scatter dominated by photometric errors. Even collisional clusters are therefore largely composed of a population of quiescent galaxies, similar to local objects. Comparison (non-collisional) clusters (Figures in the Appendix) also show the same behaviour, with tight red sequences having colours consistent with those of the main sample of ‘bullet-like’ objects.
The red sequences essentially overlap for all clusters at the same redshift: red galaxies have the same colour irrespective of environment in all clusters, even in different stages of a collision (or no collision). In A2163 there is evidence that the extinction may be different than stated in Schlafly & Finkbeiner (2011); this is not surprising as the is close to 1 mag. and foreground extinction may be patchy. CL0025-1222 has a different band and this yields a substantially different colour, so this is not included here. With these exceptions, the colour-magnitude relations are remarkably consistent, including for non-collisional clusters. In addition, the red sequence colours at different epochs are also consistent with our adopted passive evolution model.
4.3 Red Sequence and Blue Cloud Luminosity Functions
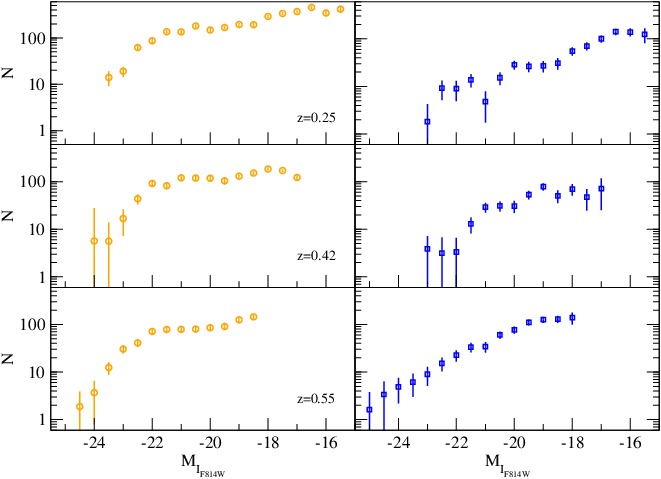
We derive composite luminosity functions for red sequence and blue cloud for collisional clusters at (A520, A1758, A2163, A2744 and the Bullet), (MACS0553.4-3342, MACS1226+2153 and MACS0358.8-2955) and (J0916+2951 and J0717+3745, CL0025-1222 has a very different band, although its data are included in the total luminosity functions in Figure 10) in Figure 12)).
We fit a single Schechter function to the red sequences, in order to better parametrise their evolution. For galaxies at =0.25, and we find, respectively, , , , and , , , where these have been corrected for distance modulus and -correction to , but not for the -correction to better show the evolution over this redshift range. The above values are consistent with the pure passive evolution of our simple model with and Gyr. By appling the appropriate shifts for distance modulus and the corrections, the red sequence luminosity functions effectively overlap. Red sequence galaxies therefore appear to evolve passively and the red sequence appears to be well established, to at least (5 magnitudes below the red galaxy ) in clusters out to at least .
However, the red sequence luminosity distributions are not very well fitted by a single Schechter function. They appear to show a dip/plateau at intermediate luminosities followed by a power-law or Schechter-like rise, as observed more clearly in some of the lower mass objects in our sample (e.g., see above for the Bullet Cluster). A double Schechter function better fits the red sequence in local clusters such as Coma and the nearby objects studied by Barkhouse et al. (2007) as well as the field LF of Loveday et al. (2012). The reduced is for , 2.0 for and for for a single Schechter function; the better fit at high redshift is due to the fact that we are losing statistical power at the faint end.
We attempt to fit a double Schechter function to the data: this yields , , and . Unfortunately, there is little statistical power to fit the faint Schechter function, even if we fix the value to as done in Barkhouse et al. (2007). Nevertheless, inspection of Figure 12 for the red sequence (left-hand panels) galaxies, shows a dip/plateau at intermediate magnitudes, as seen in other local clusters and in the compilation of Barkhouse et al. (2007), as well as in the field red sequence luminosity function by Loveday et al. (2012).
For blue cloud galaxies we observe that, in the lowest redshift bin of Figure 12 there are few bright blue galaxies brighter than the ’dip’ in the red sequence at , while the fainter blue galaxies approximately follow a power-law of slope . In the two higher redshift bins we see both a relative increase in the fraction of blue galaxies, especially at the faint end, and the presence of some bright blue galaxies which are absent in local samples. This may be explained by either a decreasing quenching efficiency in higher redshift clusters (although the environment in these collisional objects should be hostile to star-forming galaxies, as observed by Ma et al. 2010 in CL0025-1222) or it may reflect (as it does for local clusters – De Propris et al. 2003b) the luminosity function for blue galaxies in the field, where such objects are ’interlopers’ in the cluster fields and are quickly quenched upon infall.
| Cluster | Passband | Exposure | Area | Proposal | PI | |
|---|---|---|---|---|---|---|
| [s] | [arcmin2] | |||||
| MACS0547-3904 | 0.21 | 1200 | 11.87 | 12166 | Ebeling | |
| 1440 | 11.87 | |||||
| Abell 1351 | 0.32 | 1200 | 11.87 | 12166 | Ebeling | |
| 1440 | 11.87 | |||||
| MACS0417.5-1154a | 0.44 | 1788 | 10.62 | 12009 | Von der Linden | |
| 1910 | 12.23 | |||||
| MACS1621.3+3810b | 0.47 | 1200 | 11.87 | 12166 | Ebeling | |
| 1440 | 11.87 | |||||
| CL0016+16 | 0.54 | 2240 | 39.17c | 10635 | Ziegler | |
| 4560 | 11.71 | 11560 | Ebeling |
-
a
Combined and coverage is 6.79 arcmin2
-
b
Combined and coverage is 9.28 arcmin2
-
c
mosaic
4.4 Comparison with other clusters
We have studied a small sample of comparison clusters, as part of a larger dataset, to understand whether collisional clusters exhibit a different behaviour and isolate the effects of the mergers on the cluster members. Table 3 shows the same information as in Table 1 for the non-collisional objects (cluster identification, redshift, bands, exposure times, proposal ID and PI).
We treat these objects in the same way as the collisional clusters. Their luminosity functions, colour-magnitude relations and luminosity distributions for red and blue galaxies can be found in the appropriate figures in the Appendix. Table 4 shows the derived parameters for a single Schechter function fit to all galaxies. Table 4 also presents the slope and intercept of the robust fits to the colour-magnitude relations (cf. Table 2 for the collisional clusters).
| Cluster | Slope | Intercept | ||
|---|---|---|---|---|
| MACS0547-3904 | a | |||
| Abell 1351 | a | |||
| MACS0417.5-1154 | 1.552b | |||
| MACS1621.3+3810 | 1.184b | |||
| CL0016+16 | 1.318c |
-
a
Intercept at
-
b
Intercept at
-
c
Intercept at
In general, we recover the same pattern as observed for collisional clusters. A passively evolving coupled with a non-evolving (despite the large errors for each individual cluster); tight and well-defined colour-magnitude relations with similar colours to the collisional clusters, and which can be followed for several magnitudes beyond the point and are consistent with passive evolution between the observed redshifts. Luminosity distributions for red sequence and blue cloud galaxies broadly follow the same scheme: a double Schechter function for red galaxies, with a dip or plateau at intermediate magnitudes, while blue galaxies are rare brighter than this feature but become progressively more important with redshift. However, as discussed above, the precise features of the dip are difficult to establish in a general sense because of small number statistics.
This implies that what we are observing in collisional clusters can broadly be extended to the entire population of galaxies in clusters and that the effects of environment have been both weak and very similar, irrespective of the cluster properties and its dynamical history, to a redshift of at least , although of course environmental effects may have been important at earlier lookback times. It is likely that cluster galaxies have largely completed their evolution at least before the collision took place; in this fashion, even the violent cluster environment in a merger is essentially unable to affect the properties of its member galaxies (via ram stripping).
5 Discussion
We have derived deep luminosity functions for all galaxies in clusters of galaxies at , both in objects that appear to be undergoing major and complex collisions (e.g., the Bullet cluster) and for a smaller reference sample of seemingly normal objects. We used archival data from the HST (usually taken to study weak lensing and reconstruct cluster masses) to determine the colour-magnitude relation and derive the luminosity distributions for galaxies on the red sequences and blue cloud. Cluster members were identified statistically, via photometry in reference fields believed to represent the general galaxy population, chiefly the CANDELS and GOODS surveys. By using clusters in various stages of the merger process (from objects such as Abell 520 where the cluster appears to be coalescing from at least three separate groups, to the Bullet cluster where the two clusters have crossed each other, to more complex systems such as Abell 2744 where a very intricate merger between multiple components is taking place) we hope to isolate the effects of environment, and specifically to separate dark matter halos from the cluster gas.
5.1 Impact of mergers on galaxy luminosities and colours
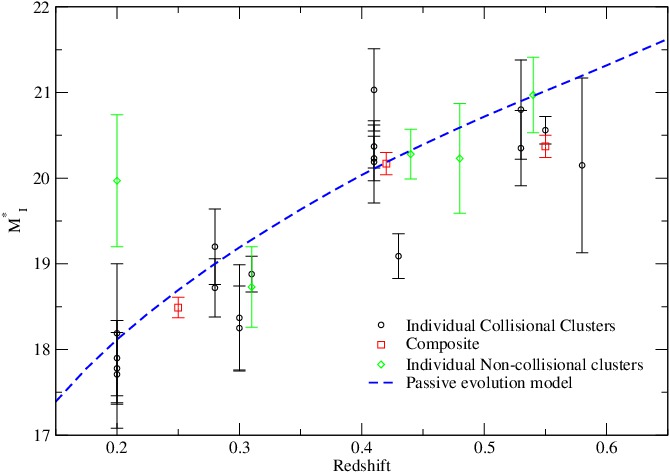
In all our clusters, irrespective of their dynamical status, whether ‘collisional’ or ‘normal’ objects, we observe that evolves in a manner consistent with the passive stellar evolution of high metallicity populations formed at high redshift in short star formation episodes, to at least . We plot the results for all clusters and the composite luminosity functions (in Figure 10) vs. redshift in Figure 13 where we also show the predicted evolution for a pure passive model normalized to at . This is consistent with our earlier work in the infrared (De Propris et al., 1999, 2007), as well as optical observations (e.g., Andreon 2008). Massive cluster galaxies therefore appear to have assembled their stellar masses before the redshift of observation; current limits to this may be as high as and possibly beyond (Mancone et al., 2010).
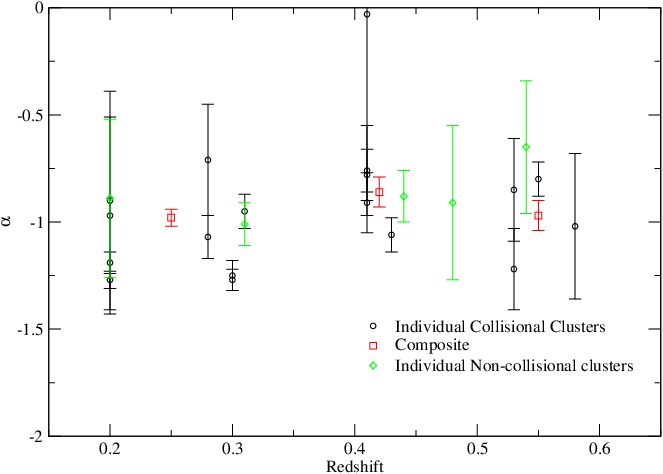
We also find that the faint end slope is in all clusters and at all redshifts, irrespective of cluster properties, as shown in Figure 14. The dwarf galaxy luminosity function therefore does not appear to evolve significantly, at least down to , out to , and at least to (4.5 magnitudes below ), out to . This is true for all collisional clusters as well as the comparison clusters. This is consistent with the findings of Andreon (2008) and the more recent work by Mancone et al. (2012), as well as our composite luminosity functions of massive clusters at =0.25 in Harsono & De Propris (2009).
5.2 Passive evolution of the red sequence
All clusters we study are also dominated by red sequence galaxies. We observe very well formed and tight colour-magnitude relations that extend to well below the point – up to 7 magnitudes in some clusters. This is similar to what is observed in local clusters such as Coma (Eisenhardt et al., 2007; Hammer et al., 2010) where the red sequence is traced to , and Abell 1185 (Andreon et al., 2006), among others. The colour-magnitude relations are very similar from cluster to cluster, irrespective of whether the cluster is involved in a collision or otherwise; this is true even for subclusters within, e.g., Abell 1758, Abell 2163, J0916+2951 or the Bullet Cluster, and even for the multiple groups (and the intragroup region) of Abell 520 where the cluster has not yet coalesced from the individual components (e.g., Figure 11).
Environmental effects on the red sequence galaxies must therefore have been relatively minor. The cluster collisions, which are observed here in different stages (from initial interactions like in Abell 520 to about 0.7 Gyr after the event in J0916+2951, including complex on-going mergers such as Abell 2744), do not appear to have affected the properties (luminosities and colours) of red sequence galaxies. In collisional clusters galaxies have been subjected to an abnormally strong ram stripping wind, at least two orders of magnitude more powerful than they would otherwise encounter in the cluster environment. The observation that the cluster collision has not affected the red galaxies can be explained only if these objects were completely quiescent (gas free) before the interaction took place and implies that the stellar populations of these galaxies were in place at least since before the two (or more) clusters merged. For J0916+2951 Dawson et al. (2012) claim that the galaxies are observed 0.7 Gyr after the crossing time. This sets the epoch of (red) dwarf galaxy formation to at least or about 7 Gyr ago.
5.3 Evolution of red cluster dwarfs
From our data we can select galaxies on the red sequence and the blue cloud (see Figures 8 and 7) and determine luminosity functions for these objects to measure their differential evolution. Composite luminosity distributions for galaxies at =0.25, 0.42 and 0.55 are plotted in Figure 12. We see no evidence that either or for red sequence galaxies evolve in any significant way, except the pure luminosity evolution implied by the ageing of stellar populations formed at high redshift. This implies that red sequence galaxies down to were already formed at least by (cf. Andreon 2008 for galaxies to in the rich cluster MS1054-03). As we observe a similar behavior for both the sample of eleven collisional clusters and the five non-interacting objects at similar redshifts, this suggests that environmental influences on red sequence galaxies have been weak and that red cluster dwarfs have been quiescent since long before the cluster mergers.
However,we also note that the red sequence luminosity function is not well fitted by a single Schechter function and is best represented by a double Schechter function, with a dip or plateau at intermediate magnitudes and a subsequent rise. This is most evident in lower mass clusters like A520 and the smaller Bullet subcluster. Similarly shaped distributions for red sequence galaxies in local clusters have been found by Barkhouse et al. (2007) among others. We therefore witness no change in the luminosity distribution of red galaxies, other than the apparent brightening due to passive evolution.
While this appears to be in contrast with the observations by Smith et al. (2012) on the age distribution of galaxies in the Coma cluster, it must be noted that these objects are brighter than the faint Coma dwarfs where Smith et al. (2012) find evidence of younger ages; additionally, the young dwarfs tend to lie in the Coma outskirts, while those in the core are uniformly old. The cluster regions we sample here tend to lie within kpc or less, and are therefore more representative of high density regions, so there is not necessarily a disagreement between our work and age determinations (based on spectroscopy) for dwarfs in Coma and elsewhere.
The evolution of the faint end of the luminosity function for dwarf galaxies has been the subject of numerous papers. De Lucia et al. (2007) have used a sample of clusters at to claim that the red sequence dwarf-to-giant ratio (measured as the ratio of galaxies between two luminosity intervals) weakens with redshift at at least. Rudnick et al. (2009) confirm this result based on a more complex re-analysis of the EDisCS data. A weakening of the faint end of red sequence in more distant clusters is also claimed by Stott et al. (2007); Lerchster et al. (2011); Lemaux et al. (2012) and by Rudnick et al. (2012). However, Crawford et al. (2009) observe no weakening of the red sequence in their sample, while Andreon (2008) also does not observe any significant evolution of the faint-end slope out to high redshift. We believe that our analysis, which benefits from the use of HST data and extensive comparison fields for statistical identification of cluster galaxies (taken under the same conditions), confirms the counter-claims by Andreon (2008) and Crawford et al. (2009) as to the (lack of) evolution of red sequence galaxies in clusters.
One obvious caveat is that we may be comparing objects of different masses and therefore in different stages of dynamical evolution. In general, the clusters studied by the EDisCS group tend to be relatively less massive objects than the richer systems analysed by Harsono & De Propris (2007, 2009) and some of our targets. If galaxy evolution depends, as one would expect, on the mass of the parent halos (e.g. Grutzbauch et al. 2012), dwarf galaxies may be particularly affected by the different environments. On the other hand, we observe no environmental dependence even when we look at clusters with different masses and evolutionary histories, and we see no strong environmental effect when we study the lower mass subclusters in some of our targets (e.g., in Abell 520, A1758, A2163, J0916+2951 and the two Bullet subclusters, that can be well distinguished – see Table 4 and Figures 13 and 14 above).
5.4 Evolution of blue cluster galaxies
We now focus on the blue galaxies. These appear to be well fitted by a power-law or single Schechter function. However, we observe significant evolution in these objects. At low redshifts, there are few, if any, luminous blue galaxies in clusters, especially brighter than the ‘dip’ in the red sequence luminosity function. The luminosity distribution fainter than may be fitted by a power law of slope . However, at higher redshifts we see both an increase in the fraction of blue galaxies, especially at the faint end, and an increasing contribution from more luminous blue galaxies. Raichoor & Andreon (2012) argue that the blue fraction (although our objects are more representative of the blue cloud population rather than the classical blue fraction) evolves according to redshift, luminosity and environment (see also De Propris et al. 2003a). Similarly, in Abell 868 Boyce et al. (2001) and Driver et al. (2003) show that late-type galaxies come to dominate the luminosity function at the faint end, with a slope of .This is consistent with a model where such galaxies are quenched to join the red sequence, probably after fading (De Propris et al., 2003b; Peng et al., 2010).
Because this does not appear to alter the red sequence luminosity function or the total luminosity function (see above) the evolution must be largely in density, with little contribution from mergers. The true masses of these objects are likely to be lower and their apparent luminosities are boosted by star formation (De Propris et al., 2003a; Holden et al., 2009). This is consistent with a ‘downsizing’ model for blue galaxies in clusters.
There are two possible ways in which this might occur. On the one hand, quenching may become more efficientin local clusters, as these become more massive. The observations by Lemaux et al. (2012) support this hypothesis, as more massive blue cloud galaxies in the CL1604 supercluster appear to be quenched earlier in the more dynamically relaxed systems. Tajiri & Kamaya (2001) present a model where blue galaxies may continue forming stars within clusters until they are ram-stripped, a phenomenon that would become more prominent as the cluster relaxes. However, here we observe similar behaviours across a variety of clusters, including objects which are by no means relaxed and are involved in major mergers and more quiescent systems.
The second possibility is that blue galaxies are a transient population, quickly quenched upon infall. Their luminosity function should therefore reflect the luminosity function of field blue galaxies. At higher redshifts we expect that more massive and luminous blue galaxies will be present in the field (because of downsizing). This would account for the growth in the blue fraction with redshift and its dependence on galaxy luminosity and distance from the cluster centres (Raichoor & Andreon, 2012). Haines et al. (2009) reach a similar conclusion where the blue population is drawn from the field but interactions boost the star formation signal at large cluster-centric radii. Li et al. (2012) study blue cloud galaxies within the Red Sequence Clusters Survey 2 with spectroscopy from extra fibers in the WiggleZ dataset and they find similar results to ours, but are also unable to resolve the discrepancy between an increasing quenching efficiency and a form of rapid quenching in clusters, where the blue population is drawn from the general field. This can also be inferred from the analysis of Ma et al. (2010) in Cl0025-1222 where the starbursts are not related to the collision but are observed primarily in infalling galaxies.
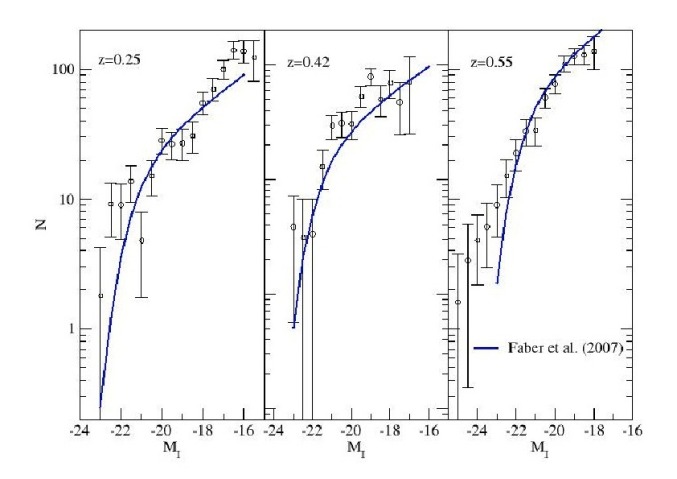
Figure 15 compares the blue cloud luminosity functions for galaxies in clusters with those derived by Faber et al. (2007), assuming and with arbitrary normalization; since Faber et al. (2007) does not quote an we hold this to the local value of . We see that the field blue luminosity function (although the definitions of blue galaxies are somewhat different) is generally consistent with the cluster blue luminosity function, with the only possible exception of an excess of bright blue cluster galaxies in the highest redshift bin, where our statistics are poorer. However, some of these objects have now been detected in the field, at similar redshifts, by the PRIMUS (Moustakas et al., 2013) and VIPERS (Davidzon et al., 2013) surveys. This is consistent with the above picture of infall and rapid quenching.
In local clusters at (e.g, De Propris et al. 2003b), the ‘star-forming’ galaxy luminosity function appears to be identical to the field one, while the field ’red sequence’ galaxy luminosity function is lacking in faint objects, which are instead present in the clusters. It is also interesting to notice that in this case, simply quenching the ‘blue’ galaxies and adding them to the ‘red’ galaxies in the field yields a good match to the luminosity function of red cluster galaxies (although these are selected spectroscopically). However, it is not clear that this mechanism can also explain the observed evolution in higher redshift clusters.
In some ways, our picture is similar to that in Gilbank et al. (2008) from analysis of clusters in the Red Sequence Cluster Survey 1, where they find an increase in the faint blue galaxy fraction, with brighter blue galaxies being present at higher redshifts, down to , with a decrease in the fraction of red sequence galaxies, and little merging, although we do not see the latter effect in our data, suggesting that the blue galaxies undergo considerable fading into the faint dwarfs regime at low redshifts. These objects may provide the ’young’ dwarfs observed by Smith et al. (2012) in the Coma cluster and elsewhere.
5.5 Implications for Galaxy Formation
Stellar luminosity and mass functions can be used to constrain the degree of merging that has taken place, via its influence on the parameters that control the shape of the luminosity function (e.g., Drory & Alvarez 2008).
In the models of De Lucia & Blaizot (2007) about half of the stellar mass is assembled since (albeit for brightest cluster galaxies). The tight colour-magnitude relations observed in clusters set strong limits to the fraction of wet (gas-rich, star-forming) mergers that may take place. Most of the merging must therefore take place between gas-poor, spheroidal-like galaxies (which dominate the cluster population).
The degree of evolution in that we observe in our cluster galaxies is consistent with pure passive evolution of their stellar populations. If we use the models by Skelton, Bell & Somerville (2012) we find that there is no room for any mass growth above the luminosity increase predicted for a model. A model where galaxies undergo at least one dry merger between and today results in galaxies 0.7 mag. too bright at . Our data constrain the mass increase of galaxies to be considerably lower and consistent with none: at least for luminous galaxies mergers appear to be unimportant in the mass assembly history of galaxies since .
Dwarf galaxies to also appear to be completely assembled at least by this redshift. As this is found in all environments we have studied, it appears that the evolution of dwarf galaxies has not been strongly affected by the cluster collisions. This is not surprising for red galaxies, where star formation has likely ceased long in the past and which therefore contain no gas for ram stripping to act on. However, we also find that the blue cloud objects are also consistent with relatively weak environmental effects, suggesting that these galaxies are ’recently’ accreted from the field (cf. Ma et al. 2010).
We use the simulations by Rudnick et al. (2012) to quantify the degree of merging that must have taken place on the red sequence at the faint end. The observation that the faint end slope, both for all galaxies and for the red sequence, appears not to have evolved to is also inconsistent with a significant contribution from mergers. Even in the 2-merger model of Rudnick et al. (2012), evolves from to , while our data is more consistent with their no-merger model.
5.6 Surface brightness selection effects and the evolution of the red sequence
At face value, our results are in contrast with the expectations of simple hierarchical models as well as with the result by the EDisCS group (De Lucia et al., 2007), as well as others, for evolution of the faint end of the red sequence in clusters. There are two possibilities for this: firstly, the dwarf to giant ratio as derived by De Lucia et al. (2007) and Stott et al. (2007) for example, is actually measured as the ratio of the number of galaxies within two luminosity ranges, for ’giants’ and ’dwarfs’. This may be affected by the ‘dip’ in the red sequence luminosity function. If this evolves faster than the passive evolution found for giants, such a choice may ‘artificially’ cause an apparent evolution in the fraction of dwarf galaxies on the red sequence as a function of redshift. Peng et al. (2010) suggest that the double Schechter function has two origins: a single, more Gaussian-like, component for massive galaxies, formed from early mergers or dissipative collapses, and a steeper Schechter function for fainter galaxies produced by the quenching of star-forming, lower-luminosity objects. If this is the case, the transitional magnitude between these two behaviours (and at which the luminosity function presents a dip or plateau) will evolve faster (relatively) than for giants which instead is well fitted by a model for passive evolution of stellar populations formed at high redshifts (see above). Therefore, if one adopts a series of luminosity cuts to measure a dwarf-to-giant ratio, as in De Lucia et al. (2007) or Bildfell et al. (2012), the differential evolution of the transition magnitude with respect to the giants results in an apparent evolution of the red dwarf galaxy fraction.
A second possibility for the discrepancy between our findings and claims for accelerated evolution on the red sequence may lie in surface brightness selection effects. We believe that this is worth discussing in some detail. We have shown from Figure 3 how surface brightness selection effects can strongly affect the detection of dwarf galaxies. It is clear that in the derivation of galaxy luminosity functions and studying their evolution, especially at the faint end and at high redshifts, such selection in surface brightness can play an important role. Galaxies can only be measured if they are detected in the first place, and this requires that their central surface brightness (presumably the most luminous portion of the galaxies) be above a threshold within a small ’detection’ aperture, which is usually chosen to be equivalent to the size of the point spread function. HST images have the advantage of a darker sky and a smaller and more stable point spread function and therefore allow us to study dwarf galaxies to faint limits even with comparatively short exposures. In addition this stability can be applied to reference fields to obtain homogeneous counts to statistically remove the background and foreground contributions to the galaxy counts in the clusters’ lines of sight.
We have analysed this issue further, via a series of archival exposures of the cluster MS1358.4+6254. Table 5 shows the available HST images (in and , there are other bandpasses as well, but these are less suitable for our purposes here) for this cluster. These include a series of exposures of length ks and ks; from these we can produce stacks of images with exposure lengths of 11ks in and and 15ks in . Note here that the first exposures (PID 9292) are offset about to the North of the others, while the other two (9717 and 10325) are at a 90∘ angle from each other but share the same centre.
| Program ID | PI | Filter | Exposure |
|---|---|---|---|
| 9292 | Ford | 2600 | |
| 2740 | |||
| 9717 | Ford | 5470 | |
| 4065 | |||
| 5470 | |||
| 10325 | Ford | 5482 | |
| 5482 |
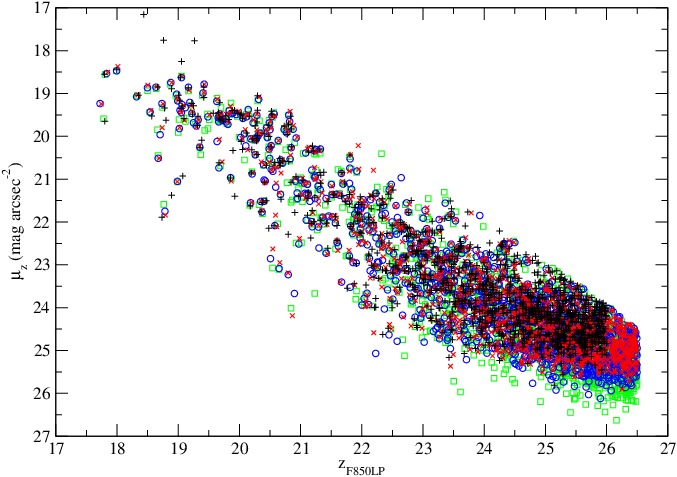
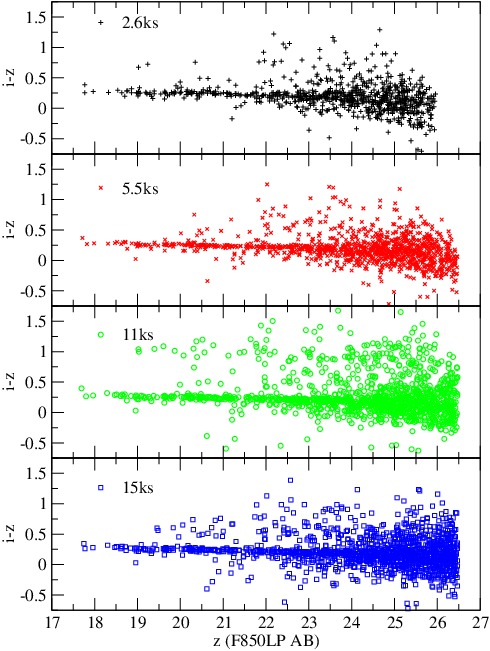
Figure 18 shows the effect of surface brightness selection in detail; we plot central surface brightness vs. total luminosity as in Figure 3, with different exposures colour-coded as in the figure caption. It is clear that in deeper exposures not only do we see fainter galaxies, but also galaxies above the luminosity thresholds but lying below the surface brightness limits.
We plot the vs. colour-magnitude diagram for galaxies in all our exposures (i.e., 2.6ks, 5.5ks and the combined 11ks and 15ks – the latter in only) in Figure 17 and fit single straight lines to the red sequence, as for all other clusters.
We have then selected galaxies on the red sequence in for a -selected sample. Figure 18 shows how the luminosity distribution for galaxies on the red sequence is affected by the exposure times (and therefore surface brightness limit reached, as in Figure 16). While the brighter portion is unaffected (all galaxies lie well above the selection limit) we see how the luminosity distributions for the fainter images start to deviate systematically from that found in the shorter (2.7ks) exposure (which is more typical of most of our data above, as well as previous work such as the EDisCS survey) at and that this also extends to points representing progressively longer exposures (for clarity we do not show error bars here but it is apparent that at the deeper images contain more galaxies). This is not due to detection limit of the images, even for the 2.6ks exposures, which reach to . Dwarf galaxies may lie at low surface brightness well within the normally computed completeness limit, but go undetected because their central surface brightness is too low, as early pointed out (in a different context) by Disney (1976) and in a similar (luminosity function-specific) fashion by Phillipps & Driver (1995) and Driver et al. (2003).
We can follow the red sequence to at least with no hint of a decrease at faint luminosities. We also note that more and more faint dwarfs emerge from the sky as the exposure length increases, suggesting that the census of dwarf galaxies in clusters may be incomplete. A fuller analysis of this and other clusters (with deep archival HST data in the Sloan filters) will be presented in a separate paper.
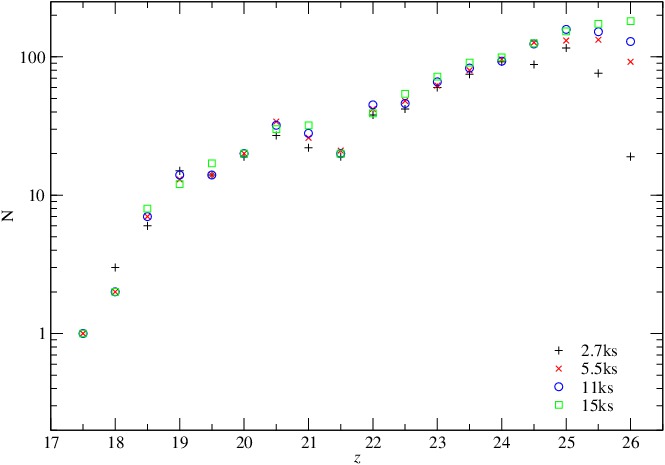
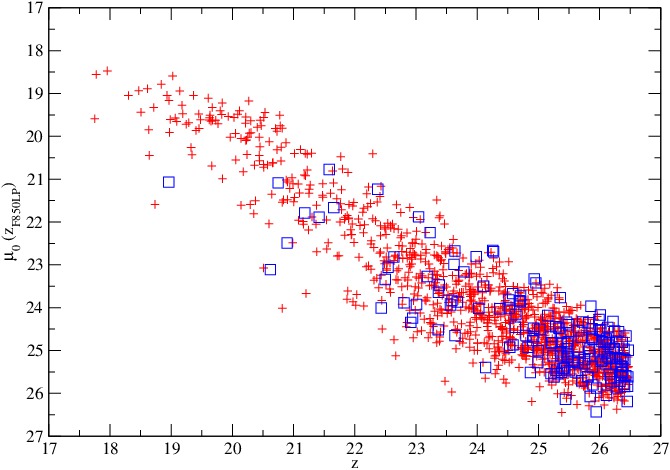
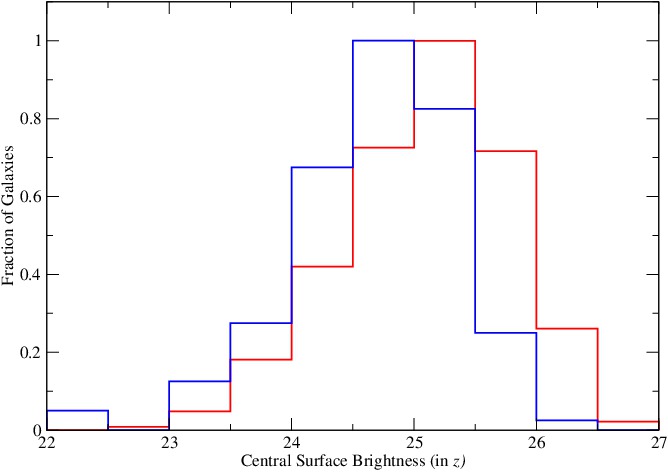
Figure 19 compares the central (detection) surface brightness distributions for galaxies on the red sequence and blue cloud. Blue cloud galaxies, because they are star-forming, have higher central surface brightnesses than red cloud dwarfs and therefore the latter galaxies will be preferentially missed because of surface brightness selection effects. This is also shown as a histogram in the figure, comparing the central surface brightness distributions for red and blue galaxies with .
This suggests that the apparent evolution of the red sequence in the EDiscCS sample (De Lucia et al., 2007; Rudnick et al., 2009) might be explained by a combination of (a) the decline in the fraction of intermediate luminosity galaxies owing to the non-monotonic shape of the luminosity distribution; (b) the possible faster evolution of this feature (relative to the true giants around if it is produced by the quenching of fainter blue galaxies as they evolve on to the red sequence (Peng et al., 2010) and (c) a combination of surface brightness selection effects and dimming, coupled with the less stable PSF and sky level of ground-based observations, as noted by Andreon (2008) and Crawford et al. (2009). In addition, the greater detectability of blue cloud dwarfs naturally explains their much weaker evolution. It is interesting to note how the apparent decline in the red sequence in Figure 18 parallels the ’merger’ induced evolution in (e.g.,) Rudnick et al. (2012, their Figure 6) as well as the redshift evolution of the red sequence: for instance, the shortest exposure (2.7ks) may be taken to be the equivalent of the more complete and longest exposure (15ks) at .
6 Conclusions
In this work we have sought to characterize the luminosity functions and colour-magnitude diagrams of collisional galaxy clusters at redshifts , and to compare these to the LFs of normal, non-colliding, clusters. We come to the following conclusions.
-
•
Regardless of how far advanced is the merger or collision, there appears to be no difference between collisional and normal clusters in terms of their overall or red/blue separated luminosity functions. There is a similar lack of difference between the characteristics of their red sequences.
-
•
All overall cluster luminosity functions are consistent with passive evolution of the galaxy population and have a fixed faint end slope
-
•
We infer from this that the collisions have not significantly affected the properties of the cluster galaxy populations, even down to the low luminosity and low mass regime of dwarf galaxies.
-
•
Contrary to some previous work there is no evidence of weakening of the red sequence (at the faint end) in the higher redshift members of our sample. We tentatively attribute this difference to increasing surface brightness driven incompleteness at faint magnitudes in previous studies, as this preferentially removes faint red objects. However, we cannot rule out the possibility that the weakening is dependent on cluster mass, with our clusters typically having higher masses than those in previous studies. We note, though, that we see no difference in the red sequence even in the lower mass subclusters which make up our merging systems.
-
•
Because the red sequences can be tracked down to faint luminosities and low masses () this implies that red dwarf galaxies were already formed prior to the epoch of observation and prior to any merger events (in the merging clusters) i.e. at (7 Gyrs ago).
-
•
There is a distinct increase in the fraction of blue cluster galaxies at higher redshifts (), at all luminosities. This is more general than the classical Butcher-Oemler effect as this increase affects all galaxies in the blue cloud, not just the bluest objects. Bright () blue galaxies are much more common in high redshift clusters than in low redshift systems. Whether this reflects evolution in the luminosity function of the infalling field galaxies or an increase in the quenching efficiency with decreasing redshift is unclear.
Acknowledgements
This work has made use of the Hubble Legacy Archive (HLA) and the Mikulski Archive for the Space Telescope (MAST). The PIs of the original projects which produced these data are thanked for providing excellent deep archival images with diverse uses beyond the original programmes. We would like to thank the anonymous referee for a constructive series of reports.
References
- Andreon (2006) Andreon S. 2006, MNRAS, 369, 969
- Andreon et al. (2006) Andreon S., Cuillandre J.-C., Puddu E., Mellier Y. 2006, MNRAS, 372, 60
- Andreon (2008) Andreon S. 2008, MNRAS, 386, 1045
- Armstrong & Kung (1978) Armstrong R. D., Kung M. T. 1978, Journal of the Royal Statistical Society series C (Applied Statistics), 27, 363
- Barkhouse et al. (2007) Barkhouse W. A., Yee H. K. C., Lopez-Cruz O. 2007, ApJ, 671, 1471
- Bell et al. (2004) Bell E. F. et al. 2004, ApJ, 608, 752
- Bertin & Arnouts (1996) Bertin E., Arnouts S. 1996, A&AS, 117, 393
- Bildfell et al. (2012) Bildfell C. et al. 2012, MNRAS, 425, 204
- Bourdin et al. (2011) Bourdin H. et al. 2011, A&A, 527, A21
- Boyce et al. (2001) Boyce P. J., Phillipps S., Jones B., Driver S. P., Smith R. M., Couch W. J. 2001, MNRAS, 328, 277
- Bradac et al. (2008) Bradac M., Allen S. W., Treu T., Ebeling H., Massey R., Morris R. G., von der Linden A., Applegate D. 2008, ApJ, 687, 959
- Bruzual & Charlot (2003) Bruzual G., Charlot S. 2003, MNRAS, 344, 1000
- Butcher & Oemler (1978) Butcher H., Oemler A. 1978, ApJ, 226, 559
- Butcher & Oemler (1984) Butcher H., Oemler A. 1984, ApJ, 285, 426
- Clowe et al. (2006) Clowe D., Bradac M., Gonzalez A. H., Markevitch M., Randall S. W., Jones C., Zaritsky D. 2006, ApJ, 648, L109
- Clowe et al. (2012) Clowe D., Markevitch M., Bradac M., Gonzalez A. H., Chung S. M., Massey R., Zaritsky D. 2012, ApJ, 758, A128
- Colless (1989) Colless M. M. 1989, MNRAS, 237, 799
- Cowie et al. (1996) Cowie L. L., Songaila A., Hu E. M., Cohen J. G. 1996, AJ, 112, 839
- Crawford et al. (2006) Crawford S. M., Bershady S., Glenn A. D., Hoessel J. G. 2006, ApJ, 636, L13
- Crawford et al. (2009) Crawford S. M., Bershady S., Hoessel J. G. 2009, ApJ, 690, 1158
- Davidzon et al. (2013) Davidzon I. et al. 2013, astro-ph, 1303.3808
- Dawson et al. (2012) Dawson W. A. et al. 2012, ApJ, 747, L42
- de Filippis et al. (2011) de Filippis E., Paolillo M., Longo G., La Barbera F., de Carvalho R. R., Gal, R. 2011, MNRAS, 414, 2771
- De Lucia et al. (2007) De Lucia G. et al. 2007, MNRAS, 374, 809
- De Lucia & Blaizot (2007) De Lucia G., Blaizot J. 2007, MNRAS, 375, 2
- De Propris et al. (1999) De Propris R., Stanford S. A., Eisenhardt P. R., Dickinson M., Elston R. 1999, AJ, 118, 719
- De Propris et al. (2003a) De Propris R., Stanford S. A., Eisenhardt P. R., Dickinson M. 2003a, ApJ, 598, 20
- De Propris et al. (2003b) De Propris R. et al. 2003b, MNRAS, 342, 725
- De Propris et al. (2004) De Propris R. et al. 2004, MNRAS, 351, 125
- De Propris et al. (2007) De Propris R., Stanford S. A., Eisenhardt P. R., Dickinson M., Rosati P. 2007, AJ, 133, 2209
- Disney (1976) Disney M. 1976, Nature, 263, 573
- Driver et al. (2003) Driver S. P., Odewahn S. C., Echevarria L., Cohen S. H., Windhorst R. A., Phillipps S., Couch, W. J. 2003, AJ, 126, 2662
- Drory & Alvarez (2008) Drory N., Alvarez M. 2008, ApJ, 680, 41
- Ebeling et al. (2010) Ebeling H., Edge A. C., Mantz A., Barrett E., Henry J. P., Ma C. J., van Speybroeck L. 2010, MNRAS, 407, 83
- Eisenhardt et al. (2007) Eisenhardt P. R., De Propris R., Gonzalez A. H., Stanford S. A., Wang M., Dickinson M. 2007, ApJS, 169, 225
- Faber et al. (2007) Faber S. M. et al. 2007, ApJ, 665, 265
- Giavalisco et al. (2004) Giavalisco M. et al. 2004, ApJ, 600, L93
- Gilbank et al. (2008) Gilbank D. G., Yee H. K. C., Ellingson E., Gladders M. D., Loh Y.-S., Barrientos L. F., Barkhouse W. A. 2008, ApJ, 673, 724
- Girardi et al. (2008) Girardi M., Barrena R., Boschin W., Ellingson E. 2008, A&A, 491, 379
- Grogin et al. (2011) Grogin N. et al. 2011, ApJS, 197, A35
- Grutzbauch et al. (2012) Grützbauch R., Bauer A.E., Jorgensen I., Varela J., 2012, MNRAS, 423, 3652
- Haines et al. (2009) Haines C. P. et al. 2009, ApJ, 704, 126
- Hammer et al. (2010) Hammer D. et al. 2010, ApJS, 191, 143
- Harsono & De Propris (2007) Harsono D., De Propris R. 2007, MNRAS, 386, 1036
- Harsono & De Propris (2009) Harsono D., De Propris R. 2009, AJ, 137, 3091
- Hinshaw et al. (2012) Hinshaw G. et al. 2012, arXiv 1212.5226
- Holden et al. (2009) Holden B. P. et al. 2009, ApJ, 670, 190
- Holden et al. (2010) Holden B. P., van der Wel A., Kelson D. D., Franx M., Illingworth G. D. 2010, ApJ, 721, 714
- Huang et al. (1997) Huang J.-S., Cowie L. L., Gardner J. P., Hu E. M., Songaila A., Wainscoat R. J. 1997, ApJ, 476, 12
- Hsu et al. (2012) Hsu L.-Y., Ebeling H., Richard J. 2012, MNRAS, in press
- Koekemoer et al. (2011) Koekemoer A. et al. 2011, ApJS 197, A36
- Lemaux et al. (2012) Lemaux B. C. et al. 2012, ApJ, 745, A106
- Lerchster et al. (2011) Lerchster M. et al. 2011, MNRAS, 411, 2667
- Lewis et al. (2002) Lewis I. J. et al. 2002, MNRAS, 334, 673
- Li et al. (2012) Li I. H. et al. 2012, ApJ, 747, A91
- Limousin et al. (2012) Limousin M. et al. 2012, A&A, 544, A71
- Loveday et al. (2012) Loveday J. et al. 2012, MNRAS, 420, 1239
- Lu et al. (2009) Lu T., Gilbank D. G., Balogh M. L., Bognat A. 2009, MNRAS, 399, 1858
- Ma et al. (2009) Ma C.-J., Ebeling H., Barrett E. 2009, ApJ, 639, L56
- Ma et al. (2010) Ma C.-J., Ebeling H., Marshall P., Shabbrack T. 2010, MNRAS, 406, 121
- Mancone et al. (2010) Mancone C. L. et al. 2010, ApJ, 720, 284
- Mancone et al. (2012) Mancone C. L. et al. 2012, ApJ, 761, A141
- Markevitch et al. (2002) Markevitch M. et al. 2002, ApJ, 567, L27
- Markevitch et al. (2004) Markevitch M. et al. 2004, ApJ, 606, 819
- Merten et al. (2011) Merten J. et al. 2011, MNRAS, 417, 333
- Moustakas et al. (2013) Moustakas J. et al. 2013, ApJ, 767, A50
- Muzzin et al. (2008) Muzzin A., Wilson G., Lacy M., Yee H. K. C., Stanford, S. A. 2008, ApJ, 686, 966
- Owers et al. (2011) Owers M. S., Randall S. M., Nulsen P. E. J., Couch W., David L. P., Kempner J. C. 2011, ApJ, 728, A27
- Papovich et al. (2010) Papovich C. et al. 2010, ApJ, 716, 1503
- Peebles (1975) Peebles P. J. E. 1975, ApJ, 196, 647
- Peng et al. (2010) Peng, Y.-J. et al. 2010, ApJ, 721, 193
- Perez-Gonzalez et al. (2008) Perez-Gonzalez P. G. et al. 2008, ApJ, 675, 234
- Phillipps & Driver (1995) Phillipps S., Driver S. P. 1995, MNRAS, 274, 832
- Pimbblet & Jensen (2012) Pimbblet K. A., Jensen P. C. 2012, arXiv, 1208.0667
- Popesso et al. (2006) Popesso P., Biviano A., Böhringer H., Romaniello M. 2006, A&A, 445, 29
- Pracy et al. (2004) Pracy M. B., De Propris R., Driver S. P., Couch W. J., Nulsen P. E. J. 2004, MNRAS, 352, 1135
- Quilis et al. (2000) Quilis V., Moore B., Bower R. 2000, Science, 288, 1617
- Ragozzine et al. (2012) Ragozzine B., Clowe D., Markevitch M., Gonzalez A. H., Bradac, M. 2012, ApJ, 744, A94
- Raichoor & Andreon (2012) Raichoor A., Andreon S. 2012, A&A, 543, A19
- Rudnick et al. (2009) Rudnick G. et al. 2009, ApJ, 700, 1559
- Rudnick et al. (2012) Rudnick G., Tranh K.-V., Papovich C., Momcheva I., Willmer C. 2012, ApJ, 755, A14
- Schechter (1976) Schechter P. L. 1976, ApJ, 203, 297
- Schlafly & Finkbeiner (2011) Schlafly E., Finkbeiner D. P. 2011, ApJ, 737, A103
- Skelton et al. (2012) Skelton R. E., Bell E. F., Somerville R. S. 2012, ApJ, 753, A44
- Smith et al. (2009) Smith R. J. et al. 2009, MNRAS, 392, 1265
- Smith et al. (2012) Smith R. J., Lucey J. R., Price J., Hudson M. J., Phillipps S. 2012, MNRAS, 419, 3167
- Soucail (2012) Soucail G. 2012, A&A, 540, A61
- Stott et al. (2007) Stott J. P., Smail I., Edge A. C., Ebeling H., Smith G. P., Kneib J-P., Pimbblet K. A. 2007, ApJ, 661, 95
- Tajiri & Kamaya (2001) Tajiri Y. Y., Kamaya H. 2001, ApJ, 562, L125
- Tucker et al. (1998) Tucker W. et al. 1996, ApJ, 496, L5
- Weisz et al. (2011) Weisz, D. R. et al. 2011, ApJ, 739, A5
- Yamanoi et al. (2012) Yamanoi H. et al. 2012, AJ, 144, A40
- Zeimann et al. (2012) Zeimann G. R. et al. 2012, ApJ, 756, A115