The CoRoT star ID 100866999: a hybrid Doradus- Scuti star in an eclipsing binary system. ††thanks: The CoRoT space mission was developed and is operated by the French space agency CNES, with participation of ESA’s RSSD and Science Programmes, Austria, Belgium, Brazil, Germany, and Spain.
Abstract
Context. The presence of - and -modes allows testing stellar models from the core to the envelope. Moreover, binarity in an eclipsing system constrains the physical parameters of the pulsating star.
Aims. CoRot ID 100866999 is a relatively large-amplitude hybrid Doradus- Scuti star with two clearly distinct frequency domains. The large number of detected frequencies allows a detailed study of the interaction between them. In addition, we can derive the fundamental parameters of both components from the study of the eclipsing light curve.
Methods. After removing the eclipsing phases, we analyzed the data with the Period04 package up to a signal-to-noise ratio S/N=4. The light curve was then prewhitened with these oscillation frequencies to derive the fundamental parameters of the two components.
Results. The eclipsing light curve analysis results in a (1.8+1.1) M⊙ system, both components being
main sequence stars.
We detect 124 frequencies related to luminosity variations of the primary.
They are present in two well-separated domains: 89 frequencies in the interval
[0.30;3.64] d-1 and 35 in the interval [14.57; 33.96] d-1.
There are 22 Doradus frequencies separated by a constant period interval d.
These frequencies correspond to a series of g-modes of degree with successive
radial orders .
We identify 21 linear combinations between the first nine Doradus frequencies.
The Scuti domain is dominated by a large-amplitude frequency d-1.
The eight first Doradus frequencies are present with much lower amplitude in the Scuti domain as
.
These interactions between - and -modes confirm the phenomenon we detected in another CoRoT star.
The amplitude and the phase of the main frequency shows a double-wave modulation along the orbital
phase, giving rise to series of combination frequencies.
Such combination frequencies are also detected, with lower amplitude, for the first Doradus modes.
Key Words.:
stars: variables: Doradus – stars: variables: Scuti – asteroseismoloy – Stars: binaries: eclipsing – stars: oscillations – techniques: photometric1 Introduction
The launch of several dedicated satellites (MOST (Walker et al., 2003), CoRoT (Baglin et al., 2006), Kepler (Borucki et al., 1997; Christensen-Dalsgaard et al., 2008)), which allow the detection of several hundreds of accurate frequencies, opened a new era in asteroseismic studies. Concerning the classical instability strip, preliminary results show, for instance that the regions of Scuti and Doradus stars largely overlap (Uytterhoeven et al., 2011), with the presence of low frequencies in a large fraction of A-F stars (Balona et al., 2011). However, from a theoretical point of view, models fail to reproduce clearly such hybrid stars, because the two identified mechanisms (-mechanism for high frequencies, convective blocking mechanism for low frequencies) work together on only a small fraction of the observed instability strip.
In a preceding paper (Chapellier et al. (2012), hereafter Paper I), we detected strong coupling between - and -modes in a hybrid Doradus- Scuti star: CoRoT ID 105733033 (hereafter 033). Each -mode frequency gives rise to two smaller amplitude frequencies and around the main -mode frequency . Such a phenomenon has been predicted for the Sun (Kennedy et al., 1993) and interpreted as a coupling between the - and -modes cavities. If valid, this physical interpretation should act in other hybrid Doradus- Scuti stars. We thus chose a candidate with similar pulsation characteristics, a hybrid with a dominant Scuti mode and several Doradus modes. To obtain a precise value of the rotation period, we selected an eclipsing binary star, CoRoT ID 100866999 (hereafter 999). The data are described in Sect. 2, and the eclipsing binary system is studied in Sect. 3. The frequency analysis is presented in Sect. 4, and results are studied in Sect. 5 and 6 for the low- and high-frequency regions, respectively. Section 7 deals with the relationship between the different pulsation frequencies and the orbital one. Finally, conclusions are discussed in Sect. 8.
2 The CoRoT data
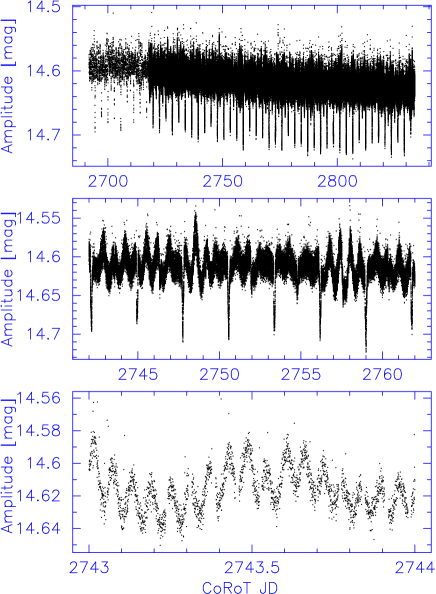
The observations of 999 were collected during CoRoT’s first long run, LRc01, which targeted the Galactic center. We worked on the reduced N2 light curves (Auvergne et al., 2009) throughout this paper. The observations lasted 142 days, from May 16th to October 5th, 2007. Among the 317045 measurements obtained, we retained only the data flagged “0” by the CoRoT pipeline because the other measurements were affected by instrumental effects such as straylight, cosmic rays, and perturbation by Earth eclipses. In the following, the measured flux was converted into magnitude using the CoRoT magnitude . This value actually corresponds to the -magnitude provided by the EXODAT database (Deleuil et al., 2009). The resulting light curve, on different timescales, is represented in Fig. 1. The light curve is recorded in ”white” light, i.e., no color information is available. The measurements were obtained at different sampling (512 s during the first 26 days and then 32 s during the other 116 days). For the coherence of the data, all the measurements were binned to a common sampling of 512 s. In Fig. 1, the presence of low and high frequencies is obvious. In the following, the timescale is labeled in CoRoT Julian Day, where the starting CoRoT JD corresponds to HJD 2451545.0 (January 1st, 2000 at UT 12:00:00).
CoRoT data are known to be affected by several technical issues, such as long-term trends and jumps due to cosmic rays (Auvergne et al., 2009). In addition, many individual measurements can be considered as outliers. The most significant of them were removed by an iterative procedure during the Fourier analysis. To correct the trends and the jumps, we use a new and original procedure. We first performed a Fourier analysis of the binned data up to 200 frequencies and then prewhitened the data with all the frequencies higher than 0.25 d-1. We applied a spline function in the residuals and then prewhitened the original data set with the same spline function. This procedure gave a satisfying straightening of the data.
The EXODAT database (Deleuil et al., 2009) provides two possible spectral types: K5 V or A5 IV and a color temperature (4900 K) that is compatible with none of these spectral identifications. The magnitudes from the 2MASS survey (, , ) are more compatible with an A5 IV spectrum. From a survey of CoRoT stars candidates using low-resolution spectroscopy, Sarro et al. (2013) obtained an effective temperature of the order of K, which is not compatible with the K5 type. Because the presence of a companion perturbs spectral type identification, we must consider that we have no precise parameters for this star. However we can exclude a K5 V spectrum that puts the star outside of the well-determined Scuti instability strip.
The CoRoT contamination factor is very small (4.0 %), so we consider the signal as coming from the eclipsing binary system of 999 alone.
3 The eclipsing binary system
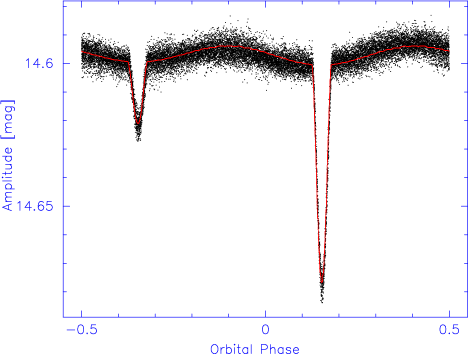
An exploration of the LRc01 field for transit detection by Cabrera et al. (2009) showed that the star is an eclipsing binary (E2-1719) with an orbital period of d and an epoch of HJD. The eclipse lasts 3.9 h with a depth of 6.7 %. Two eclipses are visible, separated by half the orbital period, implying a null eccentricity. The duration of each eclipse is equal to 5.3 % of the orbital period.
To determine the parameters of both components, we used the PHOEBE software (Prša & Zwitter, 2005). From the Fourier analysis, we fixed both the orbital period and the null eccentricity. The light curve was first filtered from all the frequencies that cannot be attributed to the binary motion, in particular, the pulsation frequencies, but also the satellite ones. We note that the CoRoT data in white light are the only data at our disposal, so our physical determinations are relatively imprecise due to the lack of color light curves and radial velocities.
Several attempts led to the determination of the orbital parameters listed in Table 1.
| Parameter | System | |
|---|---|---|
| Period [d] | ||
| Inclination [∘] | ||
| a [] | ||
| q [M2/M1] | ||
| Primary | Secondary | |
| Mass | ||
| Radius | ||
| Log g | ||
| Teff | ||
| Mbol | ||
The related fit is represented in Fig. 2.
From these results, it appears that the primary star is compatible with an A7-F0 spectral type, while the secondary star is compatible with a G5-KO spectral type, both being on the main sequence. Therefore, the primary star is within the “classical” instability strip, while the secondary one is not.
To be sure that the pulsation really originates from the primary star, we analyzed separately the data obtained only during the secondary eclipse (when the companion is hidden by the primary). The detection of the first Scuti and Doradus frequencies in the Fourier analysis i.e., those having the largest amplitudes, ensures that the primary is the pulsating star.
4 Frequency analysis
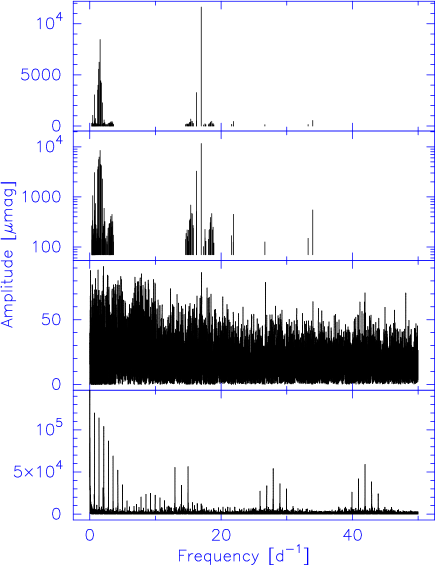
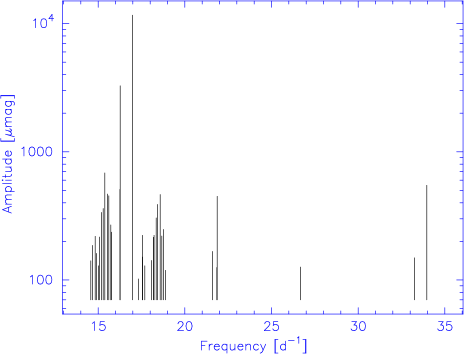
The data were analyzed with the package Period04 (Lenz & Breger, 2005). To detect only the pulsation frequencies, we removed the data obtained during both eclipses. After re-sampling and elimination of the outliers, we ended with 19207 measurements. The frequencies were searched in the interval d-1 i.e., up to the Nyquist limit. For each detected frequency, the amplitude and the phase were calculated by a least-squares sine fit. The data were then prewhitened and a new analysis was performed on the residuals. The Fourier analysis was stopped after 200 frequencies, when we reached the usual S/N=4 limit, even in the less noisy spectral regions. We note that we did not use the option improve all available in the Period04 package, which computes a multi-sine fit. Indeed, we noted that when the number of frequencies increases, the narrowest couple of frequencies tend to converge to an unique one. To compensate for the loss of precision when this option is not considered, we used a very high step rate in the Fourier analysis (0.0001 d-1). The uncertainties in the frequencies, amplitudes, and phases were computed with the formulae proposed by Montgomery & O’Donoghue (1999). The final noise varies from 0.031 mmag in the Doradus region to 0.024 mmag in the Scuti region. We eliminated 47 frequencies having an S/N value lower than four. We also excluded the frequencies lower than 0.25 d-1. When two frequencies were closer than d-1, we systematically discarded the lowest amplitude frequency. After this elimination process, 124 frequencies were retained: 89 in the interval d-1 and 35 in the interval d-1 (Table 2, Fig. 3).
| Frequency | A | S/N | Ident. | |||||
|---|---|---|---|---|---|---|---|---|
| d-1 | d-1 | mmag | rad | rad | ||||
| 16.98030 | 0.00001 | 11.623 | 3.462 | 0.001 | 515.5 | |||
| 1.59540 | 0.00001 | 8.455 | 3.914 | 0.002 | 301.4 | 0 | ||
| 1.43420 | 0.00001 | 6.237 | 0.151 | 0.003 | 225.0 | 2 | ||
| 1.36600 | 0.00001 | 5.551 | 1.307 | 0.003 | 201.3 | 3 | ||
| 1.69030 | 0.00001 | 4.417 | 5.529 | 0.004 | 156.3 | -1 | ||
| 1.79740 | 0.00002 | 4.206 | 3.129 | 0.004 | 147.6 | -2 | ||
| 1.24880 | 0.00002 | 3.993 | 2.073 | 0.004 | 146.0 | 5 | ||
| 1.19840 | 0.00002 | 3.517 | 5.385 | 0.005 | 129.0 | 6 | ||
| 16.26820 | 0.00002 | 3.271 | 5.246 | 0.005 | 146.5 | |||
| 0.71190 | 0.00002 | 3.051 | 0.930 | 0.005 | 114.8 | |||
| 1.91650 | 0.00003 | 2.278 | 0.038 | 0.007 | 79.2 | -3 | ||
| 0.45150 | 0.00006 | 1.054 | 4.279 | 0.016 | 39.9 | |||
| 0.89730 | 0.00009 | 0.738 | 3.380 | 0.023 | 27.5 | 14 | ||
| 15.38510 | 0.00009 | 0.684 | 0.383 | 0.024 | 31.6 | |||
| 2.20150 | 0.00011 | 0.591 | 2.249 | 0.028 | 20.1 | -5 | ||
| 33.96040 | 0.00012 | 0.547 | 0.214 | 0.030 | 29.0 | |||
| 0.72790 | 0.00012 | 0.535 | 5.510 | 0.031 | 20.1 | |||
| 16.25300 | 0.00013 | 0.508 | 0.440 | 0.033 | 22.8 | |||
| 15.54600 | 0.00014 | 0.468 | 3.072 | 0.036 | 21.5 | |||
| 18.57580 | 0.00014 | 0.464 | 0.641 | 0.036 | 22.5 | |||
| 15.61460 | 0.00014 | 0.453 | 1.225 | 0.037 | 20.8 | |||
| 21.87110 | 0.00014 | 0.449 | 4.486 | 0.037 | 23.3 | |||
| 3.39280 | 0.00014 | 0.446 | 2.639 | 0.037 | 14.7 | |||
| 0.75010 | 0.00016 | 0.415 | 0.949 | 0.040 | 15.6 | |||
| 3.23170 | 0.00016 | 0.409 | 3.556 | 0.041 | 13.4 | |||
Removing the data obtained during the eclipses leads to the large pike aliases shown in Fig. 3. To detect eventual alias effects on the Fourier analysis, we undertook a second analysis on the entire data set after prewhitening it from the binary model. We performed the same Fourier analysis up to 200 frequencies. In this analysis, only the aliases related to the satellite frequency remained, but the noise increased by 10 to 30 % in the Doradus region. No significant differences are observed between the frequencies detected with the two methods. In particular, none of the 124 frequencies seems to be affected by aliasing effects. As the first method gave the best S/N, we only consider these results.
The Doradus and the Scuti domains are well separated; no frequencies are detected in the interval d-1.
5 The Doradus domain
From the Fourier analysis, we detected 89 frequencies in the interval d-1 (Table 2, Fig. 4).
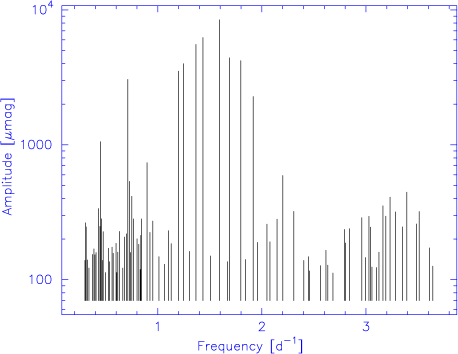
The main frequency is d-1, with an amplitude mmag. Data phased with this frequency are represented in Fig. 5.
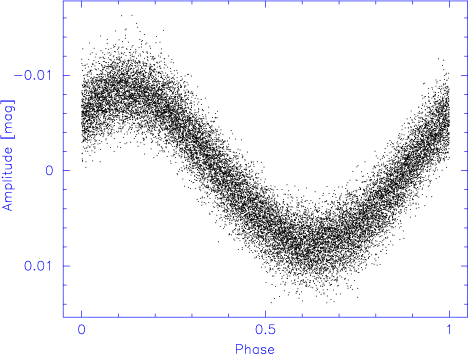
The shape of the curve is nearly sinusoidal, hence only is detected with an amplitude mmag. The light variations associated with the ellipsoidal deformation of the main star are detected as d-1 with an amplitude mmag. We identified 21 linear combinations between the first nine Doradus frequencies (Table 3).
| Frequency | Combination | |
|---|---|---|
| 6 | ||
| 9 | ||
| 15 | ||
| 0 | ||
| 0 | ||
| 16 | ||
| 6 | ||
| 21 | ||
| 18 | ||
| 9 | ||
| 1 | ||
| 6 | ||
| 7 | ||
| 7 | ||
| 8 | ||
| 1 | ||
| 6 | ||
| 7 | ||
| 1 | ||
| 2 | ||
| 7 |
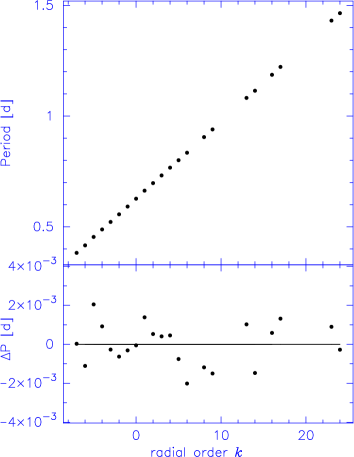
We searched for equidistant Doradus periods: a series of 22 asymptotic periods is found, with a mean separation d (Table 4, Fig. 6).
| Frequency | Period | Amplitude | |
|---|---|---|---|
| ∗*∗*These asymptotic frequencies are blended with combination frequencies. | 0.3824 | 0.16 | -7 |
| ∗*∗*These asymptotic frequencies are blended with combination frequencies. | 0.4161 | 0.14 | -6 |
| 0.4542 | 0.59 | -5 | |
| ∗*∗*These asymptotic frequencies are blended with combination frequencies. | 0.4880 | 0.26 | -4 |
| 0.5218 | 2.28 | -3 | |
| 0.5564 | 4.21 | -2 | |
| 0.5916 | 4.42 | -1 | |
| 0.6268 | 8.45 | 0 | |
| 0.6632 | 0.15 | 1 | |
| 0.6973 | 6.24 | 2 | |
| 0.7321 | 5.55 | 3 | |
| 0.7670 | 0.16 | 4 | |
| 0.8008 | 3.99 | 5 | |
| 0.8344 | 3.52 | 6 | |
| 0.9051 | 0.23 | 8 | |
| 0.9398 | 0.13 | 9 | |
| 1.0820 | 0.22 | 13 | |
| 1.1145 | 0.74 | 14 | |
| ∗*∗*These asymptotic frequencies are blended with combination frequencies. | 1.1864 | 0.28 | 16 |
| 1.2220 | 0.18 | 17 | |
| 1.4312 | 0.22 | 23 | |
| 1.4650 | 0.21 | 24 |
In particular, the eight main Doradus periods belong to these asymptotic series. The asymptotic periods extend from 0.382 to 1.465 d, with a concentration of high-amplitude periods between 0.525 and 0.834 d. These periods correspond to -modes of the same radial degree with consecutive radial orders . The measured separation is compatible with an -modes (Bouabid et al., 2011). Four of these periods can be identified both as asymptotic and a combination between Doradus modes. Longer observations would be necessary to separate the pikes that are blended in our frequency analysis.
Apart from the frequencies corresponding to linear combinations and those coupled with the orbital frequency (see Sect. 6), 63 independent Doradus frequencies remain. These frequencies were sorted in terms of decreasing amplitudes and re-numbered starting from .
6 The Scuti domain
We retained 35 frequencies in the interval d-1 (Table 2, Fig. 7).
One frequency clearly dominates the spectrum, d-1, with an amplitude mmag. Figure 8 represents a light curve phased with this frequency.
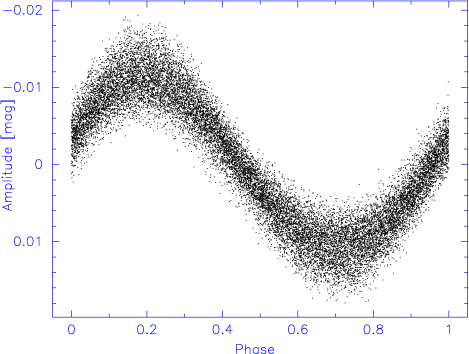
The variation is quite sinusoidal, and only one low-amplitude harmonic ( d-1, mmag) is found.
The strong interactions between - and -modes revealed in 033 (Paper I) are also present in 999. Indeed, the first eight Doradus frequencies are present in the Scuti domain as (Table 5).
| Frequency | Coupling | Ratio | |
|---|---|---|---|
| 2 | 12.4 | ||
| 1 | 18.2 | ||
| 1 | 13.3 | ||
| 2 | 16.1 | ||
| 3 | 12.2 | ||
| 2 | 18.2 | ||
| 5 | 12.2 | ||
| 1 | 20.1 | ||
| 3 | 12.5 | ||
| 3 | 17.0 | ||
| 1 | 14.9 | ||
| 1 | 17.9 | ||
| 2 | 14.9 | ||
| 10 | 16.3 | ||
| 14 | 10.5 | ||
| 2 | 19.1 |
The mean amplitude ratio is equal to with a lower value for the ratio () than for the one (). For 033 the ratio was equal to 4.1; in this latter star we also detected interaction with the and harmonics with ratios of 15 and 53, respectively.
Getting rid of the coupled frequencies, only eight really independent Scuti frequencies remain in the range d-1 (Table 6).
| Frequency | Amplitude | ||
|---|---|---|---|
| [d-1] | [mmag] | ||
| 16.9803 | 11.623 | ||
| 16.2530 | 0.508 | ||
| 21.8711 | 0.449 | ||
| 17.5521 | 0.223 | ||
| 21.6053 | 0.167 | ||
| 17.5674 | 0.151 | ||
| 26.6690 | 0.126 | ||
| 21.8441 | 0.125 | ||
The amplitude of the main frequency d-1 is almost 20 times larger than the amplitude of the other Scuti frequencies. The period ratio is equal to the well-known period ratios of the fundamental mode to the first overtone (Fitch (1981), Poretti et al. (2005)). If is really the radial fundamental mode, the period-luminosity relation of Templeton et al. (2002), the period associated with (0.05889 d) corresponds to an absolute magnitude mag and an A8 V spectral type for the pulsating star. These values are consistent with those derived from the orbital parameters (Sect. 3). However, spectroscopic and multicolor observations are essential to confirm or invalidate the mode identification of and .
7 Binarity-Pulsation relationship
Beside the different couplings detected between the pulsation frequencies, several couplings are detected with the orbital frequency d-1. These concern Scuti as well as Doradus frequencies. The same couplings are detected in the period analysis using the entire data set prewhitened from the binary model. Therefore it cannot be an effect of aliasing due to the data gaps. The detected couplings are listed in Table 7.
| Frequency | Combination | Ratio | |
|---|---|---|---|
| 6 | 26.4 | ||
| 2 | 22.2 | ||
| 9 | 29.1 | ||
| 8 | 12.1 | ||
| 9 | 22.3 | ||
| 2 | 3.6 | ||
| 12 | 90.0 | ||
| 8 | 3.7 | ||
| 4 | 3.7 | ||
| 6 | 2.1 | ||
| 7 | 2.8 | ||
| 11 | 2.6 | ||
| 2 | 1.7 | ||
| 4 | 2.1 |
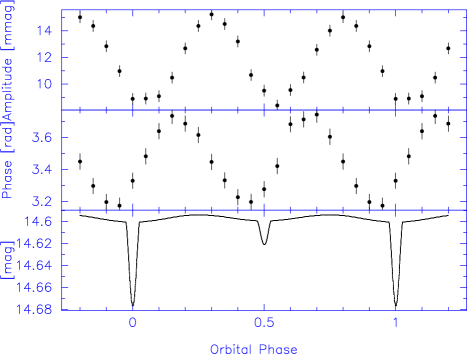
The relative amplitudes of the combinations are much larger for the high frequencies than for the low ones. The presence of sidelobes around all the main frequencies can be interpreted as amplitude variations during the orbital revolution. As the amplitude of is particularly large ( mmag), we decided to measure the amplitude of the radial mode at different orbital phases. We sampled the orbital period in 20 bins, each containing about 1000 measurements, and analyzed separately each data set. We forced the frequency d-1 and calculated the amplitudes and phases by least-square fits. The results are presented in Fig. 9. The amplitudes and phases present two perfect double-wave curves during the orbital period. The amplitudes varies over a range of mmag, which is consistent with the amplitude of . This variation is probably at the origin of the larger dispersion at the extrema in the -phased light curve presented in Fig. 8. The phase varies over a range of orbital period. The amplitude minima occur 0.05 orbital period (0.14 d) after the two eclipses. We were not able to detect similar amplitude variations for the Doradus frequencies, which is not surprising since the amplitudes of the frequencies are very low.
8 Discussion
After 033 (Paper I), the star 999 is the second one to present a strong coupling between Doradus and Scuti modes. In both stars, a large-amplitude Scuti-mode is dominant, followed by relatively large-amplitude -modes. The presence of the same sidelobes around the main Scuti frequency in physically different stars (999 is cooler and rotates faster than 033) means that these couplings are probably a general characteristic of hybrid Doradus- Scuti stars. We are convinced that the model of Kennedy et al. (1993), who predict such coupling in the Sun, is realistic. The low -mode frequencies trapped in the stellar interior produce oscillatory perturbations of the -mode cavities and “cause the formation of a pair of weak spectral sidelobes symmetrically placed about the unperturbed p-mode frequency”.
The amplitude of the pulsation in 999 is smaller than that in 033: mmag and mmag for the main Scuti mode, and mmag and mmag for the main Doradus mode. The larger ratio in 999 (15 compared to 4 for 033) is probably related to the lower amplitude of the main Scuti mode. But, as mentioned in Paper I, the relation between the -amplitude and that ratio is not linear. Detection of such couplings and the measurement of their ratios in other hybrid stars will give interesting information about the internal structure of these stars. Moreover, the eventual generalization of this phenomenon to hybrid Cephei-SPB stars should be explored.
Another kind of relationship between - and -modes has been detected by Breger et al. (2012) in the hybrid Doradus- Scuti star KIC 8054146. Indeed, in this very fast rotator with low-amplitude modes, Breger et al. (2012) did not detect any sidelobes around the main -mode. On the other hand, they state “the four dominant -modes determine the spacing of the higher frequencies in and beyond the Scuti -mode frequency domain”. These authors claimed that “this unusual behaviour may be related to the very rapid rotation of the star.”
Still in KIC 8054146, Breger et al. (2012) also detected strong amplitude variability with timescales of months and years for the four dominant low frequencies. To detect such a long-term modulation, we analyzed separately the first and second half of our data set. No significant evolution is noted between these two sets. Of course, the length of the CoRoT observations is much shorter than the Kepler ones, so we are not able to detect very long-term variations. However, if 999 had large variations similar to those of KIC 8054146, we should have detected them. Since the value of the four main frequencies of KIC 8054146 is comparable to the rotation frequency, these amplitude variations may be related to the very fast rotation.
The asymptotic series of periods separated by d corresponds to a family of modes with successive radial orders. Miglio et al. (2008) computed the evolutionary effect on the variation of . In three of their models (with a central hydrogen abundance equal to , 0.3 and 0.5), the fluctuations are larger than 0.01 d, whereas the dispersion is about 0.002 d in our case. Therefore, only the model with a central hydrogen abundance is compatible with the stability of observed in 999. After elimination of all the combination or coupled frequencies and the asymptotic series, 40 independent Doradus frequencies remain. Since only low -modes can be detected in photometry, other asymptotic series certainly exist, but we were not able to detect them.
Finally, the double-wave variation of the amplitude and the phase of the main Scuti frequency gives rise to combinations. Such combinations were also detected for five of the main Doradus frequencies, but with much lower amplitudes. Because the frequency corresponds to the elliptic luminosity variations, this phenomenon could be related to the geometry of the star: the minimum of the amplitude occurs when the visible surface of the star is close to its minimum (but not at minimum). Therefore, this latter occurence, together with the presence of a small but real phase lag between the eclipse and the double wave curve, points rather towards tidal effects.
Acknowledgements.
The authors are grateful to the anonymous referee for useful remarks and comments. The authors also thank the L3 students Fanny Girard and Matthieu Grau.References
- Auvergne et al. (2009) Auvergne, M., Bodin, P., Boisnard, L. et al. 2009, A&A, 506, 411
- Baglin et al. (2006) Baglin, A., Michel, E., Auvergne, M. et al. 2006, ESASP, 624, 34
- Balona et al. (2011) Balona, L.A. 2011, MNRAS, 415, 1691
- Borucki et al. (1997) Borucki, W.J., Koch, D.G., Dunham, E.W., Jenkins, J.M. 1997, ASP Conf. 119, 153
- Bouabid et al. (2011) Bouabid, M.-P., Montalbán, J., Miglio, A. et al. 2011, A&A, 531, 145
- Breger et al. (2012) Breger, M., Fossati, L., Balona, L. et al. 2012, ApJ, 759, 62
- Christensen-Dalsgaard et al. (2008) Christensen-Dalsgaard, J., Arentoft, T., Brown, T.M. et al. 2008, Journal of Physics Conference Series, 118, 2039
- Cabrera et al. (2009) Cabrera, J., Fridlund, M., Ollivier, M. et al. 2009, A&A, 506,501
- Chapellier et al. (2012) Chapellier, E., Mathias, P., Weiss, W.W. et al. 2012, A&A, 540, 117
- Deleuil et al. (2009) Deleuil, M., Meunier, J. C., Moutou, C. et al. 2009, AJ, 138, 649
- Fitch (1981) Fitch, W.S., 1981, ApJ, 249, 218
- Kennedy et al. (1993) Kennedy, J.R., Jefferies, S.M., Hill, F. 1993, ASP Conf. Ser., 42, 273
- Lenz & Breger (2005) Lenz, P., Breger, M. 2005, CoAst, 146, 53
- Miglio et al. (2008) Miglio, A., Montalbán, J., Noels, A., Eggenberger, P. 2008, MNRAS, 386, 1487
- Montgomery & O’Donoghue (1999) Montgomery, M.H., O’Donoghue, D. 1999, DSSN, 13,28
- Poretti et al. (2005) Poretti, E., Suárez, J.C., Niarchos, P.G., et al. 2005, A&A, 440, 1097
- Prša & Zwitter (2005) Prša, A., Zwitter, T. 2005, ApJ. 628, 426
- Sarro et al. (2013) Sarro, L.M., Debosscher, J., Neiner, C. et al. 2013, A&A, 550, 120
- Templeton et al. (2002) Templeton, M., Basu, S., Demarque, P. 2002, ApJ, 576, 963
- Uytterhoeven et al. (2011) Uytterhoeven, K., Moya, A., Grigahcène, A. et al. 2011, A&A, 534, 125
- Walker et al. (2003) Walker, G., Matthews, J., Kuschnig, R. et al. 2003, PASP, 115, 1023