VLBI Observation of Microquasar Cyg X-3 during an X-ray State Transition from Soft to Hard in the 2007 May-June Flare
Abstract
We present a radio observation of microquasar Cyg X-3 during an X-ray state transition from ultrasoft to hard state in the 2007 MayJune flare using the VLBI Exploration of Radio Astrometry (VERA) at 22 GHz. During the transition, a short-lived mini-flare of hr was detected prior to the major flare. In such a transition, a jet ejection is believed to occur, but there have been no direct observations to support it. An analysis of Gaussian fits to the observed visibility amplitudes shows a time variation of the source axis, or a structural change, during the mini-flare. Our model fits, together with other multiwavelength observations in the radio, soft, and hard X-rays, and the shock-in-jet models for other flaring activities at GHz wavebands, suggest a high possibility of synchrotron flares during the mini-flare, indicative of a predominant contribution from jet activity. Therefore, the mini-flare with an associated structural change is indicative of a jet ejection event in the state transition from ultrasoft to hard state.
Online-only material: color figure
1 Introduction
Cyg X-3 is an X-ray binary that was first discovered in X-rays (Giacconi et al., 1967). A short orbital period of 4.8 hr (Parsignault et al., 1972; Becklin et al., 1973) and a massive WolfRayet donor star (van Kerkwijk et al., 1996; Koch-Miramond et al., 2002) make Cyg X-3 a tight high-mass X-ray binary system. The nature of the compact object is still a matter of debate, but there has been growing evidence of a black hole (e.g., Shrader et al., 2010, and references therein). Cyg X-3 is the brightest X-ray binary in the radio and has displayed frequent flaring activity since the discovery of a giant flare in 1972 (Gregory & Kronberg, 1972; Waltman et al., 1994, 1995, 1996). Waltman et al. (1994) identified three types of variability in the 19881992 light curves at 2.25 and 8.3 GHz: frequent minor flaring activity of 1 Jy, intermediate flares (1 Jy), and major flares (10 Jy). In addition, there are pre-flare quenched states of tens of mJy prior to the flares, and flickering activity during quiescence. In very long baseline interferometry (VLBI) observations, clearly resolved jet structures on tens of milliarcsecond (mas) scales have been observed (Newell et al., 1998; Mioduszewski et al., 2001; Miller-Jones et al., 2004; Tudose et al., 2007, 2010). Even in the observations with unresolved structure, model fits indicate expanding jet-like structures (e.g., Geldzahler et al., 1983; Spencer et al., 1986; Molnar et al., 1988; Schalinski et al., 1995, 1998). However, the VLBI observations have mostly been carried out during major flares, in particular after the peak, and rarely performed in the rise to the peak mainly due to the slow reaction time of the VLBI facilities after the triggering of flares. Therefore, it is important to probe the rise phase to understand the evolution of flares and associated initiation of jets.
Cyg X-3 exhibits the canonical X-ray states such as low/hard state, very high state, intermediate state, high/soft state, ultrasoft state, and quiescence. However, the X-ray spectra in Cyg X-3 are complex and significantly different from other X-ray binaries (e.g., McClintock & Remillard, 2000; Fender et al., 2004; Szostek et al., 2008; Hjalmarsdotter et al., 2009; Koljonen et al., 2010). In Cyg X-3, the X-ray hardness intensity diagram (HID), a plot of X-ray flux versus X-ray color (hardness), does not show a typical hysteresis unlike other black hole X-ray binaries (Koljonen et al., 2010, and references therein). Fender et al. (2004) predict that a relativistic ejection is expected to occur in a transition to a harder X-ray state across the “jet line”, while soft states do not seem to produce jets. Based on further analysis of the HID, Koljonen et al. (2010) conclude that Cyg X-3 crosses the jet line and a major radio flare occurs when there is a transition from a “hypersoft state” (or canonical state of the ultrasoft state) to a flaring, harder X-ray state.
On 2007 June 1, Cyg X-3 was found in a radio flare at 130 GHz with the RATAN-600 radio telescope (Trushkin et al., 2007). The radio flare reached 1.6 Jy at 1 GHz and 3.9 Jy at 30 GHz the next day, and declined to 1 Jy at 130 GHz within the next two to three days (Figure 1). A few days prior to the radio observation, the hard X-rays (1550 keV) rapidly increased with the hardening in the soft X-rays (see the third and bottom panels in Figure 1). After a soft state observed since 2007 April (Krimm et al., 2007), an extreme soft, or ultrasoft state was observed with during May 2126 (JD 2,454,2422,454,247; (Soldi et al., 2007; Beckmann et al., 2007). During May 2729 (JD 2,454,2482,454,250), the onset of an X-ray state transition was observed with and six days later during June 512, it reached a hard state (Beckmann et al., 2007). Our VLBI observation was carried out after reported Cyg X-3 in its ultrasoft state at 320 keV (Soldi et al., 2007). In this paper, we present a VLBI observation of the 2007 May-June flare of Cyg X-3 in the rise phase during a state transition from ultrasoft to hard state.
2 VERA Observation, Data Analysis and Results
Cyg X-3 was observed at 22 GHz for 9 hr, during 1524 UT on 2007 May 29, with VLBI Exploration of Radio Astrometry (VERA). VERA consists of four 20 m antennas located at Mizusawa, Iriki, Ogasawara and Ishigaki-jima. The baseline length of VERA ranges from 1019 km (IrikiIshigaki) to 2270 km (MizusawaIshigaki), and the expected angular resolution at 22 GHz is 1.2 mas, depending on the projected baseline in the -plane.
A left-handed circular polarization (LCP) was received because the LCP signal is only available in VERA. The received signals were sampled with 2bit quantization and filtered to 16 MHz bandwidth using VERA digital filter bank (Iguchi et al. 2005). Since the recording rate of VERA DIR2000 recorder is 1024 Mbit s-1, we can record in Nyquist sampling (). Of 16 IFs, 15 were assigned to Cyg X-3 and one IF was assigned to another target, W75N (Kim et al., 2013), separated by from Cyg X-3. All VERA antennas have a facility of dual-beam receiving system (Kawaguchi et al., 2000) for simultaneously observing a target and reference source within . Since a short-duration flare of Cyg X-3 which we present in this paper was readily detected in the fringe search (see below), we did not carry out the phase-referencing VLBI technique. The data correlation processing was carried out on the Mitaka FX Correlator (Chikada et al., 1991) at the Mitaka campus of the National Astronomical Observatory of Japan (NAOJ).
The VLBI data analysis was performed using the Astronomical Image Processing System (AIPS; Greisen, 2003). For amplitude calibration, the flux density scale was set using system temperatures measured with the chopper-wheel method (Ulich & Haas, 1976) and aperture efficiency111http://veraserver.mtk.nao.ac.jp/restricted/CFP2010/status10.pdf depending on the elevation. In our VERA observation, we measured the power of a hot load and a normal sky, corresponding to the ambient and sky temperature. For the bandpass calibration, we alternately observed BL Lac for 10 minutes and Cyg X-3 for 70 minutes in a cycle of 80 minutes, which corresponds to the recording time of a tape of VERA’s recorder. For the intrinsic variability of BL Lac, the intraday variability of amplitude is a few percent (e.g., Quirrenbach et al., 1992). Therefore, the calibration is free from the intrinsic variability of BL Lac. Fringe-fitting was carried out separately for Cyg X-3 and the calibrator source, BL Lac.
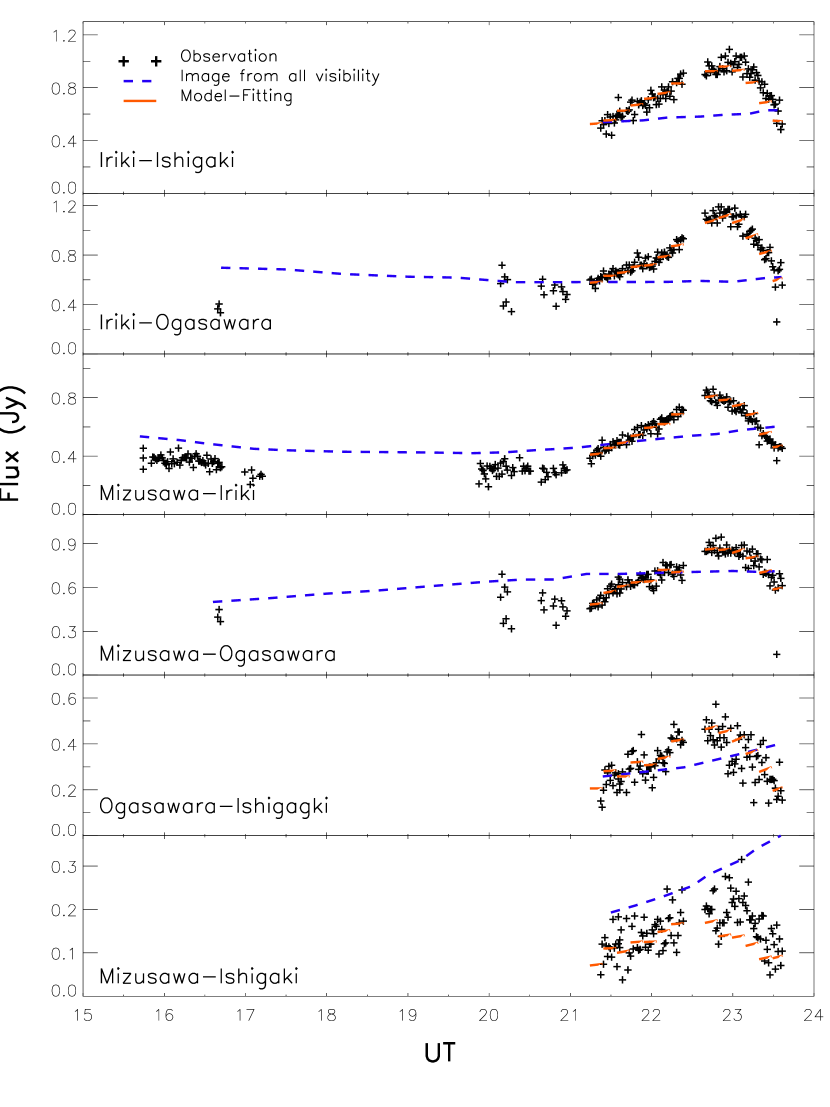
We detected fringes of Cyg X-3 with a threshold of the signal-to-noise ratio of 4 in the AIPS task FRING. The visibility amplitude from the detected fringes for each baseline is shown by the black crosses in Figure 2. All VERA stations had no systematic and technical problems during our observation. In the Ishigaki and Ogasawara stations, the system temperature highly varied up to 1,500 and 3,000 K due to bad weather before 20:00 UT, but became stabilized down to 500 and 200 K after 20:0021:00 UT, respectively. In the Iriki station, 200250 K was maintained except the rapid variation before 16:00 UT and 17:3020:00 UT. The system temperature in the Mizusawa station remained fairly constant, 150200 K, during the observation. We excluded bad data from the data analysis for system temperatures higher than 800 K or whenever the system temperature rapidly changed by 50% or more within tens of minutes. Therefore, Cyg X-3 was detected mainly at the MizusawaIriki baseline before 21:00 UT, while no detection was made at all baselines during 17:3020:00 UT. There is a short-duration flare (hereafter, “mini-flare”) for 21:0023:37 UT. The system temperature in all stations became stabilized after 21:00 UT. Therefore, the observed mini-flare is independent of systematic effects such as the antenna system temperature and source elevation that began to decrease after 19:00 UT. Note that the mini-flare is detected on all baselines, indicating that the mini-flare is an intrinsic phenomenon of the target source. The peak flux density is greater than 1 Jy on shorter baselines such as the IrikiOgasawara and IrikiIshigaki baselines, while it is less than 1 Jy on longer baselines such as the OgasawaraIshigaki and MizusawaIshigaki baselines.
From the variation of the visibility amplitudes presented in Figure 2, we infer that the detected fringes are not from a point source. The change of visibility amplitudes during the mini-flare in Figure 2 is intrinsic to the source Cyg X-3, and reminiscent of, for example, few hour-scale small flares reported by Newell et al. (1998). For the time-variation in the visibility amplitude during the flares, they suggested that structure variation was seen. They indeed produced a sequence of images from the 20-minute snapshots, implying a 0.3c jet event that clearly confirmed the change in the source structure during the flares. To investigate whether our observations of Cyg X-3 indicate temporal structural variation, we performed the following two tests. First, we tested an image by performing a hybrid mapping method for all the detected fringes assuming no structural time variation, and compared the corresponding model visibility amplitudes, shown by the blue dashed lines in Figure 2, with the observed visibility amplitudes. In the MizusawaIshigaki baseline, the model visibility amplitude over the observing time (the blue dashed line in Figure 2) is larger than the observation (the black crosses), indicating that the model is too compact compared to the real size of Cyg X-3. Therefore, such a simple model without time variation does not seem to well represent the observation.
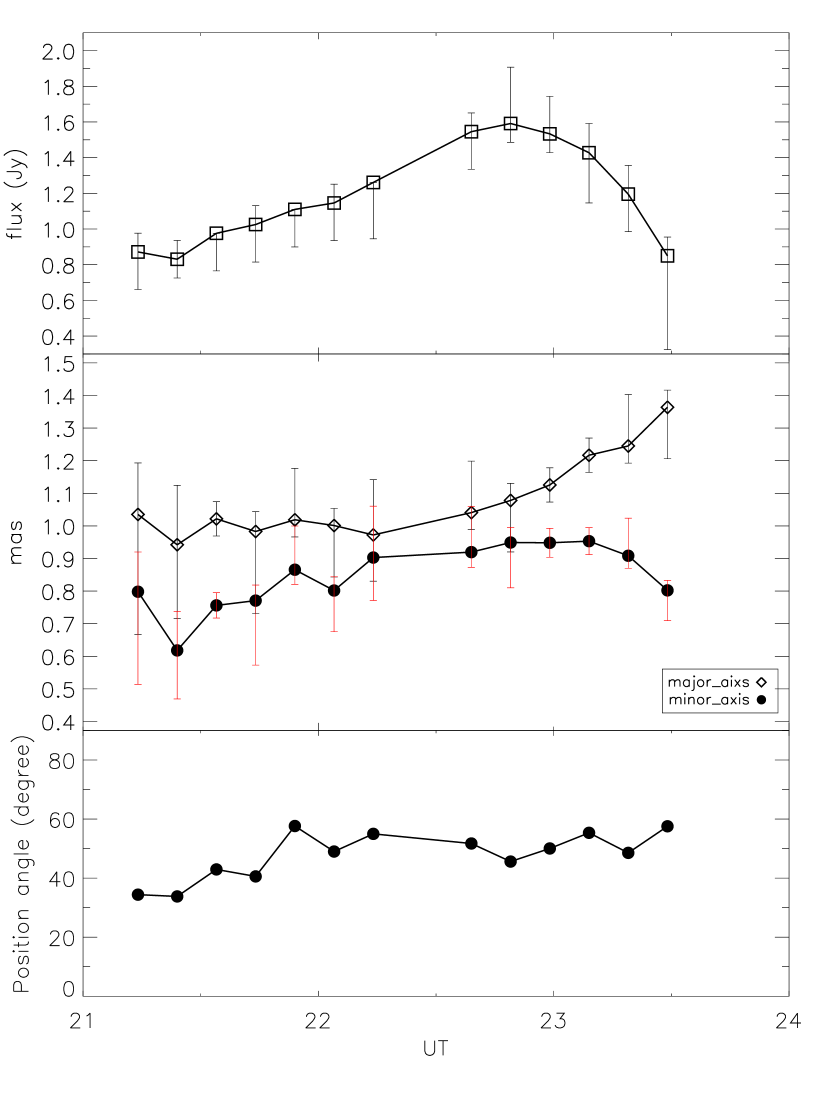
The second test we performed was an elliptical Gaussian fit to the observed visibility amplitude. Due to the limitation in coverage with only six baselines, we cannot directly produce a hybrid mapping image for a time-scale short enough to trace a change of source structure along with the variation of flux density. We checked for phase closure during observations of Cyg X-3 and obtained a value near zero within , which justifies adopting a single Gaussian fitting to the visibilities. We fitted the visibility amplitude directly in the -plane without making images. The model fitting was carried out using Caltech’s Difmap program. We adopted a single elliptical Gaussian component with a time bin of 10 minutes during the mini-flare, starting from 21:14 UT. We obtained a flux density, major axis, minor axis, and position angle of the major axis for each time bin from the model fit. The orange solid lines in Figure 2 are the visibilities produced based on the model-fit results. In Figure 3, we present the model-fit results showing total flux density, intrinsic source sizes of major and minor axes and position angle. The model flux density for each baseline, shown by the orange solid lines for each time bin, is in good agreement with the observation (Figure 2). Error analysis for the total flux density, the sizes of major and minor axes and the position angle were estimated using Difwrap (Lovell, 2000). The reduced for the model fits with time bins of 10 and 20 minutes are . The model fit with a time bin of 30 minutes has a reduced , approximately equivalent to (e.g. Dodson et al., 2003). The time-evolving features of axes and position angles for the time bins of 10, 20 and 30 minutes are consistent with each other. In the following discussion, we exclude the first data point in Figure 3 because it is a marginal detection, and the last data point because the time bin is very short ( minutes). The major axis kept increasing since 22.5 UT, hr before the peak flux density. In the two mini-flares observed by Newell et al. (1998), the extended structures (jet expansion) appeared hr prior to the peak of each flare, proportional to the increase in flux density (see Figures 4 and 5 in Newell et al., 1998). Similarly, the increase of the major axis size in Figure 3 may indicate a structural change, or jet ejection, during the mini-flare due to synchrotron emission. The position angle of the major axis is relatively stable with time, particularly after UT (the bottom panel in Figure 3). This position angle of is in agreement with the observations of Newell et al. (1998) and Schalinski et al. (1995). In the following section, we discuss the possible causes of the structural change.
3 Discussion and Conclusion
In this paper, we present a short-lived (3 hr) flaring event, or mini-flare during an X-ray state transition from ultrasoft to hard state in the early phase of the 2007 MayJune flare. No radio observation was reported prior to the peak of a few Jy except our VLBI observation. To make matters worse, no hard X-ray observation was made during most of the 2007 May-June flare. However, it is clear that a few days before our observation the hard X-ray flux of /BAT rapidly increased after its 12.5 day low flux quenched state (Figure 1). At the same time, the soft X-ray flux (/ASM) decreased and a few days later the radio flux was observed near the peak. It is well known that the strong correlation of the radio and soft X-ray emission disappears immediately before the flaring periods (Watanabe et al., 1994; Choudhury et al., 2002). In flaring states, there is a correlation between the radio and hard X-ray emission, while the soft X-ray is anti-correlated with the two wavebands (McCollough et al., 1999). Therefore, at the time of our observation, the 2007 MayJune flare was probably already in the early rise. To confirm this, we checked the multiwavelength light curves of a few previous flares. In most of the major (10 Jy) and intermediate (10 Jy) flares, the radio fluxes at GHz wavebands increase rapidly from a few hundred mJy to a few Jy when the /BAT flux increases from 0.005 to 0.02 counts s-1 cm2 (/BAT Web site; RATAN Web site222http://www.sao.ru/cats/satr/XB/CygX-3/; e.g., Trushkin et al., 2008). Therefore, at the time of our observation, the 2007 MayJune flare was most likely in its early rise phase since the /BAT flux was 0.02 counts s-1 cm2 (Figure 1). In Cyg X-3, small-scale flares on a time-scale of a few hours or less have been observed during low-level activity of 600 mJy at 543 GHz (e.g., Newell et al., 1998; Martí et al., 2000; Ogley et al., 2001; Miller-Jones et al., 2009), and associated jet ejections were confirmed in some cases (Newell et al., 1998; Martí et al., 2000). However, a flare on a similar time scale prior to major or intermediate flares, such as the mini-flare of 1 Jy that we have presented in this paper, has not been reported.
Due to the absence of published X-ray spectra during the radio flare of 2007 May-June (JD 2,454,2502,454,256; see Figure 1), it is not clear whether Cyg X-3 underwent an intermediate or very high state prior to the observed hard state (Beckmann et al., 2007). Koljonen et al. (2010) find that there are two types of flares: flares with hard X-rays and without hard X-rays, and the latter does not reveal any jet-like structure (also see Fender et al., 2004). They point out that the first two observations in 2007 May (JD 2,454,241 and JD 2,454,246) during a quenched state correspond to the hypersoft or ultrasoft state (Figure 1). Therefore, a further transition to a harder state in 2007 MayJune would result in crossing the jet line in HID. From Figure 1, it is clear that Cyg X-3 already changed its state from the ultrasoft to a harder state with rapidly increasing hard X-rays of /BAT during our observation. Therefore, the structural change in our observation (Figures 2 and 3) indicates that the mini-flare is plausibly produced by a jet ejection in the early phase of the 2007 MayJune flare. Furthermore, Trushkin et al. (2007) point out that, prior to the major flare in 2007 MayJune, the observations of /BAT in mid- to late 2007 April (Krimm et al., 2007) and in 2007 May 21 (Soldi et al., 2007) clearly indicate a possible jet ejection event.
What can be a cause of the mini-flare? The most appropriate model to account for such a mini-flare would be the so-called shock-in-jet model (Marscher & Gear, 1985). The model is an analytic, parameterized shock model describing the synchrotron emission associated with relativistic jets to account for the radio and near-infrared light curves of flaring activities in quasars and microquasars (Türler et al., 2000; Türler, 2011). The model can reproduce the variable jet emission in microquasars, very similar to that of extra-galactic jets in quasars, suggesting that the physical characteristics of the relativistic jets are independent of the black hole masses (Türler and Lindfors, 2007). As for small-scale flares in other microquasars, for example, Türler et al. (2004) reproduced a series of flaring events of a few hours observed at 2.2 and 26 cm during a plateau state in the microquasar GRS 1915+105. In the case of Cyg X-3, the model accounts for a series of small-scale, tens of minutes to an hour, flaring activities in the decay phase of a half-day long radio flare ( mJy) at 1.443.3 GHz observed in 2002 January 25 (Miller-Jones et al., 2009). The model can also reproduce the major and intermediate flares of Cyg X-3 by adopting a different time-scale, peak flux density and frequency of each flaring activity at 2.2 and 2.2515 GHz (e.g., Türler, 2011), suggesting that the same phenomena are at work. The difference is that the brighter flares peak at lower frequencies and have longer time-scales than fainter flares, which is consistent with the formation of shocks further downstream in the jet (for further discussion, see Miller-Jones et al., 2009; Türler, 2011).
In our observation, the model fits with a single elliptical Gaussian component are in good agreement with the observed visibility amplitudes. The model fits indicate the variation of axis size during the mini-flare, similar to the previous observations of the two mini-flares at different flux scales, both of which included jet imaging (Newell et al., 1998). A possibility of jet ejection is also supported by other multiwavelength observations in the radio, soft and hard X-rays during the 2007 MayJune flare (Trushkin et al., 2007; Krimm et al., 2007; Soldi et al., 2007; Beckmann et al., 2007; Koljonen et al., 2010). In particular, it has been suggested that the jet ejection is highly expected during a state transition from soft to harder X-ray state (e.g., Koljonen et al., 2010; Fender et al., 2004). The shock-in-jet model for microquasars suggests that various flares with different time scales can be described by a synchrotron flare (Türler et al., 2000, 2004; Türler, 2011; Miller-Jones et al., 2009). Therefore, together with such observations and models for flaring activities in Cyg X-3 and other microquasars, our model fits suggest a high possibility of synchrotron flares and an associated jet ejection during the X-ray state transition from ultrasoft to hard state in the 2007 MayJune flare. The observation of jet activity in this particular state transition has been a long-awaited issue. We present observational evidence of such an expected jet ejection event in the state transition for the first time. The next challenge is to image a variety of jet ejection events with the combined array of VERA and Korean VLBI Network333http://kvn-web.kasi.re.kr/en/en_index.php which will provide better UV coverage and allow us to make snap shot images of rapidly variable sources.
References
- Becklin et al. (1973) Becklin, E. E., Neugebauer, G., Hawkins, F. J., et al. 1973, Natur, 245, 302
- Beckmann et al. (2007) Beckmann, V., Soldi, S., Bélanger, G., et al. 2007, A&A, 473, 903
- Chikada et al. (1991) Chikada, Y., Kawaguchi, N., Inoue, M., et al. 1991, Frontiers of VLBI, ed. H. Hirabayashi et al. (Tokyo: Universal Academy Press), 79
- Choudhury et al. (2002) Choudhury, M., Rao, A. R., Vadawale, S. V., Ishwara-Chandra, C. H., & Jain, A. K. 2002, A&A, 383, L35
- Dodson et al. (2003) Dodson, R., Legge, D., Reynolds, J. E., & McCulloch, P. M. 2003, ApJ, 596, 1137
- Fender et al. (2004) Fender, R. P., Belloni, T. M., & Gallo, E. 2004, MNRAS, 355, 1105
- Geldzahler et al. (1983) Geldzahler, B. J., Johnston, K. J., Spencer, J. H., et al. 1983, ApJL, 273, L65
- Giacconi et al. (1967) Giacconi, R., Gorenstein, P., Gursky, H., & Waters, J. R. 1967, ApJL, 148, L119
- Gregory & Kronberg (1972) Gregory, P. C., & Kronberg, P. P. 1972, Natur, 239, 440
- Greisen (2003) Greisen, E. W. 2003, Information Handling in AstronomyHistorical Vistas, ed. A. Heck, Strasbourg Astronomical Observatory, France (Astrophysics and Space Science Library, Vol. 285; Dordrecht: Kluwer), 109
- Hjalmarsdotter et al. (2009) Hjalmarsdotter, L., Zdziarski, A. A., Szostek, A., & Hannikainen, D. C. 2009, MNRAS, 392, 251
- Iguchi et al. (2005) Iguchi, S., Kurayama, T., Kawaguchi, N., & Kawakami, K. 2005, PASJ, 57, 259
- Kawaguchi et al. (2000) Kawaguchi, N., Sasao, T., & Manabe, S. 2000, Proc. SPIE, 4015, 544
- Kim et al. (2013) Kim, J.-S., Kim, S.-W., Kurayama, T., et al. 2013, ApJ, 767, 86
- Koch-Miramond et al. (2002) Koch-Miramond, L., Ábrahám, P., Fuchs, Y., Bonnet-Bidaud, J.-M., & Claret, A. 2002, A&A, 396, 877
- Koljonen et al. (2010) Koljonen, K. I. I., Hannikainen, D. C., McCollough, M. L., Pooley, G. G., & Trushkin, S. A. 2010, MNRAS, 406, 307
- Krimm et al. (2007) Krimm, H. A., Barthelmy, S. D., Barbier, L., et al. 2007, ATel, 1061, 1
- Lovell (2000) Lovell, J. 2000, in Proc. VSOP Symp., Astrophysical Phenomena Revealed by Space VLBI, ed. H. Hirabayashi, P. G. Edwards, & D. W. Murphy, 301
- Marscher & Gear (1985) Marscher, A. P., & Gear, W. K. 1985, ApJ, 298, 114
- Martí et al. (2000) Martí, J., Paredes, J. M., & Peracaula, M. 2000, ApJ, 545, 939
- McClintock & Remillard (2000) McClintock, J. E., & Remillard, R. A. 2000, ApJ, 531, 956
- McCollough et al. (1999) McCollough, M. L., Robinson, C. R., Zhang, S. N., et al. 1999, ApJ, 517, 951
- Miller-Jones et al. (2004) Miller-Jones, J. C. A., Blundell, K. M., Rupen, M. P., et al. 2004, ApJ, 600, 368
- Miller-Jones et al. (2009) Miller-Jones, J. C. A., Rupen, M. P., Türler, M., et al. 2009, MNRAS, 394, 309
- Mioduszewski et al. (2001) Mioduszewski, A. J., Rupen, M. P., Hjellming, R. M., Pooley, G. G., & Waltman, E. B. 2001, ApJ, 553, 766
- Molnar et al. (1988) Molnar, L. A., Reid,M. J., & Grindlay, J. E. 1988, ApJ, 331, 494
- Newell et al. (1998) Newell, S. J., Garrett, M. A., & Spencer, R. E. 1998, MNRAS, 293, L17
- Ogley et al. (2001) Ogley, R. N., Bell Burnell, S. J., Spencer, R. E., et al. 2001, MNRAS, 326, 349
- Parsignault et al. (1972) Parsignault, D. R., Gursky, H., Kellogg, E. M., et al. 1972, Natur, 239, 123
- Quirrenbach et al. (1992) Quirrenbach, A., Witzel, A., Krichbaum, T. P., et al. 1992, A&A, 258, 279
- Schalinski et al. (1995) Schalinski, C. J., Johnston, K. J., Witzel, A., et al. 1995, ApJ, 447, 752
- Schalinski et al. (1998) Schalinski, C. J., Johnston, K. J., Witzel, A., et al. 1998, A&A, 329, 504
- Shrader et al. (2010) Shrader, C. R., Titarchuk, L., & Shaposhnikov, N. 2010, ApJ, 718, 488
- Soldi et al. (2007) Soldi, S., Beckmann, V., Courvoisier, T. J.-L., & Kreykenbohm, I. 2007, ATel, 1081, 1
- Spencer et al. (1986) Spencer, R. E., Swinney, R. W., Johnston, K. J., & Hjellming, R. M. 1986, ApJ, 309, 694
- Szostek et al. (2008) Szostek, A., Zdziarski, A. A., & McCollough, M. L. 2008, MNRAS, 388, 1001
- Trushkin et al. (2007) Trushkin, S. A., Bursov, N. N., & Nizhelskij, N. A. 2007, ATel, 1092, 1
- Trushkin et al. (2008) Trushkin, S. A., Nizhelskij, N. N., & Sotnikova, J. V. 2008, ATel, 1483, 1
- Tsuboi et al. (2008) Tsuboi, M., Tosaki, T., Kuno, N., et al. 2008, PASJ, 60, 465
- Tudose et al. (2007) Tudose, V., Fender, R. P., Garrett, M. A., et al. 2007, MNRAS, 375, L11
- Tudose et al. (2010) Tudose, V., Miller-Jones, J. C. A., Fender, R. P., et al. 2010, MNRAS, 401, 890
- Türler (2011) Türler, M. 2011, MmSAI, 82, 104
- Türler et al. (2004) Türler, M., Courvoisier, T. J.-L., Chaty, S., & Fuchs, Y. 2004, A&A, 415, L35
- Türler et al. (2000) Türler, M., Courvoisier, T. J.-L., & Paltani, S. 2000, A&A, 361, 850
- Türler and Lindfors (2007) Türler, M., & Lindfors, E. J. 2007, in Proc. IAU Symp. 238, Black Holes from Stars to Galaxies—Across the Range of Masses, ed. V. Karas & G. Matt (Cambridge: Cambridge Univ. Press), 305
- Ulich & Haas (1976) Ulich, B. L., & Haas, R. W. 1976, ApJS, 30, 247
- van Kerkwijk et al. (1996) van Kerkwijk, M. H., Geballe, T. R., King, D. L., van der Klis, M., & van Paradijs, J. 1996, A&A, 314, 521
- Waltman et al. (1994) Waltman, E. B., Fiedler, R. L., Johnston, K. L., & Ghigo, F. D. 1994, AJ, 108, 179
- Waltman et al. (1996) Waltman, E. B., Foster, R. S., Pooley, G. G., Fender, R. P., & Ghigo, F. D. 1996, AJ, 112, 2690
- Waltman et al. (1995) Waltman, E. B., Ghigo, F. D., Johnston, K. J., et al. 1995, AJ, 110, 290
- Watanabe et al. (1994) Watanabe, H., Kitamoto, S., Miyamoto, S., et al. 1994, ApJ, 433, 350