High resolution mapping of CO(1-0) in NGC6240 ††thanks: Based on observations carried out with the IRAM Plateau de Bure Interferometer. IRAM is supported by INSU/CNRS (France), MPG (Germany) and IGN (Spain).
We present high spatial resolution CO(1-0) mapping of the luminous infrared galaxy NGC6240 obtained with the IRAM - Plateau de Bure Interferometer. This source is a well-known early-stage merging system hosting two AGN. We find a broad CO(1-0) line profile, with maximum velocity 800 and , and displaying several kinematic components, revealing the complexity of the gas dynamics in this system. We detect a blueshifted CO emission with velocity in the range -200 and -500 , peaked around the southern AGN, at the same position where the outflow is located, and with a mass loss rate of . We interpret this blueshifted component as a outflow, originating from the southern nucleus. The spatial and spectral match strongly suggests that the CO outflow is connected to the superwind located around the southern nucleus, and to the large scale CO outflow, with similar velocities, extended on scales of 10 kpc. The large mass loading factor () of the molecular gas suggests that the outflow is likely driven by both SNa winds and the radiation of the southern AGN. We discovered a nuclear, redshifted CO emission peaking in the mid point of the two nuclei, as it is the case for the CO emission at the systemic velocity. The large velocity dispersion, which reaches its maximum (500 ) in the mid point between the two nuclei, suggests that the gas might be highly turbulent in this region, although the presence of an unresolved rotation component cannot be ruled out.
Key Words.:
Galaxies: individual: NGC6240 – Galaxies: interaction – Galaxies: evolution – Galaxies: ISM – Galaxies: active1 Introduction
Galaxy encounters and AGN and starburst feedbacks represent key processes in the hierarchical galaxy formation and evolution. Mergers modify the galaxy morphology, destabilize cold gas and trigger both star formation and nuclear accretion onto super-massive black holes (SMBHs), therefore inducing active galactic nuclei (AGN) activity (Sanders et al. 1988, Barnes & Hernquist 1996, Cavaliere& Vittorini 2000, Di Matteo et al. 2005). Simulations of major mergers of disk galaxies with small gas-to-star content ratio are able to broadly reproduce the properties of local early type galaxies (Barnes & Hernquist 1996, Mihos & Hernquist 1996, Bournaud et al. 2004, Hoffman et al. 2010). Mergers of gas-rich disk galaxies may easily form massive clumps due to internal instabilities, and lead to the formation of irregular spheroids with high local velocity dispersion (typically 150-200 , Bournaud et al. 2011).
AGN and starburst feedbacks are also expected to affect evolution of galaxies (Silk & Rees 1999, King 2010 and references therein), by heating the interstellar medium (ISM) through winds, outflows and shocks, thus inhibiting further accretion onto SMBH and quenching star formation on nuclear and possibly larger scales in the galactic disk of the host. Radiative feedback from a luminous AGN and/or mechanical feedback from AGN jets could explain the low gas content of local massive galaxies and the galaxy bimodal color distribution (Kauffmann et al. 2003, Croton et al. 2006, Menci et al. 2006, Faucher-Giguere & Quataert 2012). Evidence is mounting for AGN feedback as a mechanism contributing to the transformation of AGN host galaxies. Massive, spatially extended outflows have been recently discovered in several local (U)LIRGs and QSOs (Feruglio et al. 2010, Fisher et al 2010, Alatalo et al. 2011, Sturm et al. 2011, Aalto et al. 2012, Cicone et al. 2012, Maiolino et al. 2012, Feruglio et al. 2013: F13 hereafter).
NGC6240 offers the opportunity to study the intermediate phase of a merger event, between the first encounter and the final coalescence (see e.g. Sanders & Mirabel 1996, Mihos & Hernquist 1996). NGC6240 is a massive object, probably resulting from the merger of two gas rich spirals. The remnants of the bulges of the progenitor galaxies, separated by ″, along a position angle of 40 degrees, are located in the central region of the system (Engel et al. 2010). Each of them hosts an AGN, with SMBH masses exceeding (Engel et al. 2010). Both the AGNs are highly obscured by a hydrogen column density of cm-2 (Compton-thick, Komossa et al. 2003). The southern AGN has an intrinsic luminosity of L(2-10 keV) erg s-1 (Vignati et al. 1999). Observations of CO(1-0) , CO(2-1) and CO(3-2) emission lines have shown that, unlike the stellar component, most of the molecular gas is located in the region in between the two nuclei (Tacconi et al. 1999, Iono et al. 2007, Engel et al. 2010, Feruglio et al. 2013). The origin of this central concentration is still debated and fails to be reproduced by current simulations of major mergers of gas-rich galaxies. Tacconi et al. (1999) found evidence of coherent rotation in the central concentration and ascribed it to a rotating molecular disk, although with unusually large velocity dispersion. Recent high resolution observations of CO(3-2) with the SMA resolved the central concentration into two asymmetric peaks, separated by less than 1 arcsec, that are interpreted as the two gas reservoirs of the merging galaxies, stripped off from the stellar systems, and in the phase of tidally falling into the dynamical center of the system (U et al. 2011).
NGC6240 displays the brightest line emission from hot molecular hydrogen () among all LIRGs. The emission peaks close to the southern AGN, unlike the CO emission, which reaches its maximum in the mid point between the twoAGNs (Tecza et al. 2000, Ohyama et al. 2003, Engel et al. 2010). The huge luminosity of (, Egami et al. 1999, Tecza et al. 2000) is due to two main processes: a) the expanding motion of a shell-like structure around the southern nucleus (super-wind), and b) cloud-crushing at the interface of the two merging nuclei, where the super-wind interacts with the central concentration of molecular gas (Ohyama et al. 2000, 2003).
The large scale, butterfly-shaped emission-line nebula seen in HST H images is interpreted as evidence of a super-wind shock-heating the ambient ISM (Gerssen et al. 2004). The H emitting filaments and bubbles appear to trace a bipolar outflow, aligned east-westward, extending up to 15-20 arcsec (7-10 kpc) from the nuclear region, approximately perpendicular to the line connecting the two nuclei. The superwind is probably powered by both the nuclear star-formation and by the southern AGN. F13 recently reports the detection of large scale structures of CO, extended on 10 kpc scales, possibly tracing an outflow. Recently, Sturm et al. (private communication, in preparation) detected a P-Cygni profile absorption line of OH with Herschel-PACS, with velocities similar to those found in CO(1-0), unambiguously tracing a molecular outflow, although not spatially resolved due to the Herschel PSF.
We present in this work high spatial resolution observations of CO(1-0) in NGC6240 obtained with the IRAM Plateau de Bure Interferometer (PdBI) in the A array configuration. F13 presents an analysis of the extended CO emission of NGC6240 on scales of 10 kpc around the nuclei, whereas in this work we focus on the nuclear region, close around the two AGN and the two merging bulges. All positions, fluxes and sizes given in the text are derived from fitting the visibilities in the uv plane, unless differently stated. A CDM cosmology ( km s-1 Mpc-1; 0.3; ) is adopted.
2 PdBI observations and data analysis
We observed with the PdBI the CO(1-0) transition, redshifted to 112.516 GHz assuming a systemic velocity of 7339 (Iono et al. 2007), corresponding to a redshift of 0.02448. The observations were carried out in January 2012 with 5 antennas in the extended (A) array configuration.
Data reduction was performed using GILDAS. The system temperatures during the observations were in the range between 150 and 300 K. The on-source time, after merging all the data and after flagging of the bad visibilities, is 10 hours4. The absolute flux calibration relies on the strong quasars 3C273 and 3C279 and its accuracy is expected to be of the order 10%. The synthesized beam, obtained by using natural weighting, is , with PA deg. The achieved noise level is 2 mJy/beam over 10 MHz (i.e. 26 ). Robust weighting yields a slightly higher spatial resolution (synthesized beam of ), but degrades the sensitivity to 2.5 mJy/beam in 10 MHz channels. The sensitivity of data from the D configuration alone is degraded by a factor compared to the merged A+D configuration data. The gain in spatial resolution is, however, a factor 1.8 on average. This work makes use of the A configuration data alone, since a) we aim at reaching the maximum spatial resolution in the nuclear region of NGC6240, and b) the CO emitting components presented in this paper are all detected with a significance (see Section 3), so the degraded sensitivity is not an issue.
3 Results
3.1 3 mm continua
The 3 mm continuum was estimated in a region free from emission lines (i.e. in the velocity range -3500 to -2000 and 2000 to 4000 ). The 3 mm continuum is extended and resolved into two components, each coincident with the VLBI position of the two AGN (Hagiwara et al. 2011, Figure 1). Most of the continuum emission is centered on the southern AGN. The strength of the 3 mm continuum, estimated by fitting two unresolved components is, 8.7 mJy for the southern component, and 2.9 mJy for the northern one. This agrees within the expected accuracy of our measurements (10%) with the 3 mm continuum measured from the D-array configuration data ( mJy, F13). This means that we expect little flux loss in the nuclear region due to the enhanced spatial resolution of the observations used here. The continuum emission was subtracted from the total visibilities to obtain the line emission spectra . The radio spectral indexes (in the range 0.6-0.7) based on 8 GHz (Colbert et al. 1994), 1 mm (Engel et al. 2010) and our 3 mm measurements support the synchrotron origin of the continua.
3.2 CO(1-0) emission line
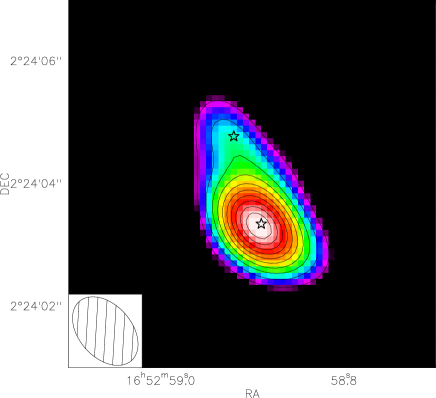
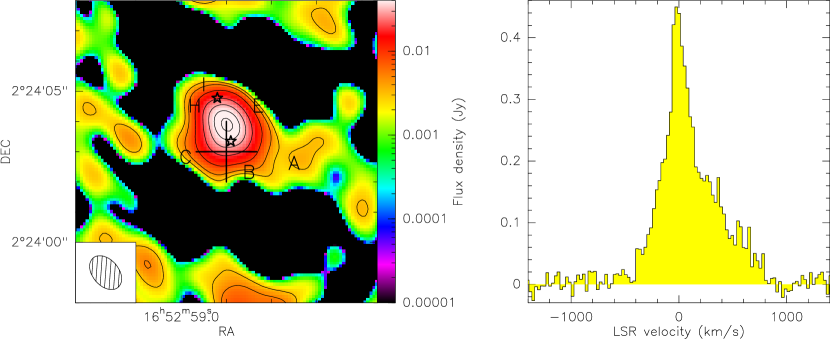
Figure 2, left panel, shows the continuum-subtracted, integrated map of CO(1-0). The CO(1-0) spectrum, integrated over a circular area of radius 3” centered on the emission peak, is shown in the right panel. The positions of the two AGN nuclei from VLBI observations (Hagiwara et al. 2011) are indicated by stars. The peak of the CO emission is centered in between the two AGN, closer to the southern AGN. Extended fainter structures are visible on scales of 5 along a position angle of 30 degrees, with similar morphology to those seen in the CO(2-1) maps (Tacconi et al. 1999). The CO emission line shows a complex profile, extending from to 800 with respect to the systemic velocity (F13). The integrated strength of the total CO(1-0) emission, by fitting the visibilities with three elliptical Gaussian components, is 321 Jy over . This is in agreement with previous interferometric measurements (Bryant & Scoville 1996, F13).
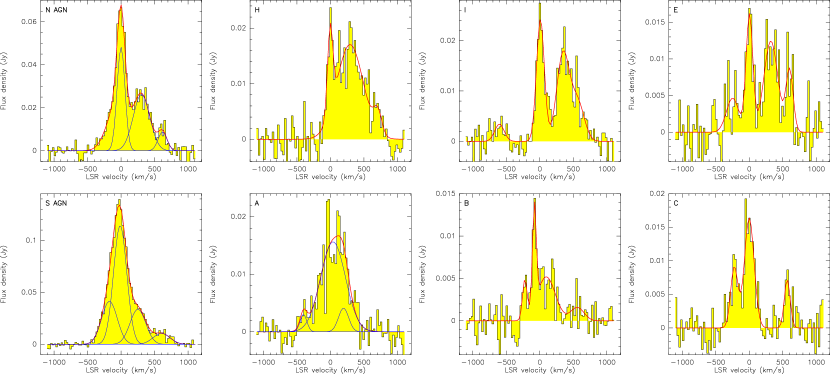
The spectra extracted from the regions labeled as A, B, C, E, H, I and with stars are shown in Figure 3. These include the positions shown in Tacconi et al. (1999). The spectra show similar line profiles as those of CO(2-1), but extending out to larger velocities (out to 800 ) on the red side of the line. Several kinematic components are detected at different velocities. The spectrum at the position of the N AGN (N AGN) shows a pronounced and well defined triple peak profile (peaking at , Table 1). The spectra at the positions E, H and I, close to the N AGN, also show at least three spectral components, peaking at similar velocities to N AGN. The spectrum at the position of the southern AGN (S AGN) shows a profile similar to N AGN, but with a larger intensity ratio between the systemic and the components. Conversely, the spectrum at the position A lacks the component, which is present in the spectra of B and C. Blueshifted components at and appear at the positions S AGN, A, B, C.
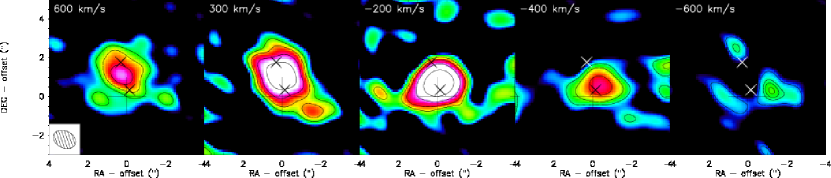
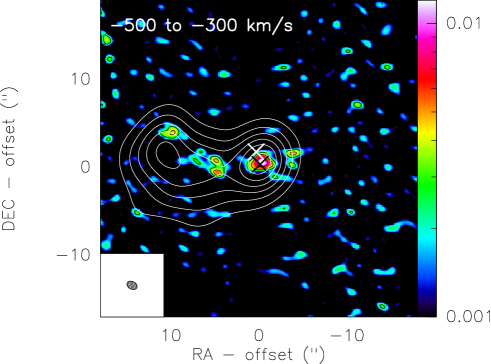
Figure 4 shows channel maps integrated over a bandwidth corresponding to the FWHM and centered on the velocities corresponding to the main peaks fitted in Table 1. Both the systemic and the redshifted gas peak in the midpoint between the two nuclei , similarly to that found by Tacconi et al. (1999), Iono et al. (2007), and Engel et al. (2010) for CO(2-1) and CO(3-2) emissions. The and redshifted gas is elongated along a position angle of 40 degrees, with a size of arcsec ( kpc). The integrated flux density of the high-velocity, redshifted component is 7.6 Jy in the velocity range 500 to 800 . (i.e. 2% of the total CO emission). The blueshifted gas is instead found closer to the position of S AGN, peaking at -0.3, 0.6 arcsec offset from the phase tracking center. The integrated flux density of the blueshifted component, derived from uv-fitting of two Gaussian models, one elliptical and one circular, is over 300 km/s (i.e. in the velocity range to km/s), and its projected size is arcsec, corresponding to 1.3 kpc, in approximately the east-west direction, by combining the sizes of the two fitted components. Figure 5 shows the same map as Figure 4 (panel corresponding to -400 km/s) but covering the entire field of view, in order to show the extended, blueshifted CO emitting structures discussed in F13. These extended structures are recovered by the observations in A configuration, where the brightest clumps of emission are detected with significance out to distances of arcsec eastwards and northeastwards of the nuclei, in a sort of filamentary pattern that develops in the same direction of the elongation of the compact component seen close to the S AGN. Only the more compact clumps are visible, the diffuse emission being filtered out by the interferometer. F13 showed that indeed the extended and compact diffuse gas components are connected. The geometrical and spectral matches suggest that the gas on large scales originates from the compact regions, although a projection effect cannot be a priori excluded. F13 interpreted the extended structures as an outflow, originating from the S AGN, although the possibility that they are a tidal streamer of gas, left behind in the merging process, could not be ruled out.
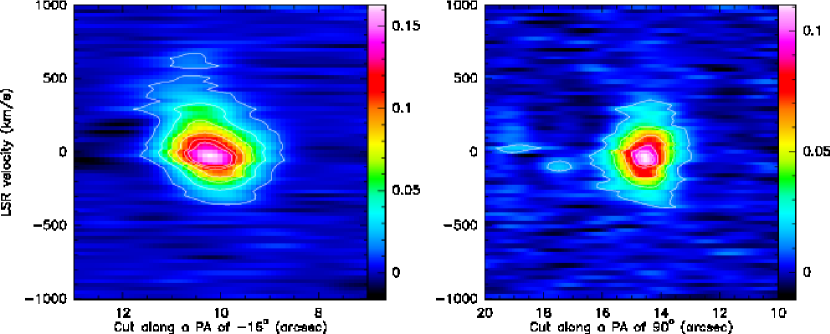
Figure 6 (left panel) shows the position-velocity cut (PV diagram) along a position angle degrees, i.e. along the line connecting the two nuclei, from south-west to north-east. The gas with velocity larger than 500 km/s is shifted to the northeastern part of the system. Although no resolved rotation pattern is seen, the position shift of the gas in the range km/s along the cut, slightly larger than the beam, suggests that there might be unresolved rotation in the central concentration of CO. The right panel of Figue 6 shows a cut along a degrees, corresponding to the direction where the blueshifted emission is elongated, and intercepting the position of the S AGN. Here as well, we do not find evidence for a coherent rotation. We find, however, that the gas with velocity between -200 and -400 km/s is seen everywhere along the cut, on scales of arcsec, as found also by fitting of the visibilities. A separated component (5) with velocity km/s is seen at 3 arcsec eastward of the nuclei.
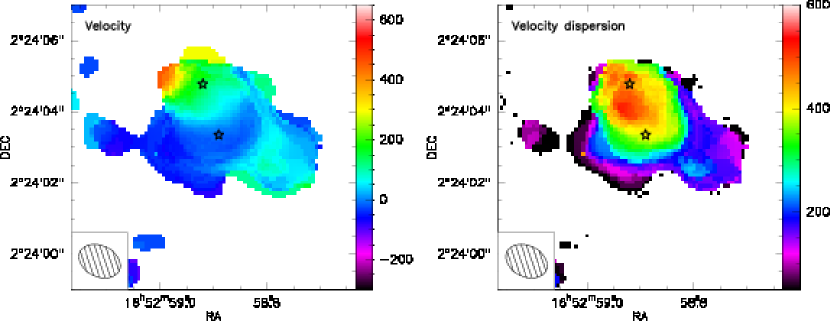
The offset in position between the peak of the redshifted and blueshifted emission is shown in Figure 7 (left panel), which shows the velocity (moment 1) distribution map of CO(1-0). The velocity gradient between the two AGN is km/s. Figure 7 (right panel) shows the line-of-sight velocity dispersion (moment 2) map. This reaches its maximum (500 ) in the central CO concentration, and in the region around the N AGN.
| Component | v, CO(1-0) | FWHM | |
|---|---|---|---|
| [Jy] | [] | [] | |
| N AGN | 4.8 | 227 | |
| 2.6 | 305 | 470 | |
| 8.7 | 619 | 260 | |
| E | 4.6 | ||
| 1.6 | |||
| 1.2 | |||
| 8.4 | |||
| H | 1.5 | ||
| 1.7 | |||
| 4.0 | |||
| I | 2.4 | ||
| 1.6 | |||
| 8.3 | |||
| S AGN | 4.2 | ||
| 1.0 | |||
| A | 3.0 | ||
| 1.6 | |||
| 4.1 | |||
| B | 4.6 | ||
| 1.2 | |||
| 5.2 | |||
| 1.6 | |||
| C | 9.1 | ||
| 1.6 | |||
| 7.2 |
4 Discussion
We have mapped the CO(1-0) emission line in NGC6240 with the extended A configuration of the PdBI, reaching an average spatial resolution of pc at the redshift of the source. The 3 mm continuum shows two components, coincident with the position of the two AGN. Our 3 mm measurements confirm the non thermal synchrotron origin of the continua (Engel et al. 2010 and references therein).
Thanks to the large bandwidth available today at the PdBI (3.6 GHz), we have detected a broad CO(1-0), reaching larger redshifted velocities than those previously reported (Tacconi et al. 1999, Iono et al. 2007, Engel et al. 2010). The CO emission, at different locations of the system, show similar line profiles to those of CO(2-1) (Tacconi et al. 1999, Engel et al. 2010), but with larger line width, and exhibit several kinematic components (blue and redshifted, compared to the systemic one, Table 1). We confirm that the molecular gas is concentrated in between the two AGN, in the so-called central concentration.
The total integrated luminosity of the CO line is , including the central concentration and the extended structure. Assuming the conversion factor tipically used for ULIRGs, (Solomon et al. 1997), we derive a total mass of molecular gas of . This is in agreement with the estimate reported by Iono et al. (2007), , based on CO(3-2). The luminosity of CO in the central 1 kpc region is over a line width of 1400 . This converts into a molecular gas mass of , consistent with the mass derived from CO(2-1) (Engel et al. 2010).
We report the discovery of a new nuclear component of CO(1-0) at redshifted velocities larger than 500 and up to 800 with respect to the systemic CO-derived velocity. The luminosity of this component is . The inferred mass of molecular gas is , assuming . The possible existence of this component was suggested by Tacconi et al. (1999) and Engel et al. (2010) based on CO(2-1), although no direct evidence of such emission has been reported due to the small bandwidth. Interestingly, the redshifted emission peaks in the region between the two AGN, northwards compared to the blueshifted gas, which is concentrated closer to the S AGN (Figure 4), similarly to CO(2-1). This fact was interpreted as a evidence of a rotating, turbulent molecular disk (Tacconi et al. 1999). In contrast, Engel at al. (2010) argued that it was more likely to be a bridge of gas, which would be prominent for a merger geometry that is not too far from co-planar and prograde. They also noted, however, that for the gas mass to be consistent with models, the CO-to-conversion factor would have to be high, as it is the case of non-virialised clouds. Our data can hardly be reconciled with one turbulent, rotating disk. The large velocity observed (800 ), and the lack of a corresponding blueshifted component, rule out the rotating disk hypothesis. U et al. (2011) suggest that the large velocity gradients seen in the nuclear region are two rotating disks (the original gas reservoirs of the merging bulges) orbiting the dynamical center of the system. Limited by the spatial resolution of our data, we cannot confirm or discard this hypothesis. Current hydrodynamical simulations of mergers of gas rich galaxies (Bournaud et al. 2011) predict the formation of clumps, producing an emission line profile with multiple components. The velocity dispersions due to turbulence can reach in these systems 150-200 , and even 500 , when projected along some lines of sight. These simulations describe mergers of high-redshift galaxies, like SMGs, for which the molecular gas is expected to be more turbulent than local galaxies. NGC6240 is a merger of two massive, gas-rich galaxies, a rare case in the local universe, but common among high redshift galaxies. The origin of the huge concentration of gas in the mid point of the two nuclei is, however, still debated, and not explained by current models of merging systems.
The blueshifted emission with velocity peaks at a position arcsec north of the S AGN, at the same position of the peak (Ohyama et al. 2000, 2003). The blueshifted CO with is also found close to the S AGN, matching the outflowing component at similar velocity (Ohyama et al. 2000, 2003, Engel et al. 2010). The blueshifted components with velocities -200 and -500 are interpreted as arising from super-wind activity in the southern nucleus. These spatial and kinematic matches strongly suggest that the CO blueshifted emission is associated with the H2 emitting expanding shell, originating from the southern nucleus. The blueshifted component has , corresponding to a mass of molecular gas of , assuming (Weiss et al. 2001, Feruglio et al. 2010). Assuming that the outflow is symmetric along the major axis (bi-conical geometry), kpc, and the terminal de-projected velocity equal to the maximum blueshifted velocity , we derive a lower limit mass loss rate using the relation of Feruglio et al. (2010) and Maiolino et al. (2012):
| (1) |
assuming that the (bi)cone is uniformly filled with gas (or with gas clouds), and that there is no mass loss through the lateral sides of the cone. The kinetic power entrained in the outflow is . The nuclear star-formation rate measured from FIR SED fitting is (Yun & Carilli 2002). The derived mass loading factor of the molecular gas, in the range 8-17, suggests that, in addition to the SNa winds, the AGN contributes to the molecular outflow. In fact, according to the relation of Veilleux et al. (2011), at the rate found for NGC6240, SNe can power winds with a maximum kinetic power of . By fitting in the same spectral range, the nuclear component from the D configuration data, and using the same assumptions, we get a mass of molecular gas , and a mass loss rate in the range 300 to 450 . Accounting for the uncertainty in the flux calibration the two estimates are consistent. Conversely, we find a discrepancy when comparing the compact outflow with that extended eastwards on 10 kpc scale (F13), which has a . We discuss here possible reasons for this discrepancy, in addition to the mis-knowledge of the conversion factor , which might be different in the compact region compared to the extended one. Contrary to what assumed in our simple scenario, the eastern extended cone does not appear to be uniformly filled with gas, when seen with high spatial resolution: it shows clumps of emission of different sizes and brightnesses. Moreover, if significant amount of gas is lost through the lateral sides of the cone, the mass loss rate is not conserved with increasing radius.
Finally, the similar spatial resolution of our maps and of those of CO(2-1) (Tacconi et al. 1999) allows us to compare the line strengths in different locations of the system, i.e. the central kpc and the extended region on scales of 3 arcsec around the nuclei. Figure 1 shows that the CO(1-0) emission exhibits a very similar extension and structures to the CO(2-1) one. We measure the total emission in two apertures centered on the emission peak, with radius 1 and 1.5 arsec each. In the central 1 kpc region around the central concentration we find in the velocity range -500 to 500 . Tacconi et al. 1999) measured a flux of for the central 1 kpc region, and a total flux density of 1220 Jy in a 1.5 kpc region, in the same velocity range. The ratio for the central concentration, indicating that there the gas is moderately optically thick. The integrated flux density in the extended region around the two nuclei is , which gives , suggesting that the gas here is instead optically thin.
5 Summary
We present high spatial resolution CO(1-0) imaging of the luminous infrared galaxy NGC6240 obtained with the PdBI. We provide our main findings below:
-
1.
We find a broad CO(1-0) line profile, with a maximum velocity 800 and , with several kinematic components, witnessing the complexity of the gas dynamics in this source. The CO emission peaks in the midpoint between the two nuclei, as found in previous studies (Engel et al. 2010 and references therein). This component is not predicted by recent hydrodynamical simulations of mergers between gas rich galaxies (Bournaud et al. 2011).
-
2.
The blueshifted CO emission with -200 and -500 , peaks close to the S AGN, at the same position where a outflow is found. Based on this, and on the fact that an outflow is also seen, with similar velocities, in absorption with Herschel-PACS (Sturm et al. in prep.), we regard this result as a clear indication of a massive molecular outflow, expanding from the southern nucleus. Its mass loss rate is , and the mass loading factor of the molecular gas, , is of the order 10. The CO outflow is likely connected to the superwind around the southern nucleus (Ohyama et ao 2000, 2003), and to the large scale CO outflow, found on scales of 10 kpc, showing similar velocities (F13) and a filamentary structure that appears connected to the S AGN. The molecular compact outflow is likely driven by both AGN and SNe.
-
3.
The redshifted CO emission, which shows a maximum velocity of 800 km/s, peaks in the mid point of the two nuclei, as it is the case for the systemic CO. The most redshifted gas is shifted towards the northern part of the system (close to N AGN). The gas is probably turbulent in the nuclear region, as supported by the large velocity dispersion, which reaches its maximum (500 ) in the central CO concentration. We suggest that this component of the molecular gas is flowing towards, or perhaps orbiting the center of mass of the system, where probably the two gas reservoirs will eventually merge. Limited by the spatial resolution of our data, however, we cannot conclude about the presence or not of rotation in the centre of the system.
Interferometric observations with higher spatial resolution with ALMA will certainly add crucial constraints on the gas dynamics in NGC6240.
Acknowledgements.
We thank Dennis Downes for useful discussions. F.F. acknowledges support from PRIN-INAF 2011.References
- (1) Aalto, S., Garcia-Burillo, S., Muller, S., Winters, J. M., van der Werf, P. et al. 2012, A&A 537, 44
- (2) Alatalo, K. A., Davis, T. A., Young, L. M., Heiles, C., Blitz, L. et al. 2011, ApJ, 735, 88
- (3) Barnes, J. E. & Hernquist, L. 1996, ApJ 471, 115
- (4) Bournaud, F., Combes, F. & Jog, C. J. 2004, A&A, 418, L27
- (5) Bournaud, F., Chapon, D., Teyssier, R., Powell, L. C., Elmegreen, B. G. et al. 2011, ApJ, 730:4
- (6) Bryant, P. M., & Scoville, N. Z. 1996, ApJ, 457, 678
- (7) Cavaliere, A. & Vittorini, V. 2000, ApJ 543, 599
- (8) Cicone, C., Feruglio, C., Maiolino, R., Fiore, F., Piconcelli, E., Menci, N. et al. 2012, A&A in press, arXiv1204.5881C
- (9) Colbert, E. J. M. , Wilson, A. S. & Bland-Hawthorn, J. 1994, ApJ, 436, 89
- (10) Croton, D. J., Springel, V., White, S. D. M., De Lucia, G., Frenk, C. S. et al. 2006, MNRAS 367, 864
- (11) Di Matteo, T., Springel, V. & Hernquist, L. 2005, Nature, 433, 604
- (12) Engel, H., Davies, R. I., Genzel, R., Tacconi, L. J., Hicks, E. K. S. et al. 2010, A&A 524, 56
- (13) Faucher-Figuere, C-A. & Quataert, E. 2012, MNRAS, 425, 605
- (14) Feruglio, C., Maiolino, R., Piconcelli, E., Menci, N., Aussel, H. et al. 2010, A&A 518, 155
- (15) Feruglio, C., Fiore, F., Maiolino, R., Piconcelli, E., Aussel, H. et al. 2013, A&A, 549A, 51
- (16) Fischer, J., Sturm, E., Gonzales-Alfonso, E., Gracia-Carpio, J., Hailey-Dunsheath, S. et al., 2010, A&A,
- (17) Gerssen, J., van der Marel, R. P., Axon, D., Mihos, J. C., Hernquist, L. et al. 2004, AJ, 127, 75
- (18) Hagiwara, Y., Baan, W. A. & Klockner, H. 2011, AJ 142, 17
- (19) Hoffman, L., Cox, T. J., Dutta, S., & Hernquist, L. 2010, ApJ, 723, 818
- (20) Iono, D., Wilson, C. D., Takakuwa, S., Yun, M. S., Petitpas, G. R. et al. 2007, ApJ, 659, 283
- (21) Kauffmann, G., Heckman, T. M., Tremonti, C., Brinchmann, J., Charlot, S. et al. 2003, MNRAS, 346, 1055
- (22) King, A. R. 2010, MNRAS, 402, 1516
- (23) Komossa, S., Burwitz, V., Hasinger, G., Predehl, P., Kaastra, J. S. et al. 2003, ApJ 582, 15
- (24) Maiolino, R., Gallerani, S., Neri, R., Cicone, C., Ferrara, A. et al. 2012, MNRAS 425, 66
- (25) Menci, N., Fontana, A., Giallongo, E., Grazian, A. & Salimbeni, S. et al. 2006, ApJ, 647, 753
- (26) Menci, N., Fiore, F., Puccetti, S. & Cavaliere, A. 2008, ApJ, 686, 219
- (27) Mihos, J. C. & Hernquist, L. 1996, ApJ 464, 641
- (28) Ohyama, Y., Yoshida, M., Takata, T., Imanishi, M., Usuda, T. et al. 2000, PASJ, 52 563
- (29) Ohyama, Y., Yoshida, M. & Takata, T. 2003, AJ 126, 229
- (30) Riffel, R. A., Storchi-Bergmann, T., Winge, C., McGregor, P.J., Beck, T. et al. 2008, MNras, 385, 1129
- (31) Sanders, D. B., Soifer, B. T., Elias, J. H., Madore, B. F., Matthews, K. et al., 1988, ApJ, 325, 74
- (32) Sanders, D. B. & Mirabel, I.F. 1996 ARA&A, 34, 749
- (33) Scoville, N. Z., Frayer, D. T., Schinnerer, E. & Christopher, M. 2003, ApJ, 585, L105
- (34) Silk, J. & Rees, M. J. 1998, A&A, 331, L1
- (35) Sturm, E., Gonzalez-Alfonso, E., Veilleux, S., Fischer, J., Gracia-Carpio, J. et al. 2011, A&A 518, 36
- (36) Solomon, P. M. et al. 1997, ApJ 478, 144
- (37) Tacconi, L., Genzel, R., Tezca, M., & Gallimore, J. F. 1999, ApJ 524, 732
- (38) Tecza, M., Genzel, R., Tacconi, L. J., Anders, S., Tacconi-Garman, L. E. et al. 2000, ApJ, 537, 178
- (39) Van der Werf, P., Genzel. R., Krabbe, A., Blietz, M, Lutz, D. et al. 1993, ApJ, 405, 522
- (40) U, V. , Wang, Z., Sanders, D., Fazio, G., Chung, A. et al. 2011, ASPC, 446, 97
- (41) Vignati, P. et al. 1999, A&A 349, 57
- (42) Yun, M. S., & Hibbard, J. E. 2001, in Gas and Galaxy Evolution, ed. J. E. Hibbard, M. Rupen, & J. H. van Gorkom, ASP Conf. Proc., 240, 866
- (43) Weiss, A., Neininger, N., Húttemeister, S., & Klein, U. 2001, A&A, 365, 571