75282
rgarcia@mpifr-bonn.mpg.de
Spatially resolved atomic and molecular emission from the very low-mass star IRS54
Abstract
Molecular outflows from very low-mass stars (VLMSs) and brown dwarfs (BDs) have been studied very little, and only a few objects have been directly imaged. Using VLT SINFONI K-band observations, we spatially resolved, for the first time, the H2 emission around IRS54, a 0.1-0.2 M⊙ Class I source. The molecular emission shows a complex structure delineating a large outflow cavity and an asymmetric molecular jet. In addition, new [Fe ii] VLT ISAAC observations at 1.644 m allowed us to discover the atomic jet counterpart which extends down to the central source. The outflow structure is similar to those found in low-mass Class I young stellar objects (YSOs) and Classical TTauri stars (CTTSs). However, its Lacc/Lbol ratio is very high (80%), and the derived mass accretion rate is about one order of magnitude higher than in objects with similar mass, pointing to the young nature of the investigated source.
keywords:
stars: formation – stars: circumstellar matter – ISM: jets and outflows – ISM: individual objects: YLW52, ISO-Oph 182, IRS54 – Infrared: ISM1 Introduction
Very low-mass stars and brown dwarfs are thought to possess circumstellar disks when they are born, independently of the formation mechanism (Luhman 2012). Outflows and protostellar jets are then expected in these sources as an outcome of the accretion process.
The first jet from a BD was detected in 2005 (Whelan et al. 2005), and since then, a few objects have been studied. Most of them have been investigated through spectro-astrometry of forbidden emission lines (FELs Joergens et al. 2012; Whelan et al. 2009), and only recently, through direct CO imaging (Phan-Bao et al. 2011, 2008). These studies mostly involve relatively evolved TTauri-like objects, whereas young embedded sources (the so-called Class 0 and I objects) have seldom been studied mainly due to the lack of young candidates.
Jets from embedded young sources were traditionally identified through H2 observations at 2.122 m. Although large-scale protostellar jets are not expected in VLMSs or BDs, molecular hydrogen emission line regions (MHELs) could be present around these sources, in analogy to low-mass Class I objects (Davis et al. 2001).
We present here SINFONI K-band integral-field spectroscopic observations of the Class I VLMS IRS54 (YLW 52) at medium resolution. This source (=16:27:51.7, =-24:31:46.0) is located outside the main clouds in the Ophiuchus star-forming region, and it has a bolometric luminosity of only 0.78 L⊙ (van Kempen et al. 2009). In addition, IRS54 is a strong candidate to drive an outflow and a jet as revealed by Spitzer and H2 narrow-band images around the source (Khanzadyan et al. 2004; Jørgensen et al. 2009).
2 Results
2.1 H2 outflow morphology
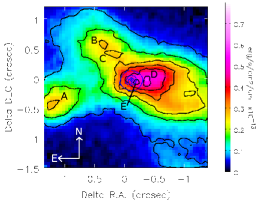
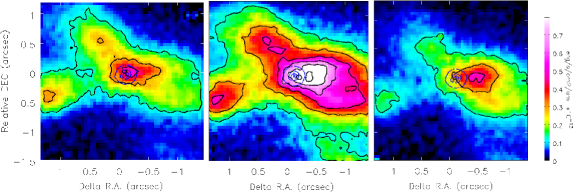
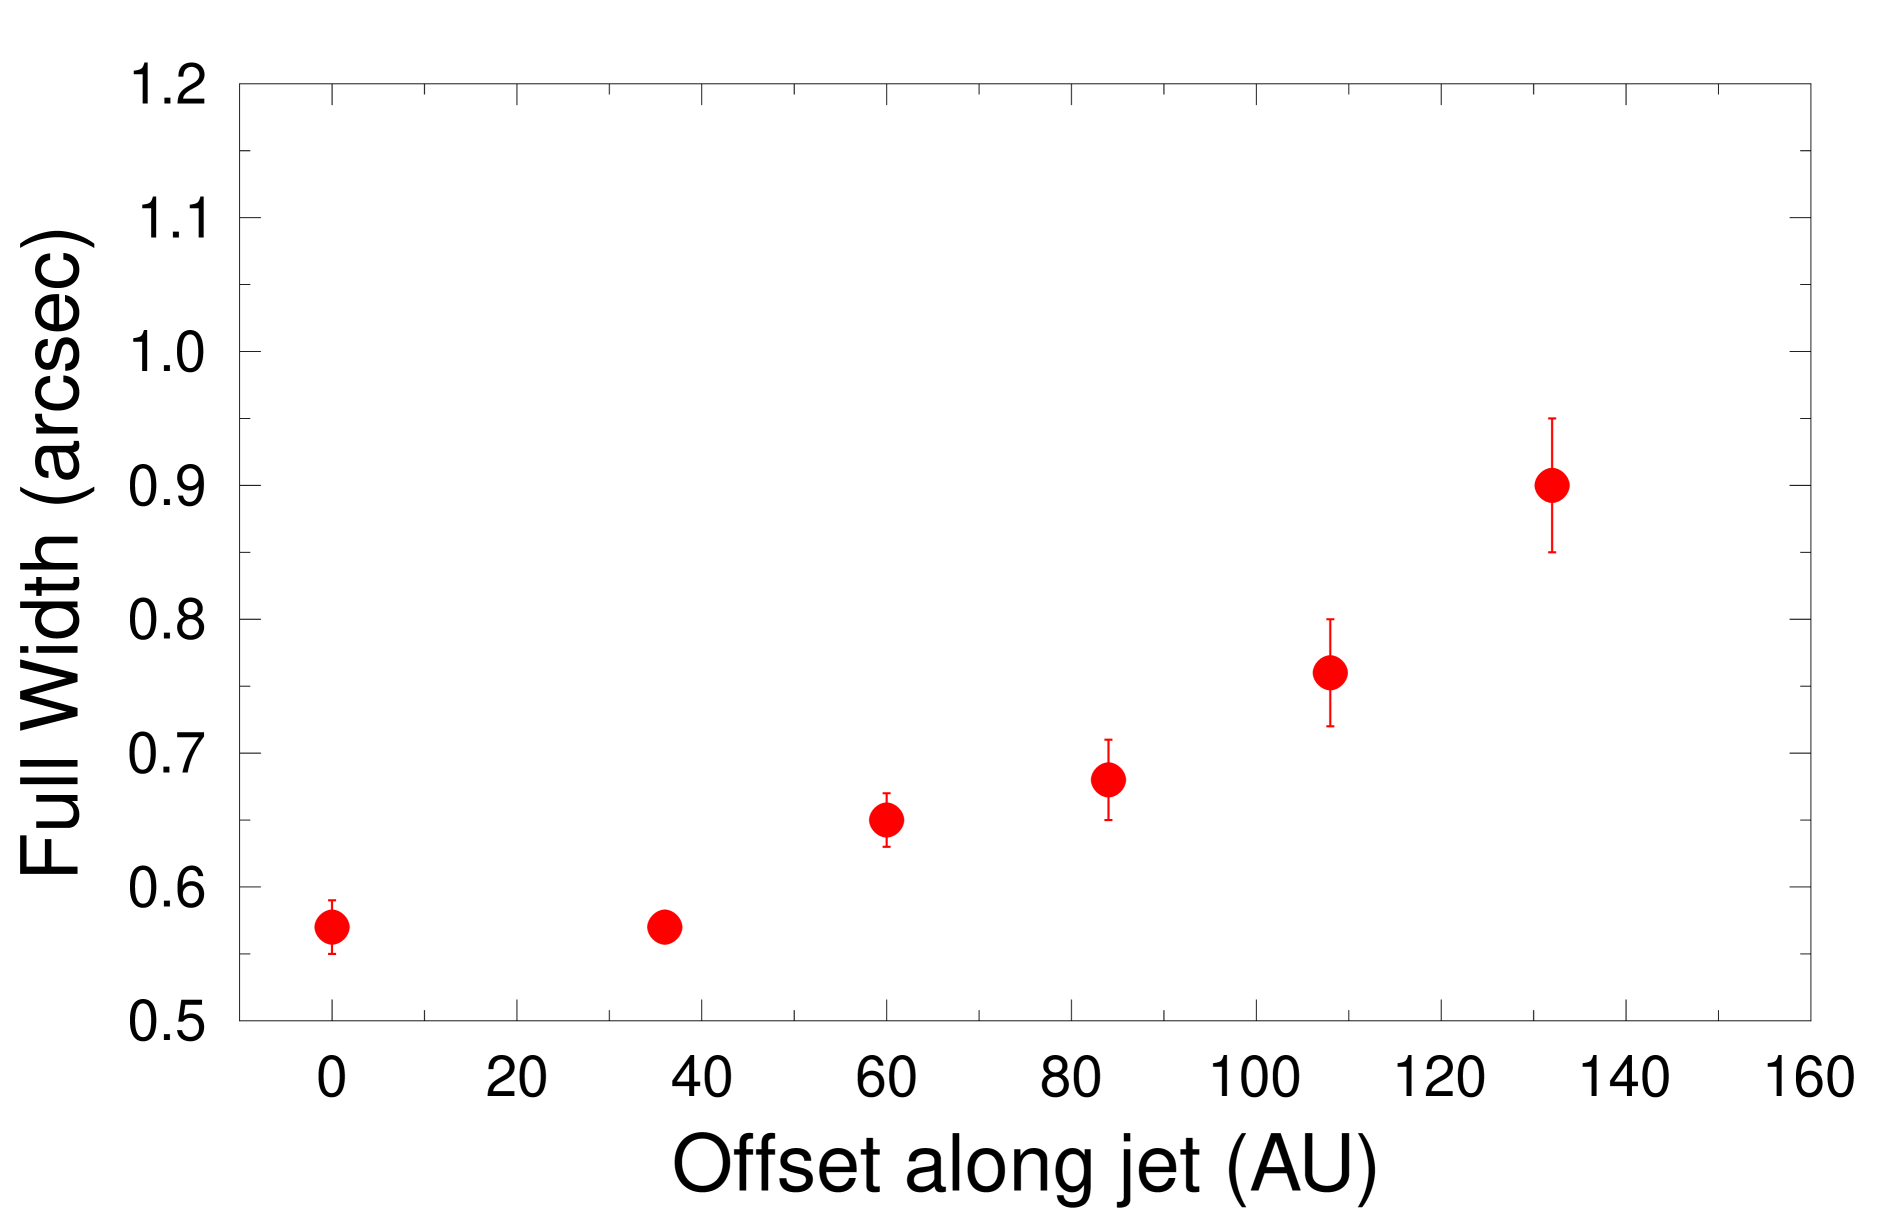
Figure 1 (left panel) shows the H2 1-0S(1) continuum-subtracted spectral image of IRS54 integrated across five velocity chanels. The morphology is very complex with gas displaying an X-shaped spatial distribution superimposed on a more collimated structure, possibly jet-like (see discussion below), located westward of IRS54 and extending over 1\arcsec (120 AU). All regions show condensations at positions A, B, C, D and E, displaced from the source (,) at about (1\farcs3,-0\farcs4), (0\farcs4, 0\farcs5), (0\farcs3, 0\farcs4), (-0\farcs1,0), and (-0\farcs3,0), respectively. As shown in the channel maps in Fig. 2, there is no clear blue- or red-shifted lobe. Indeed, red- and blue-shifted emission can be associated roughly with the same spatial regions. The H2 2.122 m line shows a very broad profile with a full width zero intensity of 200 , but with a peak velocity around 0 . This, along with the intrinsic H2 low velocity, may indicate that the outflow is very close to the plane of the sky. Figure 2 clearly shows that the jet-like structure is only present in one lobe of the outflow. This might indicate different excitation conditions for the two lobes, i.e. an asymmetric jet in which the eastern lobe (likely the blue-shifted one; see Sect. 2.2 and the right panel of Fig. 1) might have a higher velocity, dissociating the molecular H2 component. On the contrary, it might be that the jet-like structure is just H2 gas excited along the outflow cavity. However, the measured width of the H2 1-0S(1) jet-like structure as a function of the distance from the source is consistent with a full opening angle of the flow of only 23 \degr (see Fig. 3). This value is very similar to those found in jets from low-mass Class I sources and CTTSs, which show opening angles between 20\degr and 42\degr (Hartigan et al. 2004; Davis et al. 2011)
2.2 The atomic jet component
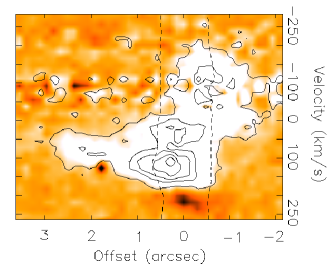
The hypothesis of an asymmetric jet in the eastern lobe able to dissociate the molecular H2 component can be tested by detecting ionic/atomic emission eastwards of IRS54. With this in mind, we asked for new VLT-ISAAC H-band observations at medium resolution. The slit was aligned along the H2 jet-like structure, i.e., PA=90\degr on the sky. The right panel of Fig. 1 shows the position-velocity diagram (PVD) of the [Fe ii] 1.644 m. The YSO continuum was removed in order to study the jet structure close to the driving source. As shown in the figure, a blue-shifted atomic jet is detected eastward of the source. In addition, the PVD shows the presence of two velocity components close to the source, the so-called high- and low-velocity components (HVC, LVC), with v-125 and v-25 . Analogous to low-mass Class I sources and CTTSs, the LVC is confined around the source position, while the HVC extends further away from the driving source (Garcia Lopez et al. 2008, 2010).
3 Accretion and ejection properties
From the Br emission line detected in our SINFONI spectra, it is possible to derive the accretion luminosity (Lacc) and mass accretion rate (). Using the relation between the luminosity of the Br line (L(Br )) and the accretion luminosity (Lacc) derived by Calvet et al. (2004), we found an accretion luminosity of Lacc0.64 L⊙. The luminosity of the Br line was measured from the integrated flux across the Br line in our cube (F=4.0810-14 erg s-1 cm-2) and corrected by a visual extinction of 30 mag. The accretion luminosity towards the source is very high, especially when compared with its bolometric luminosity of 0.78 L⊙. This results in a Lacc/Lbol value of 80%, consistent with a very young and active YSO.
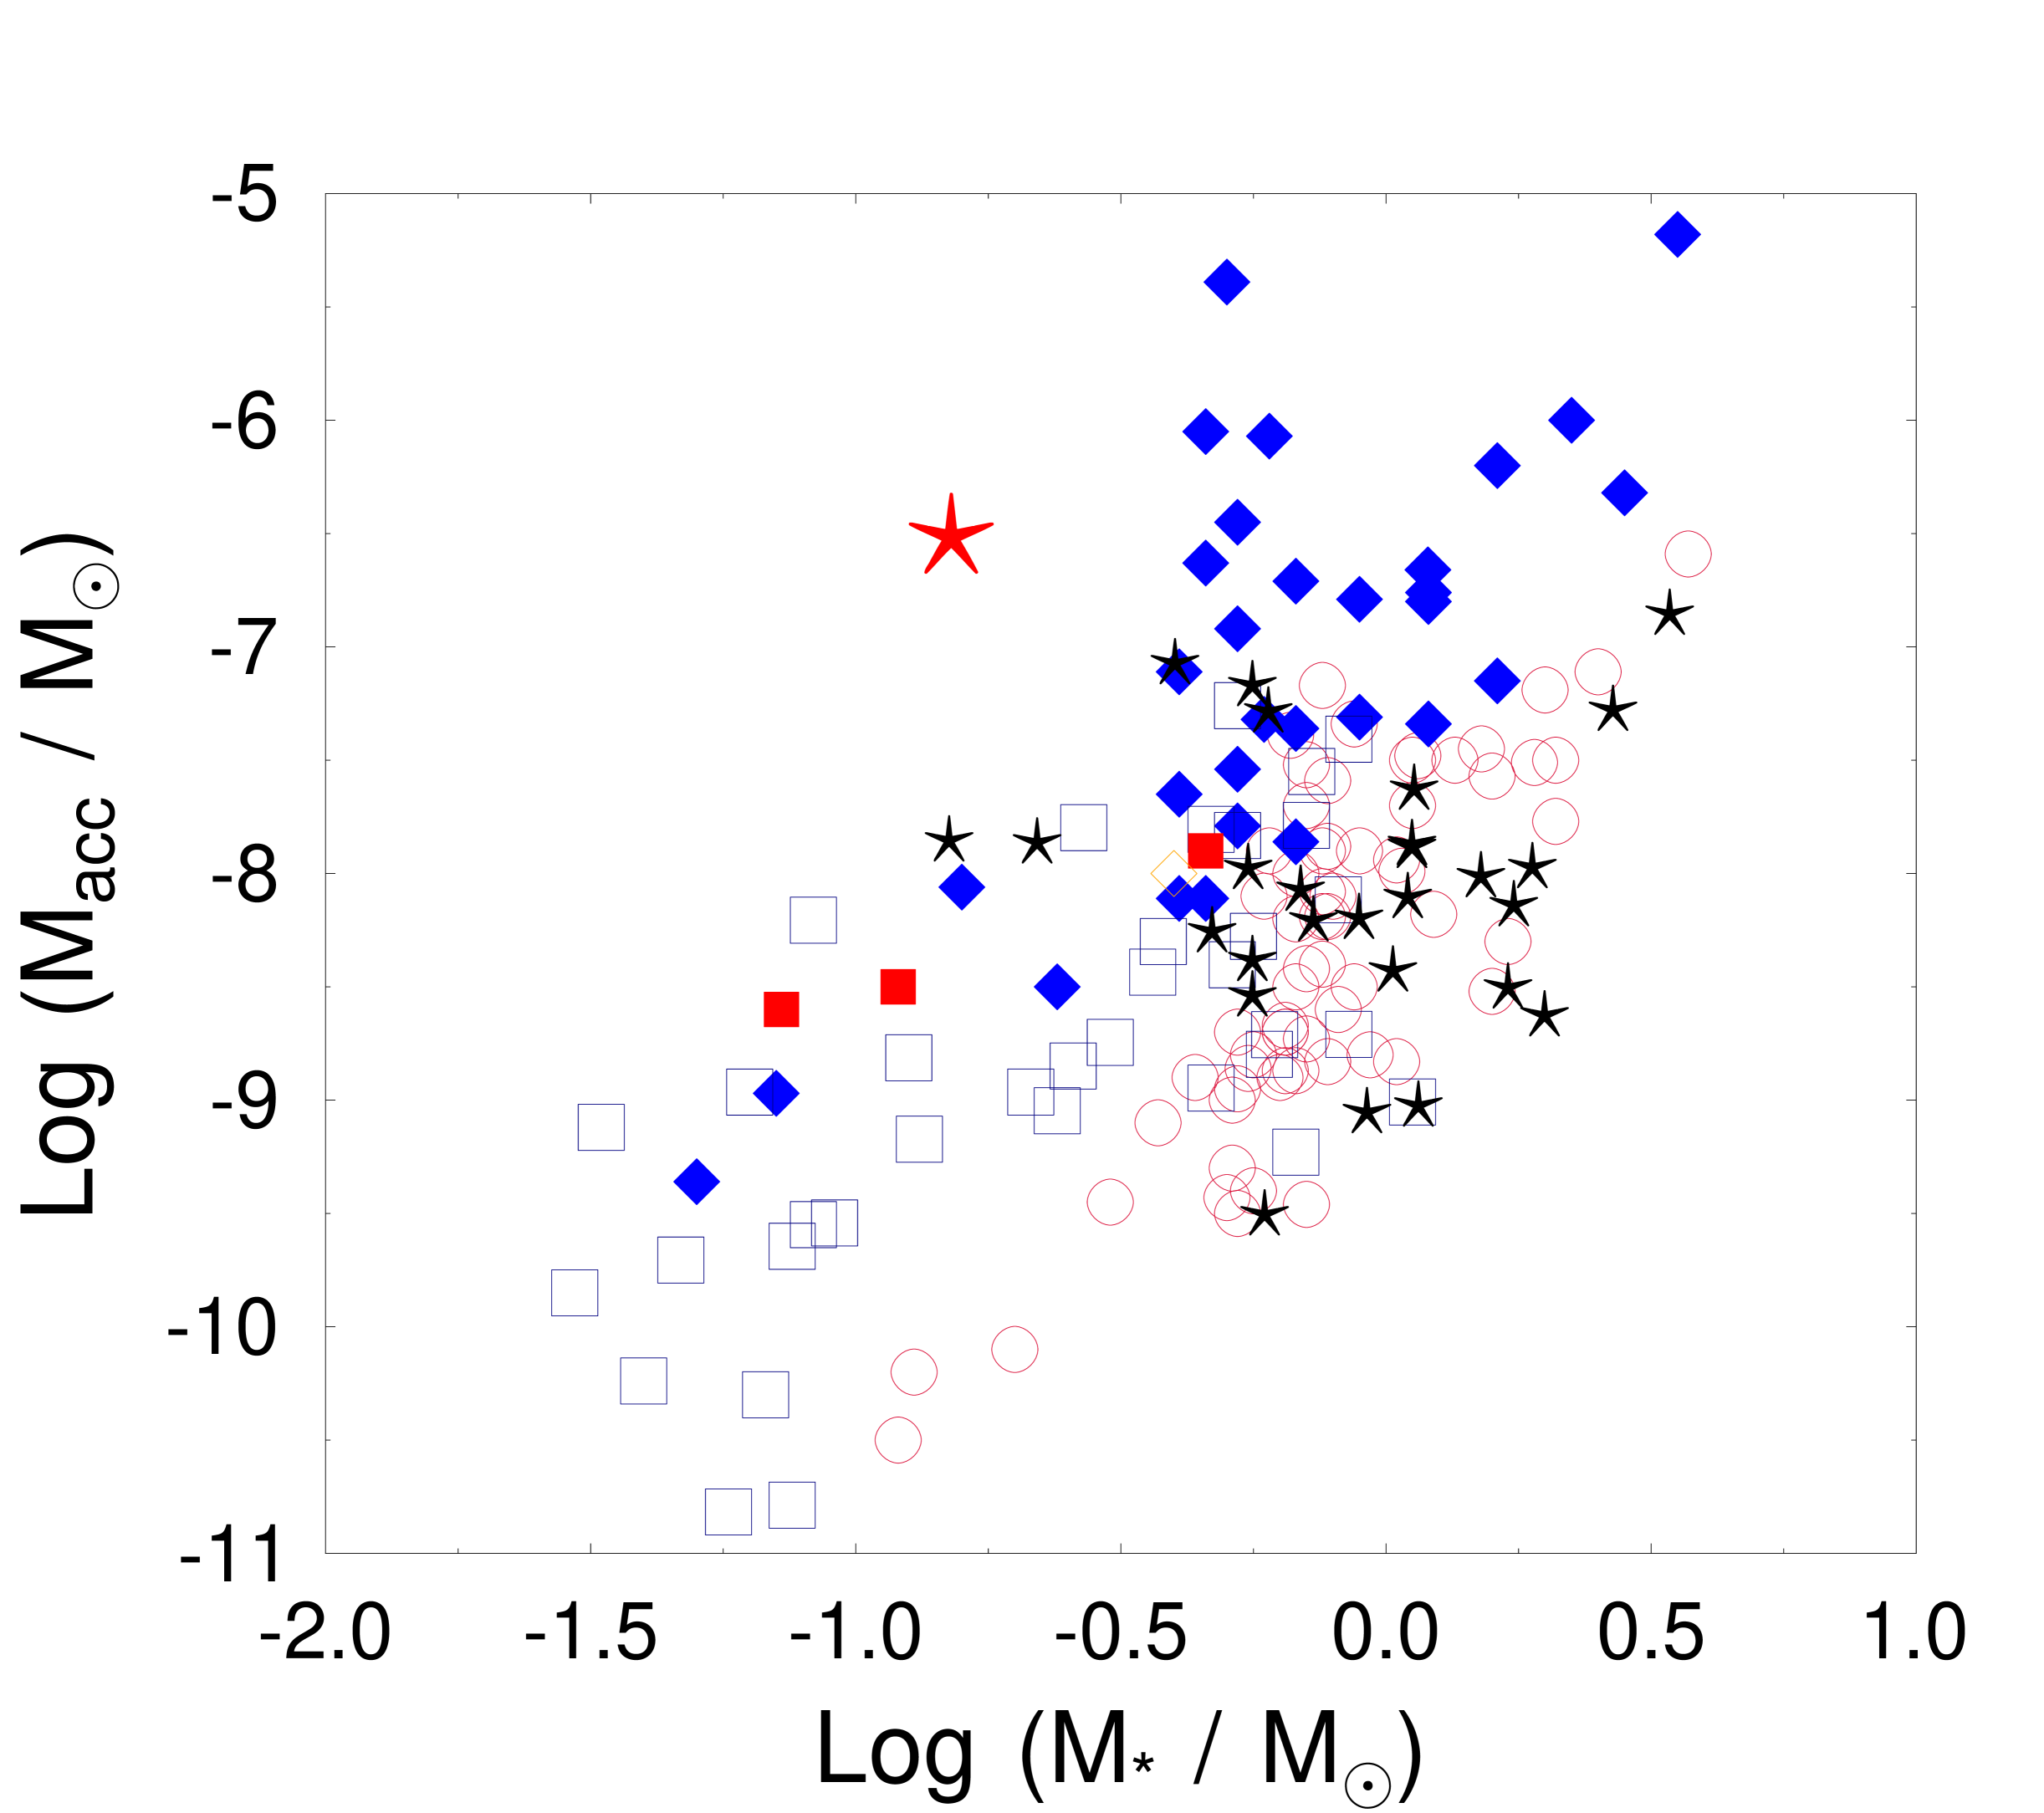
From the computed Lacc value, a mass accretion rate of 3.010-7 M⊙ yr-1 is inferred, using =(Lacc R∗ / G M∗)(1-R∗/Ri)-1 (with Ri =5 R∗, see Gullbring et al. 1998) and the stellar parameters from Garcia Lopez et al. (2013). Figure 4 shows (IRS54: big red star) as a function of the stellar mass. For comparison, the values derived by several authors for a large sample of Class II and I objects are also represented. The value of IRS54 is higher than those found in objects of roughly the same mass, pointing again to the young nature of this source.
In order to compare the value of IRS54 with the mass transported by the jet, we have computed the mass loss rate transported by the molecular (H2) and atomic ([Fe ii]) components. In order to derive the mass loss rate, the tangential velocity of the outflow must be known. Because the inclination angle of the jet is unknown and the small radial velocities suggest that the outflow is almost on the plane of the sky, we assume a lower limit to the jet velocity of 200 . This value corresponds to the FWZI of the H2 and [Fe ii] lines. The mass transported by the warm molecular component was then computed using an average H2 column density of N(H2)1.71017 cm-2 (Garcia Lopez et al. 2013) and following the expression =2 mHN(H2) A dvt/dlt (see, e.g., Davis et al. 2001, 2011). Here, A is the area of the emitting region, is the mean atomic weight, and dlt and dvt are the projected length and the tangential velocity. Finally, we have assumed A equal to the extent of the flow along the jet axis from position S to D (0\farcs5) multiplied by the width of the flow (i.e. the seeing). These assumptions result in a value of 1.610-10 M⊙ yr-1.
Following similar considerations and employing the expression = m(nH V)vt/lt (see Nisini et al. 2005), we have derived the mass transported by the atomic component. In addition to the parameters defined above, nH and V are the total density and the volume of the emitting region. The product of both quantities can be expressed as (nH V)= , where and are the radiative rates and fractional population of the upper level of the considered transition and is the ionisation fraction of the iron having a total abundance with respect to hydrogen of . To compute the fractional population, we have used an electron density value ne=18 000 cm-3 derived from the [Fe ii] 1.600/1.644 m line ratio (see, e.g., Garcia Lopez et al. 2008, for more details on the employed method). We have assumed that all the iron is ionised, and a total abundance equal to the solar one (Asplund et al. 2005). This is equivalent to consider no dust depletion and thus yields to a lower limit of 2.010-8 M⊙ yr-1. The derived value is roughly two orders of magnitude higher than that computed for the warm molecular component. Similar results have been also found in low-mass Class I sources (e.g., Davis et al. 2011), probably indicating that the atomic component is transporting most of the mass ejected by these sources. The computed and values are from two to three orders of magnitude lower than the and values derived for low-mass Class I sources using the same technique (Davis et al. 2011). However, it is worth noting that those sources are more massive than IRS54.
Finally, the and ratio is 0.1, in agreement with the predictions of MHD wind models.
4 Conclusions
We presented the first spatially resolved H2 (MHEL) and [Fe ii] (FEL) emission regions around IRS54, a Class I VLMS. Both the atomic and molecular emissions were detected down to the central source (within the first 50 AU). The H2 emission might be interpreted as coming from the interaction of a wide-angle wind with an outflow cavity and a molecular jet, while the [Fe ii] emission is clearly tracing an atomic blue-shifted jet eastward of IRS54. The derived Lacc and values for this source are high, especially when compared with sources of roughly the same mass. This strongly suggests that IRS54 is a young VLMS still accreting mass at a high rate. Although the mass loss rate computed for IRS54 is lower than in low-mass Class I sources, the outflow/jet morphology is very similar. In addition, we found that the / ratio is roughly 0.1, in agreement with MHD wind model predictions. Our results might then indicate that there is a smooth transition from low-mass to VLM jets and outflows.
References
- André et al. (2007) André, P., Belloche, A., Motte, F., & Peretto, N. 2007, A&A, 472, 519
- Antoniucci et al. (2008) Antoniucci, S., Nisini, B., Giannini, T., & Lorenzetti, D. 2008, A&A, 479, 503
- Asplund et al. (2005) Asplund, M., Grevesse, N., & Sauval, A. J. 2005, in Astronomical Society of the Pacific Conference Series, Vol. 336, Cosmic Abundances as Records of Stellar Evolution and Nucleosynthesis, ed. T. G. Barnes, III & F. N. Bash, 25–+
- Calvet et al. (2004) Calvet, N., Muzerolle, J., Briceño, C., et al. 2004, AJ, 128, 1294
- Caratti o Garatti et al. (2012) Caratti o Garatti, A., Garcia Lopez, R., Antoniucci, S., et al. 2012, A&A, 538, A64
- Davis et al. (2011) Davis, C. J., Cervantes, B., Nisini, B., et al. 2011, A&A, 528, A3
- Davis et al. (2001) Davis, C. J., Ray, T. P., Desroches, L., & Aspin, C. 2001, MNRAS, 326, 524
- Garcia Lopez et al. (2013) Garcia Lopez, R., Caratti o Garatti, A., Weigelt, G., Nisini, B., & Antoniucci, S. 2013, A&A, 552, L2
- Garcia Lopez et al. (2010) Garcia Lopez, R., Nisini, B., Eislöffel, J., et al. 2010, A&A, 511, A5
- Garcia Lopez et al. (2008) Garcia Lopez, R., Nisini, B., Giannini, T., et al. 2008, A&A, 487, 1019
- Gullbring et al. (1998) Gullbring, E., Hartmann, L., Briceno, C., & Calvet, N. 1998, ApJ, 492, 323
- Hartigan et al. (2004) Hartigan, P., Edwards, S., & Pierson, R. 2004, ApJ, 609, 261
- Joergens et al. (2012) Joergens, V., Kopytova, T., & Pohl, A. 2012, A&A, 548, A124
- Jørgensen et al. (2009) Jørgensen, J. K., van Dishoeck, E. F., Visser, R., et al. 2009, A&A, 507, 861
- Khanzadyan et al. (2004) Khanzadyan, T., Gredel, R., Smith, M. D., & Stanke, T. 2004, A&A, 426, 171
- Luhman (2012) Luhman, K. L. 2012, ARA&A, 50, 65
- Natta et al. (2006) Natta, A., Testi, L., & Randich, S. 2006, A&A, 452, 245
- Nisini et al. (2005) Nisini, B., Bacciotti, F., Giannini, T., et al. 2005, A&A, 441, 159 (N05)
- Phan-Bao et al. (2011) Phan-Bao, N., Lee, C.-F., Ho, P. T. P., & Tang, Y.-W. 2011, ApJ, 735, 14
- Phan-Bao et al. (2008) Phan-Bao, N., Riaz, B., Lee, C.-F., et al. 2008, ApJ, 689, L141
- van Kempen et al. (2009) van Kempen, T. A., van Dishoeck, E. F., Hogerheijde, M. R., & Güsten, R. 2009, A&A, 508, 259
- Whelan et al. (2005) Whelan, E. T., Ray, T. P., Bacciotti, F., et al. 2005, Nature, 435, 652
- Whelan et al. (2009) Whelan, E. T., Ray, T. P., Podio, L., Bacciotti, F., & Randich, S. 2009, ApJ, 706, 1054
- White & Basri (2003) White, R. J. & Basri, G. 2003, ApJ, 582, 1109
- White & Ghez (2001) White, R. J. & Ghez, A. M. 2001, ApJ, 556, 265
- White & Hillenbrand (2004) White, R. J. & Hillenbrand, L. A. 2004, ApJ, 616, 998
- Wouterloot et al. (2005) Wouterloot, J. G. A., Brand, J., & Henkel, C. 2005, A&A, 430, 549