Chemical Abundance Evidence of Enduring High Star Formation Rates in an Early Type Galaxy: High [Ca/Fe] in NGC 5128 Globular Clusters111This paper includes data gathered with the 6.5 meter Magellan Telescopes located at Las Campanas Observatory, Chile.
Abstract
We present [Fe/H], ages, and Ca abundances for an initial sample of 10 globular clusters in NGC 5128 obtained from high resolution, high signal-to-noise ratio echelle spectra of their integrated light. All abundances and ages are obtained using our original technique for high resolution integrated light abundance analysis of globular clusters. The clusters have a range in [Fe/H] between to . In this sample, the average [Ca/Fe] for clusters with [Fe/H] is 0.370.07, while the average [Ca/Fe] in our MW and M31 GC samples is 0.29 0.09 and 0.24 0.10, respectively. This may imply a more rapid chemical enrichment history for NGC 5128 than for either the Milky Way or M31.This sample provides the first quantitative picture of the chemical history of NGC 5128 that is directly comparable to what is available for the Milky Way. Data presented here were obtained with the MIKE echelle spectrograph on the Magellan Clay Telescope.
Subject headings:
galaxies: abundances— galaxies: elliptical and lenticular, cD— galaxies: individual (NGC5128) — galaxies: star clusters: general — galaxies: stellar content1. Introduction
For a full understanding of galaxy formation, galaxies of all Hubble types must be studied. In this regard, the formation history of NGC 5128 (Centaurus A) is especially important because it is the closest early type galaxy to the Milky Way (MW), and therefore can be observed in the greatest detail. Although it is the closest, the distance to NGC 5128 (3.8 Mpc, Harris et al. (2010)), makes it impossible to obtain spectra of its individual stars, let alone that required for detailed chemical abundance analysis.
With the development of our original technique for abundance analysis of integrated light (IL) spectra of globular clusters (GCs), we can now make significant advances in chemical evolution studies of distant massive galaxies. Because they are luminous and therefore observationally accessible to large distances, unresolved GCs can provide chemical enrichment and formation histories of other galaxies, just as they were originally used to learn about the formation of the Milky Way (e.g. Eggen et al., 1962; Searle & Zinn, 1978). Our technique has been developed and demonstrated on resolved GCs in the Milky Way and Large Magellanic Cloud (LMC) in Bernstein & McWilliam (2005), McWilliam & Bernstein (2008) (hereafter “MB08”),Cameron (2009), Colucci et al. (2011) (hereafter “C11”), Colucci et al. (2012) (hereafter “C12”), and Colucci & Bernstein (2012). These publications demonstrate that the IL analysis provides Fe abundances and [X/Fe] ratios accurate to 0.1 dex, as well as distinguishes ages for GCs with [Fe/H] of to and ages in the range of 0.05 to 12 Gyr. We also note the application of an independent, but similar technique by Larsen et al. (2012) to GCs in the Fornax dwarf spheroidal galaxy.
Using this method, we have now begun a study of the chemical composition of the GC system of NGC 5128. Here we present Fe abundances, ages, and Ca abundances of 10 GCs in our initial sample. Our complete sample will include approximately 20 GCs, to provide better statistics for galaxy to galaxy comparisons. In future papers we will present detailed abundances of an additional 20 elements in our complete sample of 20 GCs.
2. Targets, Observations and Reductions
For the targets observed prior to 2010, we chose GCs from the catalog of Peng et al. (2004a) that were more luminous than V18.5 mag, that are in relatively uncrowded regions, that are not projected onto the high surface brightness part of the NGC 5128 bulge, and that have a range in projected galactocentric distance from NGC 5128. For the targets observed after 2010, we also aimed to observe GCs with as wide a range in estimated metallicity and age as possible, using the additional metallicity and age estimates that became available in Beasley et al. (2008) and Woodley et al. (2010). While our sample is obviously not complete, our attempt to select GCs with a wide range in previously estimated [Fe/H], age, and projected galactocentric distance from NGC 5128 (Rgc) increases our chances of surveying the range of properties present in NGC 5128 GCs. The magnitudes, spatial information and previously measured properties are listed for all of the GCs in Table 1. We list both the names from Peng et al. (2004a) and those from the newer, homogenized catalog of Woodley et al. (2007). We use the GC names of Woodley et al. (2007) for the remainder of this work.
We obtained our spectra using the MIKE spectrograph (Bernstein et al., 2003) on the 6.5m Magellan Clay telescope. The data were taken over six observing runs from 2004-2012. All data were taken with a slit size of 1x5 arcsec, providing an instrumental resolution of 28,000 for the blue arm and 22,000 for the red arm. The wavelength coverage of the blue and red arms of MIKE are approximately 3350-5050 Å and 4800-9000 Å, respectively. Exposure times for this sample are between 517 hours for each GC and are listed in Table 1 along with the date each GC was observed. For all GCs, with the exception of GC0106, we only use exposures where the seeing was 1.0”; for GC0106 25% of the exposures were taken with seeing between 1.0”-1.3”. Signal-to-noise (SNR) estimates at 6040 Å are given in Table 1. Data were reduced with the MIKE Redux pipeline.222 http://www.ucolick.org/ xavier/IDL/index.html A heliocentric velocity correction was applied and final radial velocities () were measured with the IRAF task rvidlines. One dimensional, line of sight velocity dispersions () were measured using the IRAF task fxcor and red giant template stars that were observed with identical setups as the GCs. These measurements are discussed briefly in §4.
3. Abundance Analysis
Fe I and Ca I lines and line parameters were taken from our previous spectroscopic analyses ( \al@mb08, m31paper, paper4; \al@mb08, m31paper, paper4; \al@mb08, m31paper, paper4, and references therein). The abundances from the Fe I and Ca I lines that are included in our final analysis are listed in Table 2. As in all of our previous spectroscopic analyses, we use the ODFNEW and AODFNEW model stellar atmospheres from Kurucz333http://kurucz.harvard.edu/grids.html (Castelli & Kurucz, 2004). All abundances are calculated under the assumption of local thermodynamic equilibrium (LTE), and abundance ratios relative to the sun were calculated with the solar abundance values of Asplund et al. (2009).
Our IL abundance analysis methods are described in detail in MB08, C09, Cameron (2009), C11 and C12. Briefly, we create synthetic GC color magnitude diagrams (CMDs) using the Teramo isochrones (Pietrinferni et al., 2004, 2006) without convective overshooting, with extended asymptotic giant branch, enhanced lowtemperature opacities calculated according to Ferguson et al. (2005), and massloss parameter of =0.2. More discussion about the testing and choice of appropriate isochrones can be found in MB08, C11 and Colucci & Bernstein (2012).
To measure abundances, we perform a flux-weighted spectral synthesis for a 20 Å region around each line using our routine ILABUNDS (see \al@mb08,paper4; \al@mb08,paper4, ), which utilizes spectral synthesis routines from the 2010 version of MOOG (Sneden, 1973). We then find the abundance that produces the best matching synthetic spectra using a -minimization scheme, as described in C12. Complete synthesis of a large region allows for more accurate continuum placement and a more accurate appraisal of line blending then direct measurement of equivalent widths (EWs) by gaussian fitting. To supplement our select line list of Fe I and Ca I, we use a combination of VALD and Kurucz line lists; for 6300 Å these lists have been calibrated to both the Sun and Arcturus by Kirby et al. (2008). The final synthesized spectra were convolved with the measured for each GC. The final age and [Fe/H] solutions for each GC are identified as the range in synthetic CMD ages and [Fe/H] that produce the most self-consistent results using the 2040 individual Fe I lines measured in each cluster. The best solutions have the smallest statistical error (; the standard deviation of the mean abundance), and minimal dependence of Fe I abundance with line excitation potential (EP), wavelength (), and EW. Results for the NGC 5128 sample are given in Table 3.
For each GC there is a range in CMD ages that produce similarly self-consistent solutions. For older GCs this range is typically 1015 Gyr, and leads to a systematic uncertainty in [Fe/H] of 0.05 dex, which we denote . For GCs with a larger acceptable age range, the is correspondingly larger ( 0.1 dex). For the total uncertainty in [Fe/H] for each cluster (), we add the statistical error in the mean abundance () and the systematic age uncertainty in quadrature, all of which are listed in Table 3.


4. Results and Discussion
Final [Fe/H] abundances, ages and [Ca/Fe] abundances are reported in Table 3, along with our measured radial velocities (vr) and velocity dispersions (). All of the previous measurements of and vr listed in Table 1, which were obtained with lower resolution or lower SNR spectra, agree with our results to within 3 , with most agreeing to within 1 . We also note that differences in the observed velocity dispersions with respect to those of Taylor et al. (2010) could be attributed to aperture effects, the seeing during our observations, and their impact on the fraction of the light of the GC in the spectrograph slit; however quantification of these effects is not necessary for the abundance analysis, and therefore is beyond the scope of this work.
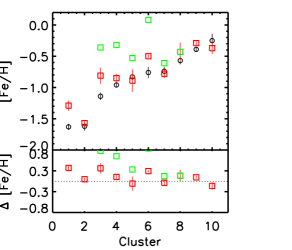
In Figure 1, we show our [Fe/H] and Ca results as a function of age. The [Fe/H] for our current sample ranges from to , which is well within the range exhibited by MW GCs (Harris, 1996). In the bottom panel of Figure 1, we compare the metallicity estimates of Beasley et al. (2008) and Woodley et al. (2010) to our [Fe/H] measurements, although we note that metallicities from low resolution line index techniques do not strictly measure [Fe/H]. Nevertheless, the comparison of spectroscopic metallicity scales is interesting because of the large samples that can be efficiently obtained at low spectral resolutions. Figure 1 shows that the [Z/H] of Woodley et al. (2010), which only cover the range [Fe/H] in this sample, are biased high by as much as 1.0 dex. The [M/H] of Beasley et al. (2008), which can be compared over the full [Fe/H] range of our sample, are more consistent with our results and have a scatter of 0.3 dex.
Nearly all of the GCs have ages that are consistent with an ancient population (10 Gyr), to within the uncertainties. In one case, GC0265, we measure an age of 2-5 Gyr. This GC has one previous age estimate by Woodley et al. (2010) of 8.5 0.1 Gyr. While the value of Woodley et al. (2010) is not consistent on an absolute age scale, it is consistent in the general sense that this GC has a younger age than a typical 10 Gyr ancient population. It is well known that blue horizontal branch (HB) stars can mimic the presence of truly young stars in IL. Therefore, in our analysis, we have additionally verified that it is not possible to obtain a better, more self-consistent solution for GC0265 with a synthetic CMD that is 10 Gyr, and has a very blue HB. This is important to test explicitly because the Teramo isochrones are parametrized such that they do not produce CMDs with blue HBs for [Fe/H]-0.7. Our technique for evaluating the influence of blue HB stars is described in Colucci et al. (2013, in prep) along with quantitative constraints of HB morphology in a large sample of unresolved GCs.
For the other 5 GCs that we have in common with Woodley et al. (2010), those authors measure intermediate ages for 3 of the GCs, while we find old ages, as stated above. In at least two of these cases our analysis is consistent with these GCs hosting a significant number of blue HB stars, which would cause the young age measurements in the Woodley et al. (2010) analysis. An interesting test would be to compare the GALEX FUV measurements for these GCs to confirm our identification of blue HB content as opposed to truly young populations. Rey et al. (2009) used GALEX observations of NGC 5128 GCs to infer that there is indeed a significant intermediate age GC population in NGC 5128, but did not include the full catalog of individual GCs, so we unfortunately cannot cross check results for our sample of GCs at this time.
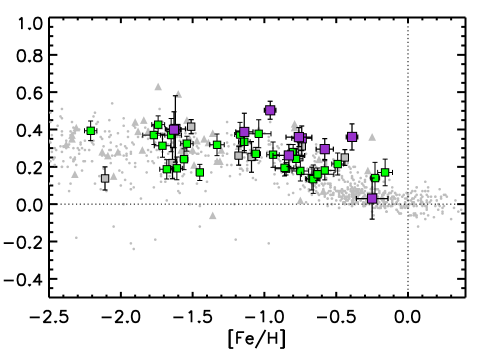
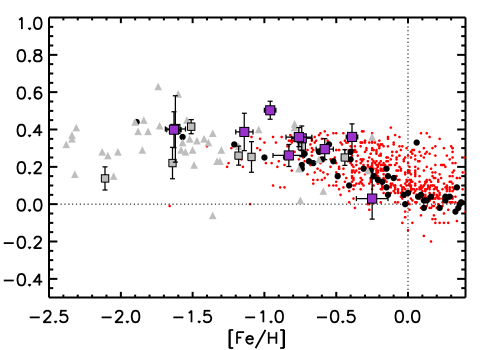
As seen in Figure 2, nearly all of the GCs in our initial sample are enhanced in [Ca/Fe] relative to the Sun. [Ca/Fe] is our best proxy for [/Fe], because [Mg/Fe] and [O/Fe] suffer from intracluster abundance variations (Colucci et al., 2009) and because Si and Ti are more difficult to measure. We will present Si and Ti abundances for a subset of the GCs in an upcoming paper. We emphasize that this is the first time that Figure 2, with precise abundances that are directly comparable to MW abundances, can be made over a wide range of [Fe/H] for the oldest stellar populations in any early type galaxy. For comparison, we also show the GC IL abundance results for M31 GCs from Colucci et al. (2013), which closely track the abundances in MW disk stars and thus show similar chemical enrichment histories in large spirals in the Local Group. Visual inspection of the top panel of Figure 2 shows that for the NGC 5128 GCs, the mean [Ca/Fe] in GCs with [Fe/H] appears higher than for the GCs in M31 at the same [Fe/H], and higher than MW GCs and disk stars. Because our initial sample is small, we do not perform a quantitative statistical test to compare the different galaxies in Figure 2; this test will be performed with our larger sample of 20 total GCs in an upcoming paper. For the purposes of this paper, we calculate a simple mean of the NGC 5128 sample (for [Fe/H]), which gives [Ca/Fe]=, where the uncertainty is the standard deviation of the mean. This is indeed higher than the average values for the MW and M31 GC samples in the same metallicity range, which are 0.09 and 0.10, respectively. This may imply that NGC 5128 experienced a more prolonged high star formation rate era, with faster chemical enrichment, than either M31 or the MW. If the knee in [Ca/Fe] is at higher [Fe/H] than the MW disk, it more closely resembles recent results for MW bulge stars by Gonzalez et al. (2011) and Bensby et al. (2013), which would imply similar formation histories for spheroids. We compare the GC abundances to the bulge samples in the bottom panel of Figure 2, where it can be seen that there is more overlap with the GCs in [Ca/Fe] at high [Fe/H] for the bulge stars than for the disk stars in the top panel.
Our initial sample of GC abundance measurements in NGC 5128 support a scenario where most of the halo formed at very early times, with rapid chemical enrichment reaching to high overall [Fe/H], such as that discussed in Rejkuba et al. (2011). From deep HST/ACS photometry of halo stars, Rejkuba et al. (2011) find that the observed CMDs are most consistent with a population where 70-80% of the stars are ancient, reach super-solar [Fe/H], and are -enhanced, which is similar to our results for GCs. Rejkuba et al. (2011) also find that their data suggest that the younger population in the halo formed in a second burst of star formation 2-4 Gyr ago. This is interesting in the context of our GC measurements, because we find one GC with a younger age that is consistent with the age of the proposed burst. In addition, this GC has an enhanced [Ca/Fe] ratio, which is more consistent with a burst of star formation than with extended star formation. It’s also worth noting that [O/H] measurements in the halo planetary nebulae of NGC 5128 also support a recent burst of star formation that formed stars reaching to high -enhancement (Walsh et al., 2012).
Finally we note that higher [/Fe] in NGC 5128 than in the MW is not the same conclusion reached by groups using low resolution spectra; Peng et al. (2004b) estimated that NGC 5128 GCs have similar [/Fe] to the MW, and both Beasley et al. (2008) and Woodley et al. (2010) concluded that the mean [/Fe] in NGC 5128 GCs is lower than the MW. This is not surprising given that [/Fe] estimates from line indexes have large uncertainties and are plagued by systematics.
5. Summary
We have measured ages and abundances for Fe and Ca for an initial sample of 10 GCs in NGC 5128 using an original technique for detailed abundance analysis of high resolution integrated light spectra. We find that the majority of GCs in the sample have old ages (10 Gyr), with only one GC in the initial sample showing an intermediate age of 2-5 Gyr. The GCs have a range in [Fe/H] between to . The average [Ca/Fe] for GCs with [Fe/H] is higher than for M31 GCs or MW GCs and disk stars, which may imply a more prolonged high epoch of high star formation rate in NGC 5128 than for either the MW or M31. Analysis of an additional 20 elements in our full sample of 20 GCs will be presented in an upcoming paper.
References
- Asplund et al. (2009) Asplund, M., Grevesse, N., Sauval, A. J., & Scott, P. 2009, ARA&A, 47, 481
- Beasley et al. (2008) Beasley, M. A., Bridges, T., Peng, E., Harris, W. E., Harris, G. L. H., Forbes, D. A., & Mackie, G. 2008, MNRAS, 386, 1443
- Bensby et al. (2013) Bensby, T., et al. 2013, A&A, 549, A147
- Bernstein et al. (2003) Bernstein, R., Shectman, S. A., Gunnels, S. M., Mochnacki, S., & Athey, A. E. 2003, in Society of Photo-Optical Instrumentation Engineers (SPIE) Conference Series, Vol. 4841, Society of Photo-Optical Instrumentation Engineers (SPIE) Conference Series, ed. M. Iye & A. F. M. Moorwood, 1694–1704
- Bernstein & McWilliam (2005) Bernstein, R. A., & McWilliam, A. 2005, in Resolved Stellar Populations, ed. D. Valls-Gabaud & M. Chavez, Astronomical Society of the Pacific Conference Series
- Cameron (2009) Cameron, S. A. 2009, PhD thesis, University of Michigan
- Castelli & Kurucz (2004) Castelli, F., & Kurucz, R. L. 2004, ArXiv Astrophysics e-prints
- Colucci & Bernstein (2012) Colucci, J. E., & Bernstein, R. A. 2012, ApJ, 749, 124
- Colucci et al. (2009) Colucci, J. E., Bernstein, R. A., Cameron, S., McWilliam, A., & Cohen, J. G. 2009, ApJ, 704, 385
- Colucci et al. (2011) Colucci, J. E., Bernstein, R. A., Cameron, S. A., & McWilliam, A. 2011, ApJ, 735, 55 (C11)
- Colucci et al. (2012) —. 2012, ApJ, 746, 29 (C12)
- Colucci et al. (2013) Colucci, J. E., Bernstein, R. A., McWilliam, A., & Cohen, J. G. 2013, Mem. Soc. Astron. Italiana, 84, 50
- Eggen et al. (1962) Eggen, O. J., Lynden-Bell, D., & Sandage, A. R. 1962, ApJ, 136, 748
- Ferguson et al. (2005) Ferguson, J. W., Alexander, D. R., Allard, F., Barman, T., Bodnarik, J. G., Hauschildt, P. H., Heffner-Wong, A., & Tamanai, A. 2005, ApJ, 623, 585
- Gonzalez et al. (2011) Gonzalez, O. A., Rejkuba, M., Zoccali, M., et al. 2011, A&A, 530, A54
- Harris et al. (2010) Harris, G. L. H., Rejkuba, M., & Harris, W. E. 2010, PASA, 27, 457
- Harris (1996) Harris, W. E. 1996, AJ, 112, 1487
- Kirby et al. (2008) Kirby, E. N., Guhathakurta, P., & Sneden, C. 2008, ApJ, 682, 1217
- Larsen et al. (2012) Larsen, S. S., Brodie, J. P., & Strader, J. 2012, A&A, 546, A53
- McWilliam & Bernstein (2008) McWilliam, A., & Bernstein, R. A. 2008, ApJ, 684, 326 (MB08)
- Peng et al. (2004a) Peng, E. W., Ford, H. C., & Freeman, K. C. 2004a, ApJS, 150, 367
- Peng et al. (2004b) —. 2004b, ApJ, 602, 705
- Pietrinferni et al. (2004) Pietrinferni, A., Cassisi, S., Salaris, M., & Castelli, F. 2004, ApJ, 612, 168
- Pietrinferni et al. (2006) —. 2006, ApJ, 642, 797
- Pritzl et al. (2005) Pritzl, B. J., Venn, K. A., & Irwin, M. 2005, AJ, 130, 2140
- Rejkuba et al. (2011) Rejkuba, M., Harris, W. E., Greggio, L., & Harris, G. L. H. 2011, A&A, 526, A123
- Rey et al. (2009) Rey, S.-C., et al. 2009, ApJ, 700, L11
- Searle & Zinn (1978) Searle, L., & Zinn, R. 1978, ApJ, 225, 357
- Sneden (1973) Sneden, C. 1973, ApJ, 184, 839
- Taylor et al. (2010) Taylor, M. A., Puzia, T. H., Harris, G. L., Harris, W. E., Kissler-Patig, M., & Hilker, M. 2010, ApJ, 712, 1191
- Venn et al. (2004) Venn, K. A., Irwin, M., Shetrone, M. D., Tout, C. A., Hill, V., & Tolstoy, E. 2004, AJ, 128, 1177
- Walsh et al. (2012) Walsh, J. R., Jacoby, G. H., Peletier, R. F., & Walton, N. A. 2012, A&A, 544, A70
- Woodley et al. (2007) Woodley, K. A., Harris, W. E., Beasley, M. A., Peng, E. W., Bridges, T. J., Forbes, D. A., & Harris, G. L. H. 2007, AJ, 134, 494
- Woodley et al. (2010) Woodley, K. A., Harris, W. E., Puzia, T. H., Gómez, M., Harris, G. L. H., & Geisler, D. 2010, ApJ, 708, 1335
| Name | Name | RA | Dec | V | [M/H]a | [Z/H]b | [/Fe]b | vr | vσc | Dated | T | SNR | |
|---|---|---|---|---|---|---|---|---|---|---|---|---|---|
| P04 | W07 | (J2000) | (J2000) | (kpc) | (km/s) | (km/s) | (h) | (6040 Å) | |||||
| HGHH-41 | GC0040 | 13:24:39.0 | -43:20:06.4 | 18.59 | 23.1 | 0.37 | 3631 | 13.71.3 | 05May | 16.6 | 81 | ||
| HGHH-29 | GC0041 | 13:24:40.4 | -43:18:05.3 | 18.15 | 21.0 | 0.29 | 7261 | 17.61.8 | 04Jan | 9.8 | 64 | ||
| HGHH-31 | GC0086 | 13:24:57.4 | -43:01:08.1 | 18.38 | 6.1 | 0.50 | 0.08 | 0.07 | 69018 | 11Apr | 12.0 | 74 | |
| HGHH-4 | GC0106 | 13:25:01.8 | -43:09:25.4 | 18.04 | 10.5 | 1.57 | 68916 | 04Jun | 15.0 | 73 | |||
| HGHH-G342 | GC0124 | 13:25:05.8 | -42:59:00.6 | 18.18 | 5.0 | 0.43 | 0.43 | 0.25 | 55321 | 12Feb | 11.5 | 66 | |
| HGHH-44 | GC0227 | 13:25:31.7 | -43:19:22.6 | 18.69 | 20.2 | 1.29 | 5051 | 13.61.2 | 11Apr | 14.0 | 68 | ||
| HGHH-17 | GC0265 | 13:25:39.7 | -42:55:59.2 | 17.63 | 6.2 | 0.78 | 0.61 | 0.08 | 7822 | 20.82.9 | 04Jan | 10.9 | 80 |
| 05May | |||||||||||||
| HGHH-G370 | GC0277 | 13:25:42.3 | -42:59:17.0 | 18.39 | 3.6 | 0.81 | 0.36 | 0.07 | 50734 | 12May | 6.5 | 38 | |
| HGHH-19 | GC0282 | 13:25:43.4 | -43:07:22.8 | 18.12 | 7.6 | 0.89 | 0.53 | 0.25 | 63210 | 12May | 6.2 | 69 | |
| HGHH-7 | GC0365 | 13:26:05.4 | -42:56:32.4 | 17.17 | 9.2 | 0.85 | 0.32 | 0.01 | 5951 | 23.72.4 | 11Apr | 5.0 | 71 |
| Abundance | |||||||||||||
|---|---|---|---|---|---|---|---|---|---|---|---|---|---|
| Species | EP | log gf | GC0040 | GC0041 | GC0086 | GC0106 | GC0124 | GC0227 | GC0265 | GC0277 | GC0282 | GC0365 | |
| Fe I | 5497.526 | 1.010 | -2.849 | 7.12 | 7.31 | 6.50 | 6.41 | ||||||
| Fe I | 5501.477 | 0.958 | -3.047 | 7.22 | 6.32 | 6.93 | 5.51 | 6.31 | 6.94 | 6.39 | |||
| Fe I | 5506.791 | 0.990 | -2.797 | 6.52 | 6.73 | 5.81 | 6.70 | 6.31 | 6.64 | 6.69 | |||
| Fe I | 5569.631 | 3.417 | -0.486 | 7.22 | 6.72 | 6.70 | 6.74 | ||||||
| Fe I | 5576.099 | 3.430 | -0.900 | 6.91 | 6.82 | 7.23 | 6.01 | 6.74 | 6.79 | ||||
| Ca I | 6166.440 | 2.520 | -1.142 | 6.54 | 6.13 | 5.94 | 5.65 | 5.90 | |||||
| Ca I | 6169.044 | 2.520 | -0.797 | 6.54 | 5.83 | 6.04 | 5.12 | 5.62 | 5.75 | 5.70 | |||
| Ca I | 6439.083 | 2.526 | 0.390 | 6.24 | 5.93 | 4.87 | 5.84 | 4.72 | 5.92 | 5.82 | 5.75 | 5.70 | |
| Name | Age | [Fe/H] | NFe | [Ca/Fe] | NCa | v | |||||||
|---|---|---|---|---|---|---|---|---|---|---|---|---|---|
| (Gyrs) | (km s-1) | (km s-1) | |||||||||||
| GC0040 | 7-15 | 0.25 | 17 | 0.20 | 0.05 | 0.10 | 0.11 | S | 0.03 | 4 | 0.11 | 12.50.24 | 363.30.31 |
| GC0041 | 10-15 | 0.39 | 22 | 0.16 | 0.03 | 0.03 | 0.04 | A | 0.36 | 9 | 0.07 | 16.80.44 | 725.10.24 |
| GC0086 | 7-15 | 0.76 | 33 | 0.18 | 0.03 | 0.09 | 0.09 | A | 0.36 | 9 | 0.05 | 17.51.09 | 686.81.52 |
| GC0106 | 5-15 | 1.62 | 21 | 0.18 | 0.04 | 0.06 | 0.07 | A | 0.40 | 3 | 0.18 | 14.00.46 | 708.30.35 |
| GC0124 | 10-13 | 0.57 | 31 | 0.22 | 0.04 | 0.04 | 0.06 | A | 0.30 | 8 | 0.06 | 14.70.35 | 523.10.89 |
| GC0227 | 10-15 | 1.63 | 30 | 0.25 | 0.05 | 0.05 | 0.05 | A | 0.40 | 7 | 0.10 | 10.20.79 | 501.60.66 |
| GC0265 | 2-5 | 0.74 | 26 | 0.14 | 0.03 | 0.06 | 0.07 | A | 0.35 | 6 | 0.07 | 19.10.28 | 783.70.38 |
| GC0277 | 10-15 | 1.14 | 16 | 0.04 | 0.14 | 0.04 | 0.06 | A | 0.39 | 6 | 0.10 | 15.30.77 | 510.00.97 |
| GC0282 | 7-15 | 0.83 | 37 | 0.23 | 0.04 | 0.10 | 0.11 | S | 0.26 | 11 | 0.06 | 14.50.34 | 618.30.63 |
| GC0365 | 5-13 | 0.96 | 31 | 0.17 | 0.03 | 0.02 | 0.04 | A | 0.50 | 9 | 0.05 | 20.91.28 | 597.40.64 |