Insights Into Quantitative Biology: analysis of cellular adaptation
Abstract
In the last years many powerful techniques have emerged to measure protein interactions as well as gene expression. Many progresses have been done since the introduction of these techniques but not toward quantitative analysis of data. In this paper we show how to study cellular adaptation and how to detect cellular subpopulations. Moreover we go deeper in analyzing signal transduction pathways dynamics.
keywords:
Real Time PCR , Signal transduction pathways dynamics , Cellular subpopulations1 Introduction
To study protein interaction innovative technique are available as isothermal titration calorimetry (ITC), differential scanning calorimetry (DSC) and surface plasmon resonance (SPR). Although western blot remains the more useful method to access protein levels in the cell. Consider that although many powerful and sensitive techniques we have, at the end usually we reduce to express the results with “arbitrary units” making very difficult for example to compare articles. Moreover if we want to investigate the reaction to a stimulus, in the data analysis process we should consider some parameters: Michaelis-Menten constant, antibody affinity and signal transduction pathways amplification. In this paper we show how to study cellular adaptation taking into account all these parameters.
At the present days in many laboratories it is also possible to get a quantitative analysis on gene expression using Real Time PCR. Real Time PCR permit to compare different articles, moreover its sensitivity is very high but we can not easily identify small cellular subpopulations. Droplet Digital PCR solves the problem by single events amplification. However in this article we are going to show that it can be possible to detect a subpopulation also using Real Time PCR and a small amount of cDNA.
Currently the state of art in biological studies is to just indicate trends (obtained with quantitative methods of course) with no mention to any attempt to quantify cellular adaptation or evolution. Nor it is contemplate the option that some tissues are themselves heterogeneous populations (as in the case of muscles), in other cases cells react in different ways to an injury. Our purpose is to consider all these tasks to give a quantitative analysis using existing biological techniques.
2 Quantifying cellular adaptation
Since the pioneering work of Michaelis and Menten [10], the understanding of enzyme kinetics gained an increasing interest from the community. Recent advances in room-temperature single-molecule fluorescence studies have allowed very precise measurements [2]. On the other hand, peptide arrays resulted to be a key technology for deciphering enzyme function [11]. Quantitative analysis of enzyme kinetics have been developed by Se-Hui Jung [7] using fluorescence-conjugated peptide arrays, a surface concentration-based assay with solid phase. This assay was successfully applied for calculating the Michaelis-Menten constant (), defined as the substrate concentration at which the enzyme works at the half of its maximal velocity. In addition, in the last years, many powerful techniques have emerged to study protein interactions along with typical parameters involved in these processes. Isothermal Titration Calorimetry (ITC) is the gold standard for measuring binding constants (), reaction stoichiometry (), enthalpy () and entropy (), Differential Scanning Calorimetry (DSC) is designed to study thermal stability and finally Surface Plasmon Resonance (SPR) allows the determination of concentration and binding affinity [3]. These techniques could also be applied to antibodies [9, 8].
In order to investigate the reaction to a stimulus, Western Blot is considered the more useful method to access protein concentration. However, in the data analysis process usually it is not taken into account that the relative abundance of an enzyme could affect its kinetic properties.
In a typical situation the variation of concentration of some enzymes with respect to control is considered to study a particular aspect, e.g. metabolic adaptation and degradation systems. We argue that in some cases it is not possible to coherently interpret the results considering only enzymes variations without including in the analysis the relation between them and the enzymes kinetic properties, in particular their Michaelis-Menten constant.
We are going to show that the increment of an enzyme is lower the higher is its (remember that an high corresponds to a low-efficiency of the enzyme, see also Fig. 1). Thus we can observe no significant change in the concentration of a particular enzyme if its is very low.
If we look for example at glycolytic metabolism, it is possible to observe no variation in glyceraldehyde 3-phosphate dehydrogenase (GAPDH) concentration while triose-phosphate isomerase (TPI) increment is significant. This could be due to the very low of GAPDH with respect to the TPI one. Accordingly GAPDH can be considered an “housekeeping” enzyme.
Fig. 1 shows the Michaelis-Menten curves of different enzymes and , respectively a slow and a fast enzyme.
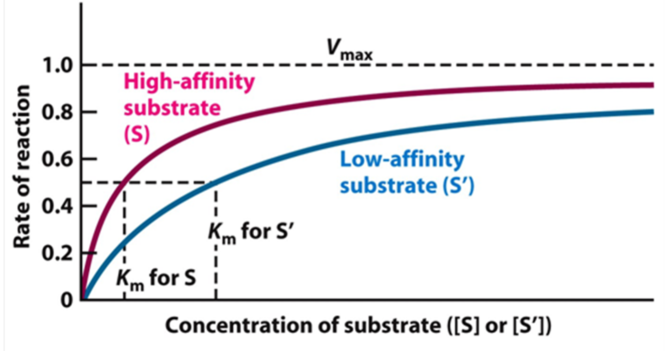
We want to show that (for example when a metabolic alteration occurs inside the cell, since an higher ATP concentration is required) the concentration of an enzyme with an high (less efficient) varies more than the concentration of a more efficient enzyme .
The enzyme rate-substrate concentration relationship reported in 1 refers to a single enzyme. Although we are interested in cellular adaptation in terms of variations in enzymes concentration. We know that the velocity of conversion of substrates into products reflects the probability to match the substrate inside the cell
| (1) |
with the copies of a single enzyme. Imagine to treat a cell with a drug that inhibits glucose uptake (e. g. glucocorticoids). In this case there is less glucose in the cytoplasm so that the cell reacts enhancing the production of glycolitic enzymes in order to increase the probability to match their substrates. Focus on two enzymes and following the Michaelis-Menten kinetics and assume for simplicity the number of these two enzymes at time before the treatment to be . After the treatment at time we have and and according to Eq. (1) we have
| (2) |
It is realistic to suppose that they have different kinetics properties and in particular suppose to be more efficient than
| (3) |
We are considering the alteration of a pathway with both the enzymes involved in this specific pathway, we can say that
| (4) |
and from Eqs. (2) and (3) we finally get
| (5) |
We have shown that the increment of an enzyme with an high is lower than the increase in a low-efficiency enzyme.
But thinking about western blots another parameter to consider is the antibody affinity for the target enzyme. Antibody affinity for the ligand can be expressed in terms of the association constant as:
| (6) |
where and denote respectively the antibody and the ligand concentrations, while denotes the concentration of the antibody bind to its ligand. The enzyme concentration we observe with western blot analysis is related to the real concentration through this formula:
| (7) |
To compare the expression of an enzyme between control and treated samples, it is not necessary to worry about . However, if we mind to compare the modifications of different enzymes we have to consider antibody affinity. Combining the two parameters ( and ) we obtain a more realistic indicator of adaptation can be
| (8) |
where and label two different enzymes of the pathway under consideration. Finally, if we are studying a certain signal transduction pathways component, we should take into account signal amplification too. Signal amplification is not a small phenomenon. On the contrary, one molecule leads to the activation of .
3 Game theory and signal transduction pathways dynamics
Signal transduction pathways recover a crucial role in cellular processes: they represent a connection between environmental conditions and cellular reactions. It is well known that signals are transduced from the cell surface to the cell nucleus by a series of protein-protein interactions, phosphorylation reactions. Every signal transduction pathway is composed by one receptor and some kinases that bring the environmental signal to the nucleus. Usually, when the ligand binds the receptor, it activates a kinase by prosphorylation, the signal travel through the kinase and then the kinase activates the next one in the chain. Different pathways are linked to create biological networks. In some networks a single protein is linked to many others, as for Akt in Fig. 2. Nevertheless it is improbable for a protein to be optimized to interact with so many other proteins of almost the same dimensions.
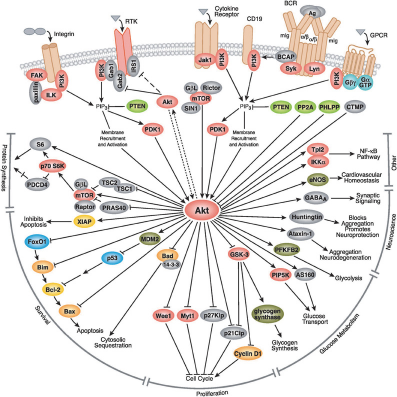
We can try to explain this considering inhibitions to be indirect inhibitions. Indeed signal amplification leads to molecules per cell, leaving no space for the amplification of a second pathway not-related (with no links) to the first as cells dimension indicates (a cell can contain about proteins). Hence it can not be active more non-related pathways per time. This suggests that probably a tissue is composed by a snap of an heterogeneous population. In this scenario it can also be possible to calculate the duration of a single pathway activation knowing the lifetime of its components. In [1] is shown how the formalism of game theory can be used to characterise biological cascades and gene regulation. In this paper we propose game theory as a tool for studying signal transduction pathways. Indeed we introduce the replicator dynamics differential equation used in evolutionary game theory.
| (9) |
where is the strategy adopted by player and is the utility (or the fitness), while is the average population fitness.
The replicator dynamics equation allows to calculate the population growing rate. In our case
| (10) |
where is the Michaelis-Menten constant of the kinase, and is the amplification factor so that, when a signal arrives being a ligand, it causes for example the activation and amplification of different Akt downstream kinases witch fight to reach their targets. This competition for the space indirectly inhibits the activation of other pathway and it is responsible for the modulation in the cellular response.
4 Real Time PCR to detect cellular subpopulations
Many progresses have been done since the introduction of Polymerase Chain Reaction (PCR) [5, 4]. Microfluidics allows Real Time PCR [12] which is quantitative in opposition to classical PCR. The last innovation in this field is the Droplet Digital [6].
In this Section we suggest an innovative application of Real Time PCR in detecting cellular subpopulations in our sample. Some tissues are themselves heterogeneous populations (as in the case of muscles), in other cases cells react in different ways to an injury. Think about images for quantitative immunohistochemistry: they do not represent an homogeneous pattern.
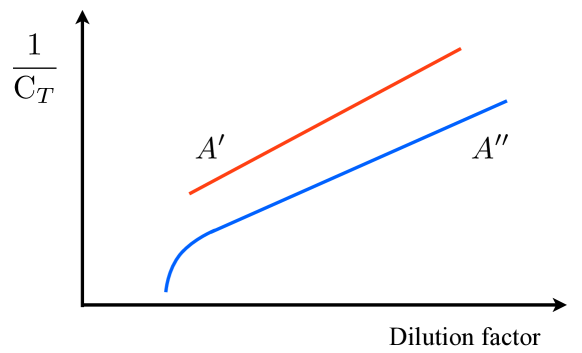
This application of Real Time PCR can be useful overall for acute phase studies. Suppose to amplify one gene of your control and treated sample and to obtain an induction of the ubiquitin ligases and an induction of PGC-1alpha (oxidative metabolism regulator). A possible interpretation of this data could be that some cells are trying to adapt to the new condition while others are dying. Otherwise imagine to obtain no significant increment. At this point one can think that we need to increase the number of samples or that this gene does not change under these conditions. We can try to solve the question with no more samples nor cDNA! We can make serial dilutions of cDNA and if a cut-off appears with a nonlinear relationship, then we can hypothesize the presence of a subpopulation in your sample. Indeed, diluting cDNA we expect to find a progressive decrease in cDNA concentration (above sensibility threshold), depending on the amplification probability inside the well (sample in Fig. 3). But if there is a subpopulation inside we also have to consider the probability to pipetting the fragments to execute the Real Time PCR experiment (sample in Fig. 3).
References
- [1] Chafika Chettaoui, Franck Delaplace, Pierre Lescanne, René Vestergaard, et al. Rewriting game theory as a foundation for state-based models of gene regulation. In Computational Methods in Systems Biology, pages 257–270. Springer, 2006.
- [2] Brian P English, Wei Min, Antoine M van Oijen, Kang Taek Lee, Guobin Luo, Hongye Sun, Binny J Cherayil, SC Kou, and X Sunney Xie. Ever-fluctuating single enzyme molecules: Michaelis-menten equation revisited. Nature Chemical Biology, 2(2):87–94, 2005.
- [3] Claudia Hahnefeld, Stephan Drewianka, and Friedrich W Herberg. Determination of kinetic data using surface plasmon resonance biosensors. In Molecular diagnosis of infectious diseases, pages 299–320. Springer, 2004.
- [4] Christian A Heid, Junko Stevens, Kenneth J Livak, and P Mickey Williams. Real time quantitative pcr. Genome research, 6(10):986–994, 1996.
- [5] Russell Higuchi, Carita Fockler, Gavin Dollinger, and Robert Watson. Kinetic pcr analysis: real-time monitoring of dna amplification reactions. Biotechnology, 11:1026–1030, 1993.
- [6] Benjamin J Hindson, Kevin D Ness, Donald A Masquelier, Phillip Belgrader, Nicholas J Heredia, Anthony J Makarewicz, Isaac J Bright, Michael Y Lucero, Amy L Hiddessen, Tina C Legler, et al. High-throughput droplet digital pcr system for absolute quantitation of dna copy number. Analytical chemistry, 83(22):8604–8610, 2011.
- [7] Se-Hui Jung, Deok-Hoon Kong, Seoung-Woo Park, Young-Myeong Kim, and Kwon-Soo Ha. Quantitative kinetics of proteolytic enzymes determined by a surface concentration-based assay using peptide arrays. Analyst, 137(16):3814–3820, 2012.
- [8] Yasufumi Kikuchi, Shinsuke Uno, Masahiko Nanami, Yasushi Yoshimura, Shin-ichiro Iida, Naoshi Fukushima, and Masayuki Tsuchiya. Determination of concentration and binding affinity of antibody fragments by use of surface plasmon resonance. Journal of bioscience and bioengineering, 100(3):311–317, 2005.
- [9] Michael Linnebacher, Peter Lorenz, Cornelia Koy, Annika Jahnke, Nadine Born, Felix Steinbeck, Johannes Wollbold, Tobias Latzkow, Hans-Jürgen Thiesen, and Michael O Glocker. Clonality characterization of natural epitope-specific antibodies against the tumor-related antigen topoisomerase iia by peptide chip and proteome analysis: a pilot study with colorectal carcinoma patient samples. Analytical and bioanalytical chemistry, 403(1):227–238, 2012.
- [10] Leonor Michaelis and Maud L Menten. Kinetics of invertase action. Biochem. z, 49:333–369, 1913.
- [11] Alexandra Thiele, Gabriele I Stangl, and Mike Schutkowski. Deciphering enzyme function using peptide arrays. Molecular biotechnology, 49(3):283–305, 2011.
- [12] Jo Vandesompele, Katleen De Preter, Filip Pattyn, Bruce Poppe, Nadine Van Roy, Anne De Paepe, and Frank Speleman. Accurate normalization of real-time quantitative rt-pcr data by geometric averaging of multiple internal control genes. Genome biology, 3(7):research0034, 2002.