Revisiting the Merit-Order Effect
of Renewable Energy Sources
Abstract
An on-going debate in the energy economics and power market community has raised the question if energy-only power markets are increasingly failing due to growing feed-in shares from subsidized renewable energy sources (RES). The short answer to this is: No, they are not failing. Energy-based power markets are, however, facing several market distortions, namely from the gap between the electricity volume traded at day-ahead markets versus the overall electricity consumption as well as the (wrong) regulatory assumption that variable RES generation, i.e., wind and photovoltaic (PV), truly have zero marginal operation costs.
In this paper we show that both effects over-amplify the well-known merit-order effect of RES power feed-in beyond a level that is explainable by underlying physical realities, i.e., thermal power plants being willing to accept negative electricity prices to be able to stay online due to considerations of wear & tear and start-stop constraints. We analyze the impacts of wind and PV power feed-in on the day-ahead market for a region that is already today experiencing significant feed-in tariff (FIT)-subsidized RES power feed-in, the EPEX German-Austrian market zone (20% FIT share).
Our analysis shows that, if the necessary regulatory adaptations are taken, i.e., increasing the day-ahead market’s share of overall load demand and using the true marginal costs of RES units in the merit-order, energy-based power markets can remain functional despite high RES power feed-in.
I Introduction
Around the same time as the liberalization of many of the European electricity markets in the early 1990s, government support schemes with the specific goal of promoting large-scale deployment of renewable energy sources (RES) were introduced. The German Renewable Energy Act, ”Erneuerbare-Energien-Gesetz” (EEG), a well-known support scheme, provides a favorable FIT for a variety of RES since the year 2000, building on its predecessor, the Stromeinspeisungsgesetz (1990). It gives priority to electric power feed-in from RES over power feed-in from conventional power plants, i.e., fossil- and nuclear-fueled thermal and old, often large hydro-based power plants. This favorable investment case has generated installed capacities of about 35 GW each for wind and PV units by year-end 2013 [1]. The evolution of installed variable RES capacities and annual energy production in Germany from 1990 to 2012 [2], including an outlook till 2017 [3]. The original goal of FITs, i.e., large-scale RES deployment (Figure 1a) and significant RES energy shares (Figure 1b) is achieved.
With a combined installed capacity of wind & PV units of around 70 GW by year-end 2013, somewhat higher than the average load demand in Germany (63–68 GW dependent on load demand measure [4, 5]), wind & PV units clearly cannot be treated as exotic, marginal electricity sources anymore. The current RES production has already significant effects on the power market, notably in the form of the so-called merit-order effect. Especially the decoupling of day-ahead market prices and RES feed-in due to FIT regulations, results in lower average day-ahead price levels and also in negative day-ahead prices for several hours each month. In today’s European power market environment in which significant over-capacities exist [6], yearly average spot market prices as well as base-peak spreads in Europe are at their lowest in years [7]. One effect of this is that flexible power plants such as gas-fired units cannot be operated profitably because peak day-ahead prices are too often below their marginal operation costs. Another effect is that due to the also decreasing spread of peak/base day-ahead prices, the profitability of operating energy storage facilities, i.e., pumped storage hydro plants (PSHP) has been diminishing in recent years [8].
While in the long run support schemes for RES units are likely to be phased-out, and they will thus have to compete in a normal market setup, in the mid-term the power market structure may have to be adapted to the increasing effects of RES deployment. For the subsequent investigation the two relevant perspectives have to be taken into account:
-
1.
Producer perspective: How to keep the profitability of necessary dispatchable base and peak load power plants in a power market with high shares of RES?
-
2.
Consumer perspective: How to lower the cost of FIT schemes and enable the transition to a less subsidized (and eventually true) power market?
a) Evolution of installed power capacity of wind turbine and PV units. b) Evolution of annual feed-in of wind turbine and PV units.
I-A Producer Perspective
In Germany, and similarly in Austria, all FIT-supported RES power feed-in is settled at the day-ahead market of the European Power Exchange (EPEX) either directly, e.g. in the form of power supply bids, or indirectly, e.g. in the form of reduced load demand bids. This construction results in two major effects on the day-ahead market. Firstly, because of the decoupling of FIT-supported RES feed-in from day-ahead spot prices, the average spot price decreases, since all those bids will be located on the negative side of the supply curve, e.g. going as low as €/MWh, in order to guarantee the settlement. Besides the generally lower day-ahead spot price levels, negative day-ahead prices tend to occur, especially in low demand & high wind situations. Secondly, because of the large deployment of PV, the peak/base spread is decreasing significantly [8, 7]. Combined with today’s significant over-capacities of conventional power plants in Europe [6], these developments result in profitability problems of both base and peak load power plants as well as short-term storage units (i.e. pumped storage hydro plants).
Short- and mid-term, a completely RES based electricity production on its own can neither provide the necessary production volume nor the necessary reliability for fulfilling the load demand at all times throughout the year. Conventional power plants, whose generation output can be controlled, are still necessary for providing base and peak load demand, buffer the lack of wind and PV power feed-in during absences of wind & sunshine and, generally, cover the prediction error of variable RES power feed-in.
One proposed solution for this problem is the implementation of capacity markets, where (conventional) power plants are rewarded not only for energy delivery but also for providing a firm power capacity [9]. Capacity markets help to reduce power plant investment risk as they provide an additional revenue stream for power plant owners. However, the introduction of capacity markets would add yet another subsidy mechanism, preventing both an efficient functioning of the energy-only power market and, in the long run, an affordable energy transition to significant RES shares in the electricity sector. The idea of introducing capacity markets is thus challenged by others, who argue that energy-only power markets can actually function efficiently for power systems with even higher RES shares than today [10, 11].
I-B Consumer Perspective
Out of the many possible support schemes for RES, FIT-based schemes turned out to be highly effective energy policy instruments. As a result, large-scale deployment of RES, especially wind and PV has been remarkably successful. The actual FIT payments, i.e., the difference between FIT tariffs and hourly day-ahead market prices, is financed in Germany via an additional levy on electricity consumption (EEG Umlage). Due to the EEG FIT scheme’s great success, this levy has become significant, i.e. 6.24 €ct/, or about 22%, of an average residential electricity rate of 29 €ct/ (year 2014). The average German retail consumer electricity price is nowadays a midst the highest in Europe [12] whereas the average day-ahead whole-sale electricity price is one of the lowest [7]. To prevent additional long term price increases, the consumer has the interest that costs for FIT schemes are lowered and that the integration of RES power feed-in into competitive power market frameworks is achieved.
I-C Outline
While in the long run, subsidy schemes for RES units will eventually be phased-out, the uncertainty of RES electricity production, i.e., the inherent mismatch between production forecasts and actual production, will persist. As an intermediate step to a fully competing power market setup for RES, where they face a price risk and also have to pay for the forecast error, corrections of existing power market frameworks are necessary. Such corrections have to ensure that consumer and producer perspectives are satisfied, while minimizing regulatory actions.
In this paper we analyze the following two aspects of the EPEX power market, while leaving the currently existing day-ahead power market setup intact:
-
1.
Comparison of hourly power feed-in volume of wind & PV units to the overall load demand volume.
-
2.
Estimation of resulting day-ahead market price levels in case that the given wind & PV electricity volumes are settled for a range of assumed possible marginal operation costs (0–20 €/), see Section IV-A for the reasoning behind non-zero marginal costs of wind & PV units and an indicative literature review.
Based on those assumptions we will discuss the effect on the power market as well as on power plants. We will finally elude on the original question if substantial alterations to power market setups such as the introduction of capacity markets are really necessary or whether there are simpler ways to reduce market distortions in energy-only markets caused by large amounts of RES feed-in.
II Data
The analysis is based on high-resolution time-series data of the German power system, provided by the transparency platform of the European Energy Exchange (EEX) [13] and the European Network of Transmission System Operators for Electricity (ENTSO-E) data portal [5]. The analysis is done for the full years 2011–13. Table I lists the employed time-series data and data sources.
| Time-Series Data | Sources |
|---|---|
| Vertical grid load | ENTSO-E |
| German day-ahead price | EEX |
| German day-ahead bid/ask curve | EEX |
| German wind feed-in | EEX |
| German PV feed-in | EEX |
Vertical grid load, wind and PV feed-in are available with 15-min. resolution, while day-ahead prices and bid/ask curves are available with hourly resolution. All analysis with data of both resolutions are done on hourly resolutions and the 15-min. resolution data is down-sampled to fit hourly resolution. Vertical grid load is adjusted to match the official total electricity supplied in Germany, i.e. 561.3 TWh in 2011 (566.7 TWh in 2012) [2, 4]. The bid/ask curve data as provided by EEX seemed to be somewhat filtered and restructured (exactly 200 demand/supply bids for each hourly step); supposedly to blur the exact bid and ask structure. The available data quality is, however, fully sufficient for our analysis. (Daylight saving time effects were appropriately removed.)
III Quantitative Analysis of EPEX Spot
III-A Spot Market Volume and RES Production
The European Power Exchange (EPEX) is the dominant day-ahead and intra-day power market in Central and Western Europe, directly serving Austria, France, Germany and Switzerland. Here, most of the day-ahead spot market trading is performed via EPEX. The yearly clearing volume of the day-ahead spot market of EPEX’s combined German/Austrian market zone amounted to around in 2011 [14]. However, this is only about (or ) of the total electricity supplied of around in Germany (or in Germany and Austria combined) for 2011. By 2013, these market shares had risen to (DE) and (DE+AT), respectively. All of Germany’s FIT-subsidized RES generated electricity has to be traded on the EPEX day-ahead market (DE+AT market zone). In 2011 this amounted to around or 16.8% of total electricity consumption. Out of the overall FIT-subsidized RES feed-in came from PV and from wind turbines [2] (and combined for Germany and Austria). Variable RES units thus contributed about of all FIT-subsidized renewable electricity production. By 2013, the FIT-subsidized RES share had risen to (DE) and (DE+AT), respectively.
III-B Time-Series Analysis
In the following, a thorough analysis of the respective yearly time-series of the EPEX cleared trading volume (German/Austrian market zone), the FIT-subsidized renewable electricity production and the final electric load demand, both for Germany only, is performed. In the remainder of this section, all result figures were calculated using hourly power feed-in and load demand time-series for the full-year 2011 (8’760 hours). The results for the years 2012 and 2013 are qualitatively similar, exhibiting a steady rise of both RES energy as well day-ahead market shares with respect to total load demand.
III-B1 EPEX Trading Volume versus Load Demand
The amount of the cleared day-ahead market volume as a function of final electricity consumption for a given hour oscillates between a minimum contribution of and a maximum contribution of . A histogram of the EPEX day-ahead volume versus German total load demand volume in 2011 is shown in Figure 2. The average ratio between cleared day-ahead market volume and electricity demand over the course of the year was (volume-weighted mean). It contributed thus a bit less than half, i.e., two-fifth, of all electricity demand in the German/Austrian EPEX market zone for the full-year 2011.
III-B2 RES feed-in versus Load Demand
The amount of FIT-subsidized RES production as a function of total electricity consumption for a given hour oscillates between a minimum contribution of and a maximum contribution of . The mean contribution over the full year is (volume-weighted mean). The PV energy share of net load demand varies between zero and with a volume-weighted mean of (in 2011). The wind energy share of net load demand varies between zero and with a volume-weighted mean of (in 2011).
III-B3 RES feed-in versus EPEX Trading Volume
The amount of FIT-subsidized RES production that is bid into the spot market as a function of overall cleared day-ahead market volume for a given hour varies significantly over the course of the year. The ratio varies between a minimum of and a maximum of . The mean contribution of FIT-subsidized RES feed-in to the total day-ahead market volume over the full year is (volume-weighted mean). FIT-subsidized RES generated electricity contributes thus a bit less than half of all electricity generation that is traded in the German/Austrian EPEX market zone. A histogram of the FIT-subsidized RES feed-in volume versus the EPEX day-ahead volume in 2011 is given in Figure 3. The PV energy share of the day-ahead market volume varies between zero and with a volume-weighted mean of (in 2011). In comparison to this, the wind energy share of the day-ahead market volume varies between zero and with a volume-weighted mean of (in 2011). Other EEG feed-in, i.e., biomass, landfill and bio gas as well as small hydro, make up a volume-weighted mean of of total EPEX volume (in 2011).
III-C Results
Although all FIT-subsidized RES generated electricity contributed less than a fifth of Germany’s and Austria’s combined total load demand ( in 2012, in 2013), it constituted close to half ( in 2012, in 2013) of the traded electricity volume of EPEX’s German/Austrian market zone. This is clearly illustrated by the gap between the histograms of both the FIT-subsidized RES feed-in volume versus total load demand and EPEX day-ahead volume, respectively, as given in Figure 4.
The underlying reason for the observed volatile day-ahead price dynamics caused by the merit-order effect thus becomes obvious: The day-ahead market is, volume-wise, largely dominated by subsidized RES feed-in, which thus drives the dynamics of the day-ahead price clearing mechanism. This is in stark contrast to the physical situation in the German power system, in which FIT-subsidized RES feed-in plays a minor, but rising role. An obvious approach for mitigating highly fluctuating day-ahead prices within the existing energy-only power market is thus to increase the trading volume of day-ahead markets by incorporating more of the conventional electricity production that is currently sold bilaterally, i.e., over-the-counter (OTC), outside the EPEX day-ahead market.
III-D Comparison of EPEX and Nord Pool Spot Market
Comparing the situation of the EPEX day-ahead market to the situation in a neighboring power market reveals interesting insights. The Nord Pool is a mature multinational day-ahead spot market that comprises the north and north-eastern European countries Finland, Denmark, Norway, Sweden and Estonia [15]. The yearly total load demand of the Nord Pool countries () is comparable in scale to the German/Austrian EPEX market zone () [4]. Both power markets comprise day-ahead and intra-day markets that are organized similarly (energy-only, with a strategic reserve in Scandinavia). Nord Pool is, as a directly neighboring and well-connected market with a similarly high RES integration and a similarly small number of few big players with conventional plants, in fact an ideal candidate for a comparison.
The stark contrast between the two power markets is that only around two-fifth ( in 2013) of the yearly load demand in the German/Austrian grid zone is traded on the in EPEX day-ahead market, more than four-fifth ( in 2013) of the load demand of the Nord Pool countries (except Estonia) is traded on the day-ahead market.
The evolution of the EPEX day-ahead (EEX spot until 2009) and Nord Pool day-ahead market shares of the yearly load demand in their respective market zones is illustrated in Figure 5.
Market shares of both day-ahead markets have significantly grown over the years, but the Nord Pool day-ahead market has a sizable lead in market share over EPEX. Please note that not necessarily all of the FIT-subsidized RES feed-in in Germany and Austria ( in 2013) may be given directly to the EPEX day-ahead market, i.e., as supply-side bids. Since 2010 there is an obligation on German transmission system operators (TSO) to put all FIT-/EEG-subsidized electricity directly onto the day-ahead market. However, due to the increase of so-called direct marketing of RES feed-in by private actors, notably wind power, the data situation is not entirely transparent. Nevertheless, it is fair to assume that all variable RES feed-in from wind & PV units – by it’s very nature a short term commodity – influences the day-ahead spot market at least indirectly, i.e., in the form of reduced load demand.
To our best knowledge, there is no inherent limitation and, hence, credible reason why similar spot market shares as in the Nordic countries could not be reached also in Germany, Austria or elsewhere in Europe.
One policy instrument for increasing the market share of the day-ahead market would be the introduction of a mandatory pool for physical energy procurement as is the case in Spain (OMEL) and the US power markets (e.g. PJM) [16, p. 71, p. 106], at least during a transitional phase, and the use of the futures market for hedging.
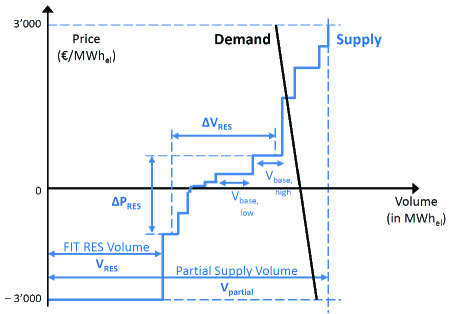
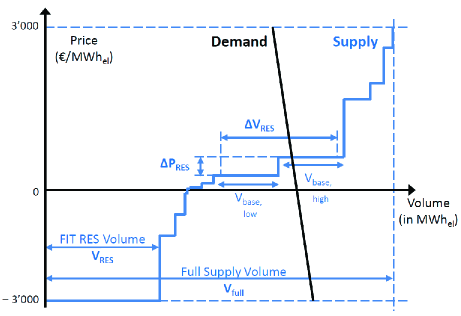
By doubling the EPEX day-ahead market share, the FIT-subsidized RES feed-in share at the day-ahead market is, on average, cut in half. Quite obviously this would lead to a significant reduction of the well-known merit-order effect of RES power production. Structurally, the reduction of the merit-order effect is due to the on average lower slope of the supply bid curve. Due to the larger overall supply volume () especially regarding base load generation units (), the spot price volatility due to the volatility of the RES production volume is significantly lower as is illustrated in Fig. 6.
With the following assumptions:
-
I
the full spot price range, i.e. [3’000€/MWh], is already covered in today’s spot market supply curve (confer to Fig. 7 for an actual bid/ask curve example),
-
II
under a mandatory pool regime, spot market supply volume will be higher than today, i.e. ,
the supply curve slope in a mandatory spot market pool has to be, on average, lower than today (or at most equal):
| (1) |
The quantitative effect of the RES feed-in share at the day-ahead market on the merit-order effect is part of subsequent investigations in Section IV.
IV Effects of including RES Marginal Costs in Power Market Ask Curve
In the following we analyze the quantitative effect on day-ahead prices if wind and PV feed-in would have to be settled at the day-ahead market using the marginal operation costs of RES units. The volume risk of the forecast error, i.e., predicted feed-in versus realized feed-in, is not covered by the RES supplier. Note, that this situation would still constitute a support scheme but a milder one than the existing FIT scheme. Compared to a fossil-fueled power plant, “fuel´´ costs of wind & PV plants or any other variable RES production units such as run-of-river hydro plants or the solar field of concentrating solar power (CSP) plants are obviously zero. (Note that a gas-fueled part of a CSP plant would obviously incur fuel costs.)
There are, however, other cost components that can be considered as marginal operation costs for variable RES units. These can include marginal wear & tear from plant operation, at least the part that can be directly attributed to run-time and energy produced, for any turbine-driven plant as well as concession taxes and land-lease payments that are calculated per unit energy produced (in ). Energy-based marginal concession taxes exist, for example, for hydro units in Vallais, Switzerland (Wasserzins) and Saxony, Germany (Wasserentnahmeabgabe). Land-lease payments, e.g., for the land-use of wind & PV units are at the discretion of the involved parties, i.e., land-owner and RES plant owner, but often do include a revenue component for the electricity plant.
Mid-term, e.g., by the time existing FIT-support schemes are phased-out or adapted to not include a grid feed-in guarantee, it is likely that at least a part of the day-ahead price and volume risk of RES feed-in has to be covered by these units, notably wind & PV, directly. Such an obligation would result in a form of an insurance fee or risk coverage for the forecast error of the variable RES electricity production. Today, system operators usually do have to cover the forecast error by acquiring control reserve power capacity a priori, which then provides the needed balancing energy in real-time.
Total marginal operation cost of running variable RES units is thus the sum of the individual cost components:
| Marginal production costs of RES unit [€/MWh] | wear & tear cost [€/MWh] | |||
| land-lease cost [€/MWh] | ||||
| concession tax [€/MWh] | ||||
The effect is that the marginal operational costs for RES production, especially wind & PV units, become positive, since at least the risk coverage costs must be earned by the actual electricity production. This, obviously, will change the bidding behavior of wind & PV units as well as the structure of the merit-order curve. For a system’s perspective on RES grid integration costs, confer to [17].
IV-A Literature Review – Marginal Costs for Wind&PV units
We obtained general wear&tear operation costs of RES units, essentially operation and maintenance (OM) costs, from a literature survey of recent reports on electricity generation costs [18, 19, 20]. Operation cost for wind (onshore) generation were in the range of – €/MWh, whereas for PV generation costs were in the range of – €/MWh. Within OECD countries median OM values of €/MWh for onshore wind and of €/MWh for PV have been presented [18, p. 102]. The largest share of these operation costs will not be truly marginal, i.e., in the sense that additional cost will be incurred for every additional (marginal) electricity unit (in MWh) produced. For the moving parts of wind turbines etc. one can fairly attribute some marginal O&M cost, whereas on can probably not do so in the case of PV units.
Marginal costs for land-lease as well as concession taxes will always be site-specific. For the above mentioned hydro concession taxes the cost range is about – €/MWh.
The marginal costs or insurance fee for covering the risk of forecast errors and the involved costs for calling on control reserve power and energy via ancillary service markets will also be site-specific and depend on the responsible system operator. In the case of the German TSOs, an estimation of balancing costs for wind & PV forecast errors is possible due to recent regulatory transparency efforts. Balancing costs have recently been assessed to be in the range of – €/MWh for the years 2011–2013 [21].
IV-B Wind & PV Supply Bid Assumptions
The subsequent analysis is based on certain assumptions regarding wind & PV marginal costs and supply bids:
-
•
In case the FIT scheme provides a feed-in guarantee for all FIT-supported RES production: we assume that the transmission system operator (TSO) gives all RES with a large negative price bid, i.e., –3000 €/MWh to the day-ahead market, to ensure the settlement.
-
•
In case the FIT scheme does not provide a feed-in guarantee for all FIT-supported RES production: we assume total marginal operation costs for both wind & PV units to be in the range of 0–25 €/MWh and simulate in steps of 5 €/MWh.
-
•
Only wind and PV power feed-in are considered since they represent the majority, i.e., two-third, of German FIT-subsidized RES feed-in.
-
•
There is no separation between on-shore and off-shore wind power feed-in. Currently less than 5% of the installed wind capacity in Germany is off-shore and therefore negligible at the moment. In the future two different O&M costs for off-shore and on-shore wind power feed-in have to be considered.
-
•
The demand side of power markets is not affected.
IV-C Method
Wind/PV FIT feed-in is settled over the day-ahead market with an ask of –3000 €/MWh, since the FIT paid is independent from the achieved day-ahead spot market price and the TSO has to ensure the settlement of the RES feed-in. One of the main questions is now, what would be the resulting market prices, if wind & PV would have to be settled under market conditions. In the following we investigate the impacts of settling RES feed-in with realistic marginal costs, as given in Section IV-A.
For the calculations we settle the day-ahead market based on the EPEX bid-ask-curve. We leave the demand curve untouched and rearrange the ask curve by applying the corresponding marginal costs on wind & PV volume. The settlement is done based on the EPEX settlement [22]. Figure 7 shows the volume of the realized and the modified ask curve. Here, settling wind & PV with assumed marginal costs results in a visible jump for wind energy bids and the resulting power market ask curve.
IV-D Results
For the analysis, we calculate artificial day-ahead prices assuming significant marginal costs, i.e., €/ of RES feed-in for the following scenarios:
-
1.
Only wind feed-in is settled with marginal costs.
-
2.
Only PV feed-in is settled with marginal costs.
-
3.
Wind & PV feed-in are settled with marginal costs.
We discuss the effects that the resulting artificial day-ahead prices have on the three principal power plant types, i.e., base load, flexible peak load plants and storage units.
IV-D1 Analysis of Spot Price Formation
First, we analyze the effect when wind feed-in is settled with marginal costs whereas PV feed-in is still subsidized. Figure 8 shows the settlement of day-ahead prices under the assumption, that wind energy is settled with marginal costs. It is shown, that no negative price effects are existing anymore. Some hours are settled below the marginal cost of wind units. In these hours the power feed-in from other, cheaper sources is sufficient for covering the load demand; no wind power was dispatched.
Figure 9 shows the constructed day-ahead prices where wind feed-in is still supported with FIT and PV is settled using marginal costs. The analysis shows, that the pure PV feed-in over marginal costs does not change the overall settlement of high prices above the marginal cost level. The spikes in the day-ahead prices remain and so do negative day-ahead price events. The negative spot prices do not vanish in the pure PV scenario because they are all occurring during off-peak times, where PV production coincides with high demand. If the installed PV capacity increases further, we may observe negative prices during peak hours as a result of PV feed-in as well.
Figure 10 shows the bid/ask curves using marginal costs for wind & PV power feed-in. As for wind feed-in only, some hours exist below the marginal costs of PV, which are lower than the wind marginal costs. In those hours, production from other base load power plants is sufficient; no RES power was dispatched.
IV-D2 Producer Perspective
As discussed in Section I, we analyze the effect of the settlement of wind & PV feed-in on three groups of power plants:
-
1.
Base load power plants (nuclear, lignite, hard coal),
-
2.
Peak load power plants (gas and storage plants),
-
3.
Short term storage (PSHP and other technologies).
As shown previously in Figure 10, all negative prices vanish as soon as RES units have to settle with their respective marginal costs. In some hours the settled day-ahead price is even lower than the marginal cost of PV and covered by other base load plants. In addition, the marginal costs of at least some base load power plants are below the marginal cost of wind & PV units.
The existence of bids below the introduced marginal costs for wind & PV indicates that conventional base load power plants have marginal costs below the marginal costs for wind & PV. Besides negative marginal costs, which is often the result of avoiding otherwise necessary power plant down-ramping or even shutdowns in some hours, also longer periods of no wind & PV production exist and therefore large base load power plants can run profitable below the in this paper assumed marginal costs for wind & PV.
The second category of plants, flexible fossil-fueled plants like natural gas fired units and larger storage plants, are not affected by the change, since they profit from peak hours.
IV-D3 Consumer Perspective
The high costs generated by the FIT will be lowered, because the RES generation can be settled at a significantly higher price. Costs for the coverage of the forecast error of wind and PV generators are still present, but determining the incurred costs due to this is clearly beyond the scope of the paper. Given the long-term guarantee of the FIT scheme (20 years), the overall RES deployment cost can be lowered significantly and a transition to a competitive spot market seems possible.
IV-D4 RES Producer Perspective under Market Constraints
As shown in Figure 7 and 10, a large amount of RES feed-in is still settled via the day-ahead spot market, if RES feed-in is given to the market with marginal costs. While during the FIT period, only the costs for FIT will be lowered, a real market situation, independent from the prediction error, seems also possible. Future work will address the impact of such a regime change, which gives no RES feed-in guarantee, for the effective RES grid integration.
IV-E Sensitivity Analysis of Marginal Operation Costs
Since the real marginal costs of wind & PV are site-specific and thus hard to estimate, we have compiled a sensitivity analysis of the impacts of different assumed marginal operation costs, ranging from 0–20 €/MWh in steps of 5 €/MWh, for either wind or PV power feed-in.
The effects of these assumed marginal costs on the day-ahead market clearing are illustrated in Figure 11. A quantitative analysis of average day-ahead spot prices and their volatility is given in Tab. II–V. While the effects increase with higher marginal costs, the overall observations of the paper are nevertheless validated. As can be seen, average day-ahead spot market prices will be higher if wind or PV feed-in is bid into the day-ahead market with positive marginal costs. Also, the price volatility (i.e., standard deviation) is decreasing. Both effects are significantly more pronounced in the case of wind power feed-in, as shown in Figure 11 (a) clearly shows that positive marginal costs for wind feed-in push the day-ahead clearing prices above zero in all instances. This is not the case for PV feed-in, see Figure 11 (b). The original clearing results for an feed-in guarantee via highly negative bids (–3000 €/MWh) are also shown.
| Marginal cost of PV | Year | ||
|---|---|---|---|
| (€/MWh) | 2011 | 2012 | 2013 |
| -3000 | 51.5 | 42.8 | 37.9 |
| 5 | 51.55 | 42.8 | 38.0 |
| 10 | 51.6 | 42.8 | 38.0 |
| 15 | 51.6 | 42.8 | 38.1 |
| 20 | 51.6 | 42.9 | 38.3 |
| Marginal cost of PV | Year | ||
|---|---|---|---|
| (€/MWh) | 2011 | 2012 | 2013 |
| -3000 | 13.4 | 18.6 | 16.5 |
| 5 | 13.4 | 18.6 | 16.2 |
| 10 | 13.3 | 18.6 | 16.2 |
| 15 | 13.3 | 18.6 | 16.0 |
| 20 | 13.3 | 18.5 | 15.8 |
| Marginal cost of Wind | Year | ||
|---|---|---|---|
| (€/MWh) | 2011 | 2012 | 2013 |
| -3000 | 51.5 | 42.8 | 37.9 |
| 5 | 51.6 | 43.2 | 38.0 |
| 10 | 51.6 | 43.3 | 38.1 |
| 15 | 51.7 | 43.4 | 38.5 |
| 20 | 51.8 | 43.6 | 38.9 |
| Marginal cost of Wind | Year | ||
|---|---|---|---|
| (€/MWh) | 2011 | 2012 | 2013 |
| -3000 | 13.4 | 18.6 | 16.5 |
| 5 | 13.3 | 15.8 | 15.9 |
| 10 | 13.2 | 15.7 | 15.7 |
| 15 | 13.0 | 15.5 | 15.2 |
| 20 | 12.7 | 15.0 | 14.5 |
V Conclusion
While FIT-subsidized RES generated electricity contributed less than one-fifth of Germany’s total electric load demand per year, it represents almost half of the traded day-ahead spot volume. This is no surprise as the EPEX day-ahead market only has a market share of about two-fifth of Germany’s total load demand in recent years (2011–2013). The day-ahead market is therefore largely dominated by subsidized RES feed-in, which in turn drives the dynamics of the day-ahead price clearing mechanism. The well-known merit-order effect of RES power feed-in, i.e. falling day-ahead spot price levels as well as highly fluctuating day-ahead prices, is thus amplified to a level that is in clear contrast with the physical situation in the German power system, in which RES feed-in still plays a minor, albeit rapidly rising role.
An obvious approach for mitigating the merit-order effect within the existing energy-only power market, i.e., without changing the market mechanism towards a capacity market or else, is to increase the day-ahead spot markets trading volume to actually capture the majority of the load demand. This can be achieved by incorporating more of the electricity production that is currently sold bilaterally, i.e., over-the-counter (OTC), outside of the day-ahead market. Comparably mature power markets like Nord Pool Spot in the Nordic countries achieve a market share of more than four-fifth of the respective total load demand. The authors believe that reducing the volume dominance of RES feed-in in the EPEX spot by means of mandatory spot pools will significantly reduce the existing RES merit-order effect.
We also show that the settlement of RES at the day-ahead market with marginal cost is possible. Negative prices disappear and in most days, at least some of the RES production volume is settled. Base load power plants profit from the situation because of an elevated average day-ahead price level. Gas-fired power plants and hydro storage units covering peak hours are not effected, since peak prices are not effected by the above discussed changes. Because of the further decreasing peak-base spot price spread, the already non-profitable short term storage plants suffer even more. Given fully dispatchable power plants that have sufficient operational flexibility in technical terms, i.e., fast ramping, start/stop times and minimum operation point requirements, energy-only power markets seem to work even for high RES penetration scenarios ().
References
- [1] REN21, “Renewables 2014 Global Status Report,” 2014. [Online]. Available: www.ren21.net
- [2] AG Energiebilanzen e.V., “Energiestatistiken,” 2013. [Online]. Available: www.ag-energiebilanzen.de
- [3] BDEW Bundesverband der Energie- und Wasserwirtschaft e.V., “Erneuerbare Energien und das EEG: Zahlen, Fakten, Grafiken (2013),” Jan. 2013. [Online]. Available: www.bdew.de
- [4] International Energy Agency (IEA), “Electricity Information,” 2012.
- [5] ENTSO-E Data Portal, “German hourly load data,” March 2012. [Online]. Available: www.entsoe.eu
- [6] The Economist, “How to lose half a trillion euros.” [Online]. Available: www.economist.com/news/briefing/21587782-europes-electricity-providers-face-existential-threat-how-lose-half-trillion-euros
- [7] EPEX, “European Power Exchange (EPEX) – Annual Reports,” 2009-2013. [Online]. Available: www.epexspot.com/en/
- [8] M. Hildmann, A. Ulbig, and G. Andersson, “Electricity Grid In-feed from Renewable Sources: A Risk for Pumped-Storage Hydro Plants,” in 8th International Conference on the European Energy Market (EEM11), Zagreb, Croatia, 2011.
- [9] Deutsche Energie-Agentur GmbH (dena), “Integration der erneuerbaren Energien in den deutsch-europäischen Strommarkt.” p. 173, 2012.
- [10] M. Nicolosi, “Necessity of Capacity Mechanisms,” p. 72, 2012. [Online]. Available: www.ecofys.com
- [11] ——, “Leitstudie Strommarkt – Arbeitspaket Optimierung des Strommarktdesigns,” July 2014. [Online]. Available: www.bmwi.de/DE/Mediathek/publikationen,did=643918.html
- [12] European Commission (EC), “Energy prices and costs report (2014),” March 2014.
- [13] EEX, “European Energy Exchange (EEX) Transparency Homepage,” 2013. [Online]. Available: www.transparency.eex.com/en/
- [14] EPEX, “European Power Exchange (EPEX),” 2013. [Online]. Available: www.epexspot.com/en/
- [15] Nord Pool Spot, “Nord Pool Spot Annual Reports,” 2002–2012. [Online]. Available: www.nordpoolspot.com
- [16] F. P. Sioshansi, Competitive Electricity Markets: Design, Implementation, Performance. Elsevier, 2011.
- [17] L. Hirth, F. Ueckerdt, and O. Edenhofer, “Integration costs and the value of wind power. thoughts on a valuation framework for variable renewable electricity sources,” Potsdam Institute for Climate Impact Research and Vattenfall GmbH, 2012.
- [18] International Energy Agency (IEA), “Projected Costs of Generating Electricity – 2010 Edition,” 2010.
- [19] F. Bauer and C. Stolzenberger, “EURELECTRIC/VGB Industry Representatives of ”IEA Projected Costs of Generating Electricity – 2010 Edition” Study (page 91),” 2012.
- [20] Fraunhofer ISE, C. Kost, S. Thomas, J. Thomsen, S. Nold, and J. Mayer, “Levelized Cost of Electricity Renewable Energies,” 2012.
- [21] J. Müller, M. Hildmann, A. Ulbig, and G. Andersson, “Grid integration costs of fluctuating renewable energy sources,” arXiv preprint arXiv:1407.7237, 2014.
- [22] European Energy Exchange (EEX), “Determination of Settlement Prices,” European Energy Exchange AG, Leipzig, Tech. Rep., 2012. [Online]. Available: www.eex.de