’Mutual Watch-dog Networking’: Distributed Awareness of Faults and Critical Events in Petascale/Exascale systems
I Introduction
Features like resilience, power consumption, and availability of large scale computing system strongly depend on 1- the complexity of individual components (e.g. the gate count of each chip) and 2- the number of components in the system. Exa-scale computing systems and networks of 3G devices are examples of distributed systems composed of a huge number of high complexity individual devices. Indeed, the FIT (Failures In Time) rate of individual hardware components, when scaling to peta- and exa-scale systems, becomes a hard challenge to the collective efficiency or even reasonable functionality for the platform.
A first step to mantain systemic functionality and efficiency is the adoption of hardware design techniques which improve the individual component. Considering the case of fault resilience, multi-core sockets used on many-core systems must adopt resiliency techniques to reduce the FIT (Failures In Time) rate. This design trend is already clear in the transition between past tera-scale systems, adopting commodity processors with fails per year per socket, to peta-scale systems, where the failure rate could be reduced to 0.001 fails per year per socket[1] adopting hardware design techniques like memory and bus encoding, memory scrubbing, provision of spare processors and memories. Even considering those reduced FIT rates and a very limited number of components, mission critical/life support systems mandate for architectures adopting double or triple redundancy. In practice, petaFLOPS designs based on resilient sockets adopting such countermeasures are characterized by a rate of system-stopping features in the range of a few days, while a system failure rate in the range of few hours is displayed by systems mounting less resilient sockets.[2].
Without additional measures, the FIT rate of exa-scale systems becomes unacceptable due to the scaling in the number of components. Analogously, for what regards power and thermal issues, each socket and component is nowadays designed keeping the energetic concerns as key drivers but systemic countermeasures are required due to the numerosity of components.
In our vision, a necessary feature on larger scale architectures is the detection and collation of relevant information about faults and critical events and, due to the distributed nature of the system, the reliable propagation of this awareness up through the system hierarchy. In other words, the system must be rendered fault-aware to be able to choose and enact the actual system fault response.
Based on these considerations, the EURETILE project starts bottom-up proposing a mechanism that creates a systemic awareness of fault and critical events, the LO|FA|MO design: a distributed, mutual watch-dog paradigm which enables the management of faults and critical events in large scale systems.
The LO|FA|MO design can complement a pro-active mitigation approach, i.e. the enforcing of preventive actions (e.g. preemptive process migration, dynamic clock frequency reduction for individual components, dynamic routing strategies, etc.) before the failure occurs, so as to avoid faults that can reasonably be expected or minimize the impact of those who can not.
In this paper, we will mainly focus on the requirements imposed by 1-exa-scale systems[3], i.e. an assembly of tens or hundreds of thousands of processors, hundreds of I/O nodes and thousands of disks, and 2- future many-tile sockets; however, similar techniques could be applied to large networks of independent, autonomous devices.
Our approach should mitigate the performance penalty and productivity reduction due to work loss and failure recovery, obtainable using exclusively the conventional approach to fault tolerance (checkpointing/failure/rollback), which is foreseen to be problematic[1].
With the assistance of some hardware components located in the DNP (Distributing Network Processor), the router of our APEnet+, the LO|FA|MO design paradigm employs some ’watchdog’ techniques for reciprocal fault diagnosis between the DNP itself and a companion ’host processing element’ within a node or on nodes which are neighbouring in the APEnet+ mesh topology; moreover, it employs a number of best-effort heuristics for delivering the diagnostic data even in case of faulty or broken links along an auxiliary support network. This network is a possibly low-speed, but highly reliable, diagnostic-dedicated, independent one, which leans on its high-speed 3D toroidal companion mesh in the extreme case of its own failing.
Once complemented with diagnostic facilities that monitor whatever metrics are deemed relevant to the prediction of faults (e.g. temperature and voltage/current probes, BER counters, etc.), LO|FA|MO is a keystone upon which a fault management system can draw inferences that drive its strategies and actions to keep the system up and running.
Future work is aimed towards increasing the capabilities of the DNP regarding local re-routing, in sight of the most ambitious goal of building a network mesh whose routing is deadlock-free and fault-tolerant.
II Definitions
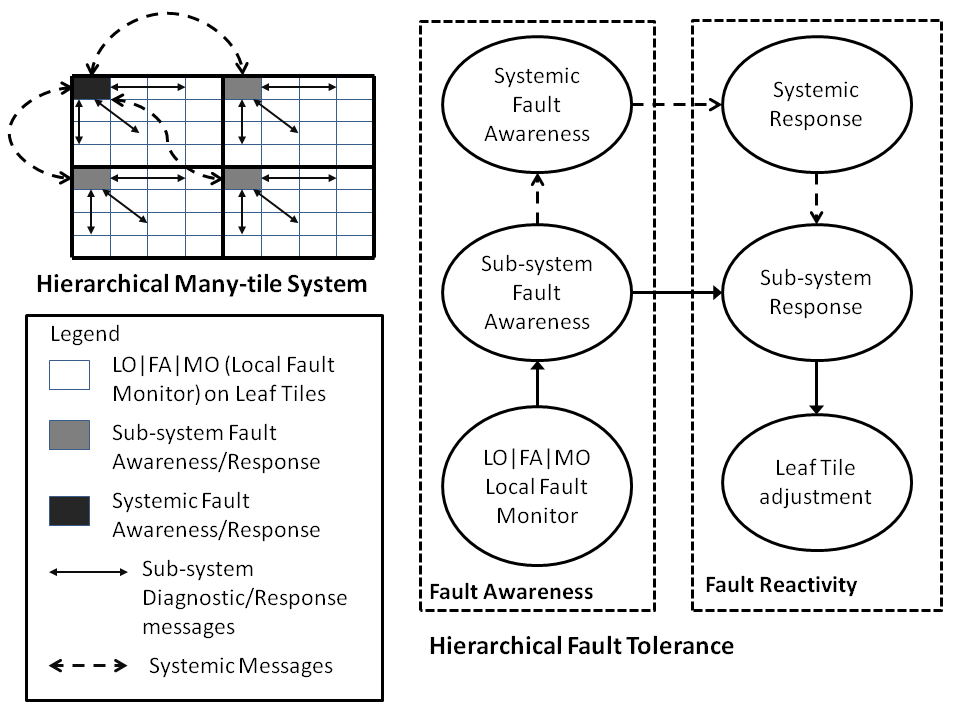
In this section we establish a basic terminology to describe a fault (and critical event) tolerant system, which will be used in the following sections of this document. First of all, from now on we will use fault as abbreviation for fault and critical event. Then, we split the fault-tolerance problem in two major key areas: fault awareness and fault reactivity:
-
•
Fault awareness is the capability of the system to assess its own health status, in order to acknowledge faults that have already appeared or to make guesses about those likely to occur. Going bottom-up, this ’introspection’ can be reduced to two aspects:
-
–
Local fault detection, the capability of a device to perform a number of HW and SW tests to detect a condition of fault in itself or other contiguous devices.
-
–
Systemic fault awareness, the collation of diagnostics propagated throughout the whole network by the local detecting sub-systems to compose a global picture of the system’s health.
-
–
-
•
Fault reactivity is the range of initiatives that the system enacts, under the presumptions it can make when its own global health is known to it, to prevent a fault situation which is about to occur or to gracefully degrade its performance instead of bringing the whole system to a stop when the fault has occurred. Going top-down, this ’self-adjustment’ can be reduced to two aspects:
-
–
Systemic response, the set of strategies that the system can choose to apply, following inferences that it can make from its own diagnostic self-image, to prevent and counter the faults.
-
–
Local readjustment, the set of readjustments that can be locally enacted to prevent and counter the faults, e.g. reduction in clock frequency, changes to the routing tables to bypass a faulty link, remapping the assignment of tasks to nodes, etc..
-
–
It is clear that a complete design of a fault-tolerant architecture must give detailed specifications in each of the abovementioned areas. On the other hand, the challenging part for the most interesting fault-tolerant features is the actual implementation, which cannot be detached from a low-level specification of the host architecture. For example, task migration capabilities are derived from process management features of the host operating system; application checkpointing is strictly bound to storage options available to the host node; protection from memory errors by ECC is a low-level addition to the host memory architecture, etc..
Our idea with LO|FA|MO is that of a fault-tolerant framework which is as host-agnostic as possible. By encapsulating as many features as can be accommodated independently from such host specifications in LO|FA|MO, we strive to achieve a clear separation of problems - with the hope this leads to easier solution - and a degree of design reuse.
By saying this, we make clear from the start that LO|FA|MO, by its very nature, has to be restricted to the side of fault-awareness.
III Fault awareness: global scenario hypotheses
We give here a sketch of an architecture where LO|FA|MO is employed. We assume a computing mesh where every node is a combination of the hardware supporting LO|FA|MO, i.e. a DNP (Distributing Network Processor), mated to a host processing element; beyond the communication facilities provided by the DNP, the host exposes another communication interface towards an auxiliary ’service network’ (more details in section III-D).
Failures can generally be of commission and omission type: the former encompasses the case of failing elements performing their tasks in an incorrect or inconsistent way (e.g. corruption in node memory, corruption in transmitted messages, packet misrouting, etc.); the latter deals with the case of failing elements skipping their tasks altogether (e.g. node stops responding due to crash failure, power outage or burn-out, message passing does not progress due to link disconnection, etc.).
The most general kind of faults are those where the behaviour of a faulty component is assumed to possibly be completely random as to its correctness; in literature, fault-tolerance to this kind of faults is defined Byzantine fault-tolerance[6]. Byzantine failures can be seen as undetectable commission failures or, where possible, as malicious activity by some agent which is trying to sabotage the network. This kind of failures is explicitly not covered here.
With this restriction, detectable commission failures signal either a component that is about to break or keeps on working wrong, while omission failures, when permanent, mostly stand for an already broken or disconnected component.
In this picture, the LO|FA|MO design is charged of polling the supplied sources of diagnostic data; any inconsistent value, be it any value beyond a certain threshold or a timed-out update of a watchdog counter, is a failure to report. LO|FA|MO attempts then to push this report along the service network - which means, in emergency cases, leaning against the neighbouring DNP’s - towards an upper layer Fault Supervisor.
As per previous definitions, we remark that the only behaviours LO|FA|MO foresees for a failing component are two:
-
•
sick - the component has a rate of detected commission failures beyond the compatibility threshold of normal operativity this may need action;
-
•
failed - the component has a permanent commission failure (it keeps on working wrong) or simply stops participating in the network, i.e. it has a permanent omission failure (it has broken) this needs action.
III-A EURETILE Platforms terms and definitions
Here we introduce a few concepts about the EURETILE platforms and we
define the terms used in the following sections to refer to the
platform components.
|
EURETILE
architecture |
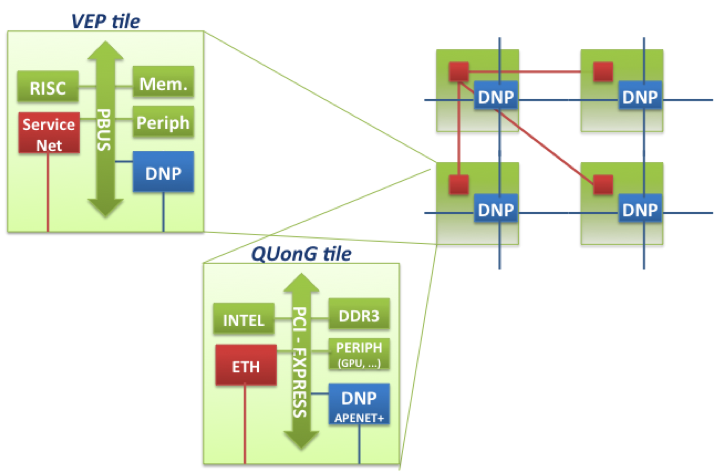
A many-tile system, where the elementary HW tile is a multi-processor, which includes a Distributed Network Processor (for inter-tile communication), a Host processor (for control, user interface and sequential computations), and a floating-point numerical engine (for high intensity arithmetic computations), potentially disjointed from the Host processor. |
| DNP | Distributed Network Processor, the component implementing the 3D torus interconnection network between the tiles, providing RDMA support for data transfers. The two implementations of the DNP are: • APEnet+, an FPGA-based card for low latency, high bandwidth direct network interconnection, supporting state-of-the-art wire speeds and providing a PCIe X8 Gen2 interface[7]; • DNP-VEP, a SystemC TLM model of the DNP for the Virtual EURETILE Platform (see below). The DNP Core is the internal DNP logic, including the routing logic and the RDMA engine; it does not include the links and the Bus interface. The functionalities of the DNP core are likewise implemented both in DNP-VEP and in APEnet+. |
| Host | The processor in the tile running the OS and interfacing with the DNP and the peripherals through a Bus. |
| Virtual EURETILE Platform | The EURETILE simulation platform, integrated with the SW toolchain and available to run applications and to collect profiling data. This platform implements the EURETILE architecture with a basic tile that includes: a RISC-like Host processor, a SystemC model of the DNP (DNP-VEP), an external memory and a number of peripherals. |
| QUonG HPC Platform | The EURETILE demonstration hardware platform, whose basic tile includes: an x86-64 multiprocessor as Host, an APEnet+ card and a GPU as floating-point accelerator. [8]. |
In figure 2 the two flavours of the EURETILE tile are schematically shown; we stress on the fact that their connectivity is ensured either by the DNP to create the 3D torus topology and by a Service Network for the diagnostic purposes described in section III-D.
III-B Local fault monitor
The Local Fault Monitor (LO|FA|MO) is the mechanism chosen to obtain
the fault-awareness; it implements health self-tests for a number of
hardware devices and takes care of propagating the deriving
information. Moreover, the devices are able to monitor other
contiguous devices and communicate their faulty status.
Synthetically, each device is able to:
-
•
check/elaborate/store/transmit its own status;
-
•
monitor other contiguous devices.
In the EURETILE platform, the actors of the described mechanism are
the DNP/APEnet+ and the Host sub-system (Intel for the QUonG platform, a RISC-like model for the Virtual EURETILE Platform).
The DNP is able to run self-tests on its own links and logic, as well
as to retrieve information from its own temperature and
electrical sensors. All information pertaining to the sub-systems status is
gathered by the LO|FA|MO-appointed component inside the DNP itself and
stored in a DNP WatchDog register (see IV-A). A second
register inside the DNP is dedicated to the surveillance of the health
status of the Host, with LO|FA|MO performing periodic checks of the
Host WD register.
In the event the Host on one or more nearest neighbouring nodes were
faulty, a third register, the Host Remote Fault descriptor register,
would end up containing information about the nature of the remote
fault.
The self-test capabilities of the DNP links and logic allow mutual
monitoring between nearest neighbour DNP’s, all of them acting as
watchdog for one another.
The key points for this LO|FA|MO implementation are:
-
•
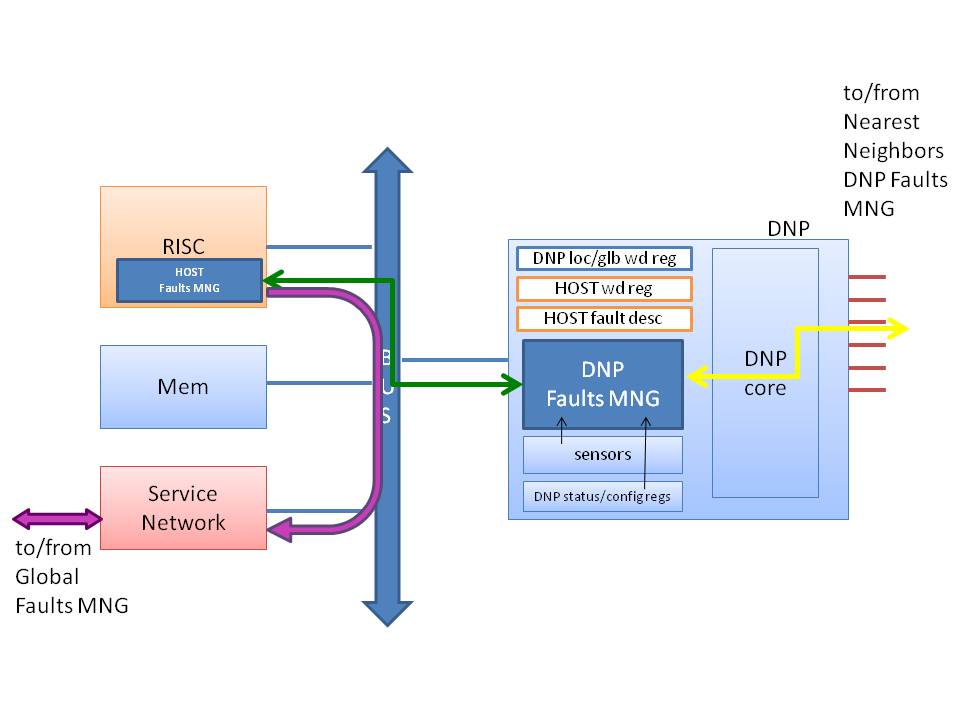
the presence of a Host Fault Manager (Host FM), a software process running on the Host that is aware of the Host local status, is able to read/write the DNP internal registers and the DNP local/global and Host watchdog registers and can send messages through the Service Network.
-
•
the presence of a DNP Fault Manager (DNP FM), a component residing on the DNP that is able to collect the information about the DNP health status, to read/write the DNP local/global and Host watchdog registers and to send messages through the 3D Network.
Figure 3 illustrates the basic platform configuration
detailing the position and the communication paths of the Host Fault
Manager and the DNP Fault Manager.
Keeping to the definitions given above, the task of LO|FA|MO thus encloses the whole of Local fault detection and the interface to the Fault Awareness system.
III-C Fault Supervisor
The Fault Supervisor is the generic term that encompasses the set of
processes receiving the output of the LO|FA|MO machinery; its duty is
to create systemic Fault Awareness and to issue appropriate systemic
Fault Responses.
For a small number of nodes, the Fault Supervisor could be implemented
as a single software process running on an appointed ’master node’ of
the system; for larger systems, a process cloud residing on a subset
of nodes participating in a hierarchy would certainly be more
scalable.
The Fault Supervisor is kept timely fed by the set of DNP Local
Fault Managers and Host Local Fault Managers, with periodic updates about their health.
This supervisor is the ’systemic intelligence’ that embodies the fault
awareness for the system and drives its response; all information (or
lack thereof, in case of omission failures from faulty nodes, which is
information as well) is brought by the LO|FA|MO network to the Fault
Supervisor system, so that it can choose any fault prediction,
prevention and reaction strategy it deems feasible.
The Fault supervisor is a critical component about which, in the
following, we dismiss to provide any more details. This document describes only the LO|FA|MO mechanism and its specific implementation on the QUonG and VEP Platforms; we acknowledge
its presence - after all, it is the target of all communications from
LO|FA|MO- but we are agnostic about anything regarding its
implementation.
III-D Service network
Besides APEnet+’s high speed 3D mesh, LO|FA|MO expects the system nodes to partake in a secondary, diagnostic-dedicated network fabric to which only the Host has access. In ordinary conditions, the DNP relays the gathered diagnostic data to its Host companion which, through this network, in turn relays them to the Fault Supervisor. In this way, the high speed network is unencumbered from dealing with the added traffic of the health status reports.
We expect this service network to be a relatively inexpensive local interconnect. On the HPC market, Ethernet is a mature technology, mostly ubiquitous presence for any architecture we think to match the APEnet+ board with - e.g., our QUonG platform cluster node prototype is a Supermicro® board equipped with dual Gbit Ethernet. For this reason, the presence of such service network is regarded as a rather unconstraining addition on the HPC flavour of the EURETILE architecture. On many-tile embedded systems, represented in our case by the VEP platform, we maintain at this stage open the definition of the service network.
We are positing that the bulk of diagnostic data does need neither high bandwidth nor extremely low latency. This means that performance concerns are not overtly constraining in the building of this service network and all effort can be instead put in pushing its reliability, by means of ruggedness of components (for the switches, routers, NICs, cabling, etc.) or some kind of redundancy; reliable Ethernet is a wide ranging subject with many possible approaches[4].
However, this diagnostic network is a system element itself subject to failure. So, the problem must be raised of how to deliver fault awareness data in presence of criticality of the service network itself or the DNP’s. First, we analyze the case of Host and DNP not affected by simultaneous fail, then the case of simultaneous fail of the DNP and Host on a tile. The hypothesis we put forward is that the probability for a node of Host and DNP simultaneously failing is significantly smaller than their individual failure rate. This means that having the host and the DNP mutually cross-checking each other, LO|FA|MO has meaningful escape routes in both of the following scenarios:
-
•
the DNP breaks down the DNP does not respond to queries from the Host - the Host acknowledges the omission fault and signals it via the service network to the Fault Supervisor (this does not differ from the ordinary condition).
-
•
the Host breaks down the Host does not respond to queries from the DNP - although from that node the service network is inaccessible, the DNP has a last chance of relaying its reports along to its neighbours in the high-speed 3D mesh and from there, all receiving DNP’s can relay the data to their own Host and then on to the Fault Supervisor.
Moreover, even in the showstopping event of both Host and DNP breaking down in a node, the system has a way to become aware of the situation: no more activity from the node means that all the neighbouring nodes in the 3D mesh become eventually aware of a permanent omission fault in one of their channels; as soon as reports of this fact reach the Fault Supervisor, this latter can infer the node has died and take relevant action.
III-E Watchdog implementation
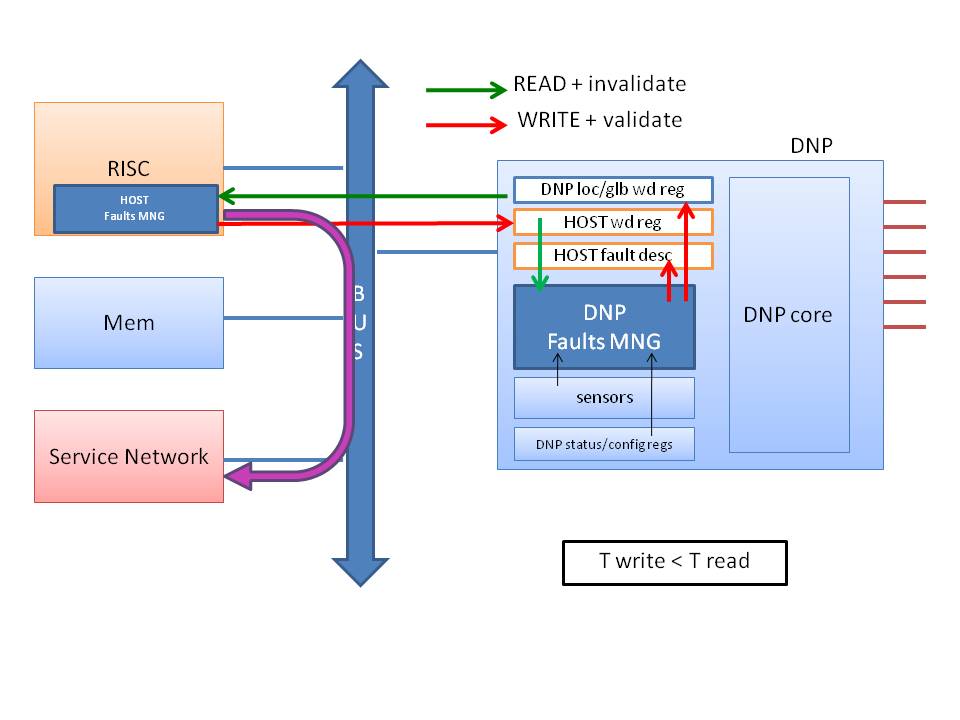
One of the foundation of the LO|FA|MO design is the mutual watchdog mechanism, that for the EURETILE platform is implemented in the following way: the DNP acts as watchdog for the Host, i.e. it periodically monitors the Host status as reported in the Host watchdog register updated by the Host itself; the Host acts as watchdog for the DNP, i.e. it periodically monitors the DNP status as reported in the DNP Local/Global watchdog register updated by the DNP itself. Although both the mentioned registers are located inside the DNP they are written (updated) and validated by their ’owner’ and read and invalidated by the other device. Validation/invalidation consists of setting the Valid Bit to 1 or 0, respectively. The update period is such that , in this way is guaranteed that the reader always founds a valid status and viceversa, unless a destructive omission fault occurs that makes the writer unable to update its status register (see section IV-B).
| Fault class | Faulty Elem. | Faults | Detector | Diagnostic info storage | Diagnostic info path |
| DNP side | Link | Link sick (CRC errs) | receiving Link self-test receiving DNPfm | bits in DNP loc/glb wd register | DNPfm Host Service Net |
| Link broken | DNPfm on both the receiving and transmitting side (if link logic still working), otherwise on a single side | ||||
| DNP ∘C/W/V alert | Temperature over/under threshold | Sensors DNPfm | bits in DNP loc/glb wd register | ||
| Power over/under threshold | |||||
| Voltage over/under threshold | |||||
| DNP logic | DNP core sick | DNPfm | bits in DNP loc/glb wd reg | Host Service Net | |
| DNP core meltdown | Host (DNPfm misses to update DNP loc/glb wd register) | bit in DNP loc/glb wd reg | |||
| Host side | Host fault | Memory, Peripherals (…, Service Net) | Machine dependent but managed by the Host_fm | Spare room in HOST watchdog register | |
| DNP 3D net Neighbour DNPfm Neighbour Host Service Net | |||||
| Bus or total Host breakdown | DNPfm (Host misses to update HOST wd reg) | bit in RISC wd reg |
IV Implementation Details
IV-A LO|FA|MO Status Registers
There are three key registers used by the LO|FA|MO components:
-
•
DNP Local/Global watchdog register. It contains information about: 1- the status of the local DNP and 2- the status of the Hosts on first neighbouring tiles;
-
•
Host watchdog register. It contains the local Host status;
-
•
Host Remote Fault descriptor register. In case of one or more Host(s) on first neighbour tiles are faulty, it contains information about the nature of the fault.
For the complete description and layout of these registers refer to the tables III, IV,
V, while in section IV-B their
use is detailed.
Table VII provides the encoding for the
APEnet+ Temperature register and the corresponding value for the FPGA temperature as measured by the internal sensor.
| DNP local/global watchdog register | |||
|---|---|---|---|
| # bits | bit range | field name | Description |
| 1 | 0 | Valid | 1 : register content valid; 0 : register content not valid |
| 1 | 1 | Host Z- | Status of the first neighbour hosts, 1: fails; 0 : healthy; |
| 1 | 2 | Host Z+ | |
| 1 | 3 | Host Y- | |
| 1 | 4 | Host Y+ | |
| 1 | 5 | Host X- | |
| 1 | 6 | Host X+ | |
| 2 | 7-8 | DNP core status | 00: normal; 01: sick; ?? |
| 2 | 9-10 | Power Consumption status | 00: normal; 01: warning; 10: alarm |
| 2 | 11-12 | Voltage status | 00: normal; 01: warning; 10: alarm |
| 2 | 13-14 | Temperature status | 00: normal; 01: warning; 10: alarm |
| 2 | 15-16 | Link Z- | Link status; 00: normal; 01: sick; 10: broken |
| 2 | 17-18 | Link Z+ | |
| 2 | 19-20 | Link Y- | |
| 2 | 21-22 | Link Y+ | |
| 2 | 23-24 | Link X- | |
| 2 | 25-26 | Link X+ | |
| 5 | 27-31 | Empty | |
| Host watchdog register | |||
|---|---|---|---|
| # bits | bit range | field name | Description |
| 1 | 0 | Valid | 1 : register content valid; 0 : register content not valid |
| 2 | 1-2 | Service Net Status | Status of the Service Network; 00: normal; 01: sick; 10: broken; |
| 2 | 3-4 | Memory Status | Status of Memory; 00: normal; 01: sick; 10: broken; |
| 2 | 5-6 | Peripheral 0 status | Status of Peripheral 0; 00: normal; 01: sick; 10: broken; |
| 2 | 7-8 | Peripheral 1 status | Status of Peripheral 1; 00: normal; 01: sick; 10: broken; |
| 23 | 9-31 | Empty | |
| Host remote fault descriptor register | |||
|---|---|---|---|
| # bits | bit range | field name | Description |
| 1 | 0 | Z- Service Net Status | Status of the Service Network; 0: normal; 1: broken; |
| 1 | 1 | Z- Memory Status | Status of Memory; 0: normal; 1: broken; |
| 1 | 2 | Z- Peripheral 0 status | Status of Peripheral 0; 0: normal; 1: broken; |
| 1 | 3 | Z- Peripheral 1 status | Status of Peripheral 1; 0:normal; 1: broken; |
| 1 | 4 | Z+ Service Net Status | Status of the Service Network; 0: normal; 1: broken; |
| 1 | 5 | Z+ Memory Status | Status of Memory; 0: normal; 1: broken; |
| 1 | 6 | Z+ Peripheral 0 status | Status of Peripheral 0; 0: normal; 1: broken; |
| 1 | 7 | Z+ Peripheral 1 status | Status of Peripheral 1; 0:normal; 1: broken; |
| 1 | 8 | Y- Service Net Status | Status of the Service Network; 0: normal; 1: broken; |
| 1 | 9 | Y- Memory Status | Status of Memory; 0: normal; 1: broken; |
| 1 | 10 | Y- Peripheral 0 status | Status of Peripheral 0; 0: normal; 1: broken; |
| 1 | 11 | Y- Peripheral 1 status | Status of Peripheral 1; 0:normal; 1: broken; |
| 1 | 12 | Y+ Service Net Status | Status of the Service Network; 0: normal; 1: broken; |
| 1 | 13 | Y+ Memory Status | Status of Memory; 0: normal; 1: broken; |
| 1 | 14 | Y+ Peripheral 0 status | Status of Peripheral 0; 0: normal; 1: broken; |
| 1 | 15 | Y+ Peripheral 1 status | Status of Peripheral 1; 0:normal; 1: broken; |
| 1 | 16 | X- Service Net Status | Status of the Service Network; 0: normal; 1: broken; |
| 1 | 17 | X- Memory Status | Status of Memory; 0: normal; 1: broken; |
| 1 | 18 | X- Peripheral 0 status | Status of Peripheral 0; 0: normal; 1: broken; |
| 1 | 19 | X- Peripheral 1 status | Status of Peripheral 1; 0:normal; 1: broken; |
| 1 | 20 | X+ Service Net Status | Status of the Service Network; 0: normal; 1: broken; |
| 1 | 21 | X+ Memory Status | Status of Memory; 0: normal; 1: broken; |
| 1 | 22 | X+ Peripheral 0 status | Status of Peripheral 0; 0: normal; 1: broken; |
| 1 | 23 | X+ Peripheral 1 status | Status of Peripheral 1; 0:normal; 1: broken; |
| 8 | 24-31 | empty | |
| NAME | DNP-VEP reg | APEnet+ reg | Description | ||
| address | mask | reg number | mask | ||
| LO|FA|MO DNP local/global watchdog | 0x00000ec0 | 0x07ffffff | TBD | TBD | DNP local/global watchdog |
| LO|FA|MO Host watchdog | 0x00000ec4 | 0x000001ff | TBD | TBD | Host local watchdog |
| LO|FA|MO Host remote fault descriptor | 0x00000ec8 | 0x00ffffff | TBD | TBD | Host remote fault descriptor |
| Temperature | 0x00000f40 | 0x000000ff | 54 | 0x0000ff00 | Temperature value |
| Power consumption | TBD | TBD | TBD | TBD | Power consumption value |
| Voltage | TBD | TBD | TBD | TBD | Voltage value |
| Temp thresholds | 0x000000f00 | 0xffffffff | TBD | 0xffffffff | Boundaries for the normal, warning, alarm temperature ranges |
| Power thresholds | TBD | 0xffffffff | TBD | 0xffffffff | Boundaries for the normal, warning, alarm power consumption ranges |
| Voltage thresholds | TBD | 0xffffffff | TBD | 0xffffffff | Boundaries for the normal, warning, alarm temperature ranges |
| Maxhops | 0x00000008 | 0x000000ff | 46 | 0x000000ff | Set the maximum number of hops |
| Router exceptions |
0x00000140
0x00000144 |
0xffffffff
0x00003fff |
29 | 0x0000002f | Router status/exceptions |
| Channel XP exceptions | 0x00000440 | 0x000000ff | 35 | 0xfe000000 | Link status/exceptions |
| Channel XM exceptions | 0x00000540 | 0x000000ff | 36 | 0xfe000000 | Link status/exceptions |
| Channel YP exceptions | 0x00000640 | 0x000000ff | 37 | 0xfe000000 | Link status/exceptions |
| Channel YM exceptions | 0x00000740 | 0x000000ff | 38 | 0xfe000000 | Link status/exceptions |
| Channel ZP exceptions | 0x00000840 | 0x000000ff | 39 | 0xfe000000 | Link status/exceptions |
| Channel ZM exceptions | 0x00000940 | 0x000000ff | 40 | 0xfe000000 | Link status/exceptions |
| RDMA Exception | 0x00000240 | 0x000000ff | 0 | 0x00000002 | RDMA status |
| ENGINE Exceptions | 0x000000c0 | 0x00000fff | N.A. | N.A. | ENGINE status/exceptions |
| PCI Exceptions | N.A. | N.A. | 9 | 0xffffffff | PCI status/exceptions |
| Value (hex) | FF | E4 | D5 | D0 | B2 | 9E | 8A | 80 | 76 | 6C | 62 | 4E | 3A |
|---|---|---|---|---|---|---|---|---|---|---|---|---|---|
| Temp (∘C) | 127 | 100 | 85 | 80 | 50 | 30 | 10 | 0 | -10 | -20 | -30 | -50 | -70 |
IV-B Fault Detection/Signaling Hypothesis
In this section we list the faults and critical events managed by the EURETILE
implementation of the LO|FA|MO design. For each fault listed, we provide two paragraphs: 1- Fault description: how it is detected (which component is in
charge of detecting such fault) and 2- Fault detection: how the information is conveyed
upwards to obtain the systemic Fault Awareness.
| DNP Link sick |
Fault description: A malfunction of the physical
channel (e.g. the cable is damaged, incorrectly plugged in, a source
of interference is in its range, etc.) can lead to errors during
packets transmission, resulting in data corruption (commission
fault). APEnet+ link logic implements Cyclic Redundancy Check with
the CRC-32 IEEE standard polynomial: for packet sizes from 256 bits up
to 65792, which are the minimum and maximum sizes that APEnet+ transmits, this CRC is able to detect a maximum number of
errors111The number of errors are here identified by the
Hamming distance between the corrupted and the uncorrupted messages,
i.e. the number of flipped bits. that ranges from 6 down to 2[5]. The
error detection is performed by the receiving DNP
card. A link is considered sick when the ratio between the number of
errors and the number of packets received by that link overruns a
given (programmable) threshold.
Fault detection: It is detected by the DNP links self-test logic on the receiving side, that signals the faulty (number of errors over threshold) situation to the DNP fault manager. The information is stored in the DNP local/global watchdog register where it is caught by the Host during the periodical DNP monitoring operated by the local Fault Supervisor. As the DNP 3D network is affected by this fault the local FS can communicate the faulty status to the other nodes via the Service Network. |
| DNP Link broken |
Fault description: The physical channel is severed (e.g. cable unplugged or broken) or there is a total failure of the link logic on
(just) one the two transferring sides (RX, TX) preventing the message
to be transmitted (omission fault). This situation can be diagnosed by
the link logic (when correctly operating) because the operativity of
the physical channel implies a handshaking protocol between the RX
and TX sides. As a consequence, a broken cable can be detected by
both the receiving and transmitting DNP.
Fault detection: It is detected by the DNP links self-test logic both on the receiving and transmitting side, that signal the faulty situation to the DNP fault manager. The information is stored in the DNP local/global watchdog register where it is caught by the Host during the periodical DNP monitoring operated by the local Fault Supervisor. As the DNP 3D network is affected by this fault the FS can communicate the faulty status to the other nodes via the Service Network. |
|
DNP Temperature
over/under threshold |
Fault
description: APEnet+ provides a sensor measuring the FPGA die
temperature. This information can be both routed to
the board’s control devices and to into the FPGA itself. At the
moment a control
logic is implemented as part of the DNP core to convey this
temperature information to a DNP register encoded as shown in
table VII. Four thresholds can be defined for the
temperature on the basis of the reference temperature limits for
correct operativity, in order to set the boundaries for the ranges of:
normal operativity, warning needed for over/under conditions and alarm
raised. The LO|FA|MO design makes APEnet+ able to check the
temperature and detect and signal an over-under-threshold
situation.
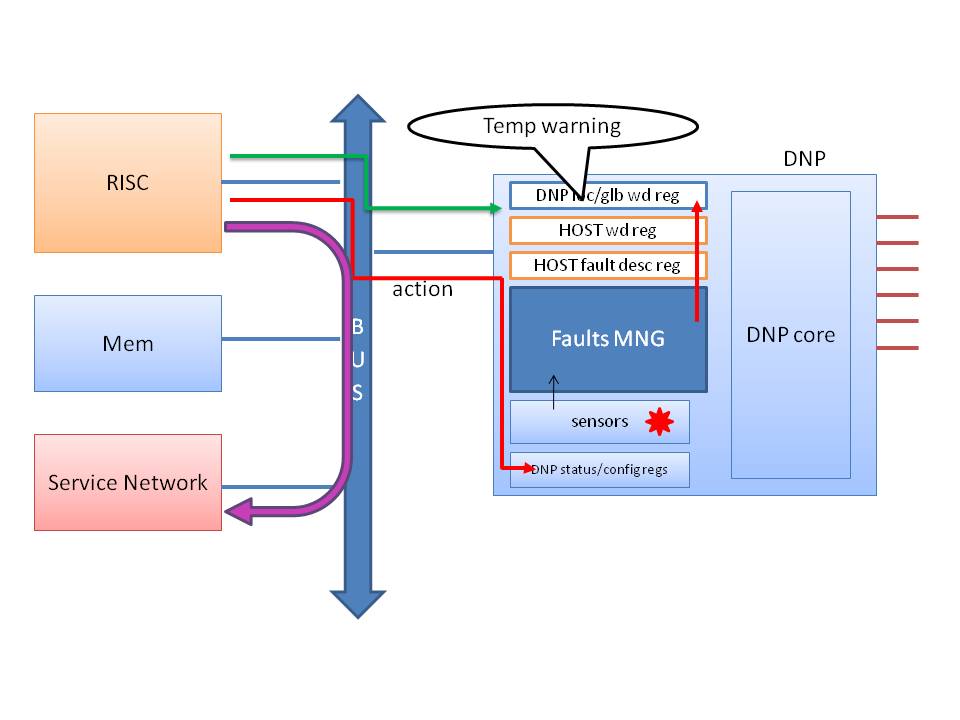
Fault detection: The DNP Local Fault Manager checks the DNP temperature status and therefore periodically sets (together with the other DNP Status information ) the Temperature Status fields in the DNP Local/Global register, which is periodically monitored by the Host Fault Manager (see Watchdog mechanism specification in section III-E). In this way the Host Fault Manager can become aware of the warning or alarming temperature status of the local DNP and send messages to the Fault Supervisor through the Service Network (see figure 5). |
| DNP Power over/under threshold | Fault description and Fault Detection: Similar to the DNP Temperature over/under threshold case. |
|
DNP Voltage
over/under threshold |
Fault description and Fault Detection: Similar to the DNP Temperature over/under threshold case. |
| DNP core sick |
Fault description: One or more fault in the DNP core internal logic that
cause commission. Typical faults involve the routing
logic (e.g. a symptom of this kind of fault can be for example an
overthreshold number of
hops) or the RDMA engine. Each of this faults has a related
Exception Register in the DNP register file, so we consider sick a DNP
that has raised an exception.
Fault detection:In case that one or more faults in the DNP core logic that cause exceptions, the DNP Local Fault Manager set fields in the DNP Local/Global Status register. This sick status is periodically checked by the Host Fault Manager that can communicate this faulty status (and more detailed information that it can retrieve by the DNP registers) to other nodes via the Service Network. |
|
DNP core
meltdown |
Fault description: A fault in the DNP
core internal logic that causes DNP operativity to be totally and fatally
compromised.
This kind of fault can be detected by the DNP fault manager component
inside the DNP itself in case it is still healthy or by the Host
thanks to the watchdog
mechanism described in section III-E.
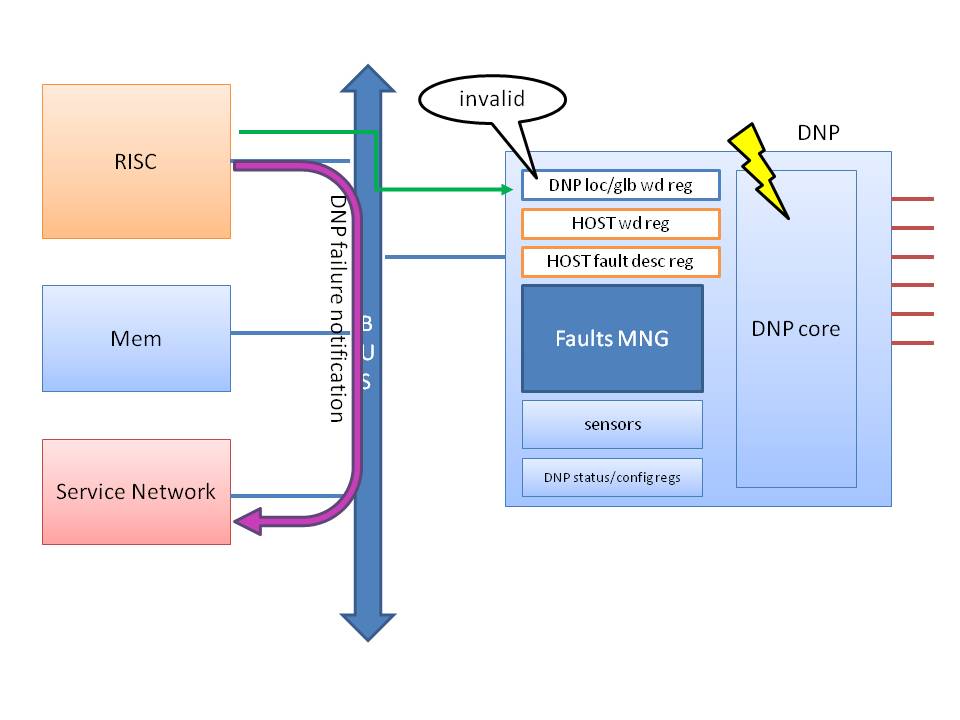
Fault detection: A fatal fault causes the DNP Local Fault Manager to stop its periodic status report in the DNP Local/Global Status register. The Host Fault Manager can detect this situation (see Watchdog mechanism specification in section III-E) and signal the fault at global level by sending messages via the Service Network (see figure 6). |
| HOST Memory, Peripherals (Service Network, …) broken |
Fault
description: Any possible commission fault (on
the Host side) that the Host itself can detect or become aware of. By
definition, these faults are platform-dependent and can be included in
the watchdog fault detection mechanism as described in section
III-E.
Fault detection: In case one or more Host Peripherals (DNP excluded) have a fault or are broken the Host Local Fault Manager should be able to detect the problem and communicate the faulty status to the upper hierarchy layers of the Fault Supervisor via the Service Network, when not faulty, or the 3D network. To use the 3D network diagnostic info path, the Host Local Fault Manager writes the Host Watchdog register signaling the faulty devices. The DNP Fault Manager that periodically checks this register becomes aware of the faults and prepare a diagnostic info packet to be sent through the 3D network. Once received by the neighbouring DNPs the information is reported as follows: a bit is raised in the Global fields of the DNP Watchdog register showing the direction of the faulty neighbour node; the proper field is set in the Host Remote Fault Descriptor register to convey the type of fault and/or the device affected by it. |
| Total HOST breakdown and/or bus broken |
Fault description:
Any fault on the Host side that causes a Host omission failure. In
this category we also include Bus omission faults because from the
DNP point of view a broken Bus and a completely non operating Host
do not differ, as both these situations are detected by the watchdog
mechanism as a lack of activity from the Host side (see section
III-E).
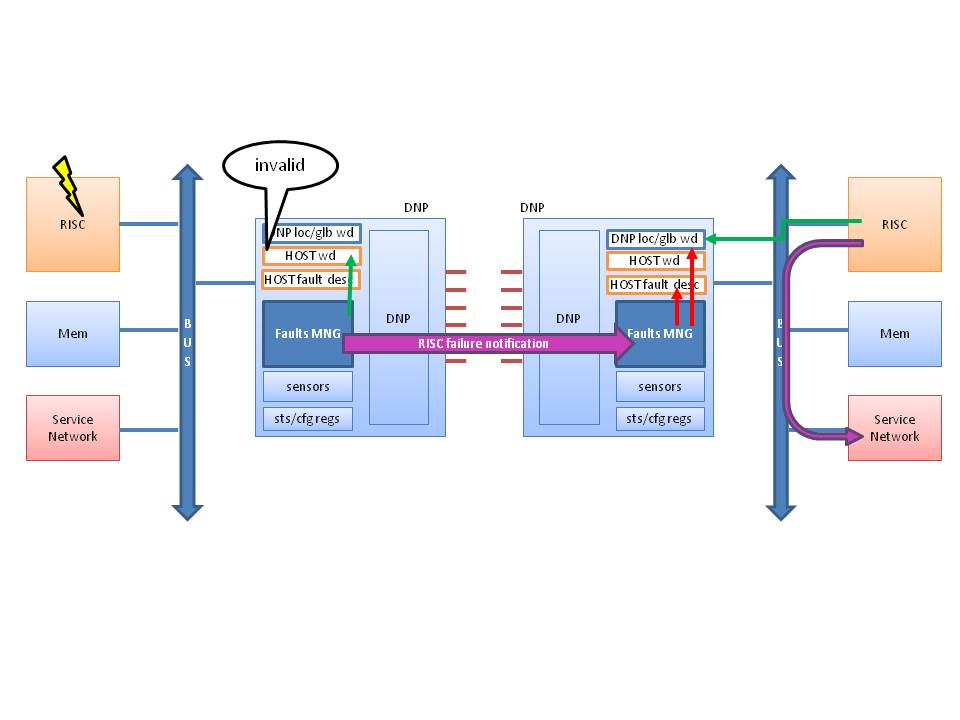
Fault detection: A fault that jeopardizes the ability of the Host to update the Host Watchdog register is easily detected by the DNP Fault Manager that reads a not valid status on that register and sends diagnostic a diagnostic packet to the DNP’s first neighbours. The information is received and processed by the neighbouring DNP Fault Managers marks in their DNP watchdog registers the fields corresponding to the faulty node. In this way the Host Fault Manager that monitors that register can become aware of the situation and send packets to upper hierarchy layers of the Fault Supervisor via the Service Network (see figure 7). |
Acknowledgment
This work was supported by the EU Framework Programme 7 project EURETILE under grant number 247846.
References
-
[1]
P.M. Kogge (editor), Exascale Computing Study:
Technology Challenges in Achieving Exascale Systems, Univ. of Notre
Dame, CSE Dept. Tech. Report TR-2008-13, Sept. 28,
2008,
http://www.cse.nd.edu/Reports/2008/TR-2008-13.pdf -
[2]
E. Elnozahy, Systems resilience at Extreme
Scale, DARPA, Tech. Rep.,
2009,
http://institutes.lanl.gov/resilience/docs/IBM%20Mootaz%20White%20Paper%20System%20Resilience.pdf - [3] M.J. Savage, Nuclear Physics from QCD: The Anticipated Impact of Exa-Scale Computing, arXiv:1012.0876v1.
- [4] M. Golash, Reliability in ethernet networks: A survey of various approaches, Bell Labs Technical Journal, Vol. 11, Issue 3, pp. 161-171, Autumn (Fall) 2006.
- [5] G. Castagnoli, S. Br’́auer, M. Herrmann, Optimization of cyclic redundancy-check codes with 24 and 32 parity bits, IEEE Trans. on Comm., 42 no.6, June 1993
- [6] M. Castro and B. Liskov, Practical Byzantine Fault Tolerance and Proactive Recovery, ACM Transactions on Computer Systems, v. 20 n. 4, pp. 398-461, 2002.
- [7] R. Ammendola, A. Biagioni, O. Frezza, F. Lo Cicero, A. Lonardo, P. Paolucci, R. Petronzio, D. Rossetti, A. Salamon, G. Salina, F. Simula, N. Tantalo, L. Tosoratto, P. Vicini APEnet+: a 3D toroidal network enabling Petaflops scale Lattice QCD simulations on commodity clusters, proceedings of The XXVIII International Symposium on Lattice Field Theory PoS(Lattice 2010)022 and arXiv:1012.0253v1
- [8] R. Ammendola, A. Biagioni, O. Frezza, F. Lo Cicero, A. Lonardo, P. S. Paolucci, D. Rossetti, F. Simula, L. Tosoratto, P. Vicini, QUonG: A GPU-based HPC System Dedicated to LQCD Computing, Application Accelerators in High-Performance Computing, Symposium on, pp. 113-122, 2011 Symposium on Application Accelerators in High-Performance Computing, 2011, http://doi.ieeecomputersociety.org/10.1109/SAAHPC.2011.15