Transition between mechanisms of laser-induced field-free molecular orientation
Abstract
The transition between two distinct mechanisms for the laser-induced field-free orientation of CO molecules is observed via measurements of orientation revival times and subsequent comparison to theoretical calculations. In the first mechanism, which we find responsible for the orientation of CO up to peak intensities of W/cm2, the molecules are impulsively oriented through the hyperpolarizability interaction. At higher intensities, asymmetric depletion through orientation-selective ionization is the dominant orienting mechanism. In addition to the clear identification of the two regimes of orientation, we propose that careful measurements of the onset of the orientation depletion mechanism as a function of the laser intensity will provide a relatively simple route to calibrate absolute rates of non-perturbative strong-field molecular ionization.
Laser-induced field-free molecular alignment has become a routine tool in studies of ultrafast dynamics of small molecules Stapelfeldt and Seideman (2003), ranging from experiments on attosecond dynamics Krausz and Ivanov (2009) and high-harmonic generation Kanai et al. (2005) to the investigations of coupled electronic-vibrational dynamics Bisgaard et al. (2009). In this technique, a strong but non-ionizing ultrafast laser field is used to give an impulse torque to the molecules via the polarizability interaction. After the pulse is over, the dominant axis of polarizability of molecules briefly aligns along the polarization direction of the laser as the molecules undergo quantum rotational revival dynamics, thereby effectively allowing experiments to be carried out in the molecular frame. However, for all its success, laser-induced alignment does not differentiate between the two different polarities of polar molecules. Thus, when applied to polar molecules, for example CO, the bond axis can be aligned in space but the direction in which the C or O ends point is not controlled. Achieving control over this latter property, called molecular orientation, has proved to be a most challenging experimental task. Field-free orientation was initially generated using a combination of lasers and static electric fields Goban et al. (2008); Ghafur et al. (2009); Holmegaard et al. (2010). It was only recently that an all-optical, and hence simpler, technique for laser-induced field-free molecular orientation had been demonstrated first in Refs. De et al. (2009); Oda et al. (2010) followed by Ref.Frumker et al. (2012). Although these experiments all relied on the use of a two-color pump pulse comprised of the fundamental frequency and its second harmonic to orient ensembles of molecules, they offered differing interpretations for the underlying mechanism leading to orientation. The first two studies De et al. (2009); Oda et al. (2010) attributed the orientation to the hyperpolarizability (HP) interaction Kanai and Sakai (2001), while the third Frumker et al. (2012) claimed that an ionization depletion (ID) mechanism Spanner et al. (2012) was active.
Here we report on the experimental observation of a transition between the two proposed mechanisms, thereby connecting the two differing interpretations offered in Refs.De et al. (2009); Oda et al. (2010) and Frumker et al. (2012). We present intensity-dependent measurements of the laser-induced orientation of CO and compare them to recent theoretical predictions by Spanner et al, considering both the HP and the ID mechanisms Spanner et al. (2012). By comparing the measured and calculated temporal structures of the revivals of orientation, we unambiguously assign the regimes of the HP and ID mechanisms. This assignment based on the temporal structure of the revivals is further supported by the intensity dependence of the maximum orientation, which displays a sharp change in slope as the ID mechanism becomes active. For CO molecules, we find that at intensities below W/cm2 the HP mechanism is responsible for orientation, while the ID mechanism becomes dominant at higher intensities. In addition, we find that the ID mechanism is responsible for generating the highest degrees of orientation we observe.
The two-color method of laser-induced orientation uses a pump pulse created by combining a linearly polarized pulse at its fundamental () and second harmonic frequency (2). The symmetry along the polarization axis of the resulting field depends on the phase delay between the two frequency components. Breaking this symmetry is the key to the orientation of heteronuclear molecules. The experimental setup is detailed in De et al. (2009). Briefly, linearly polarized pulses with 45 fs duration at 800 nm are produced using a Ti:sapphire laser and are split into a pump and a probe arm of a Mach-Zehnder interferometer. In the pump arm, the second harmonic is created, temporally synchronized and rotated in its polarization with respect to the fundamental. A rotatable calcite plate serves to adjust the relative phase between the two-colors of the excitation field. The phase is calibrated by measurement of the phase-dependent ionization of CO Li et al. (2011). Note, that this method corrects an error of in the assignment of reported in De et al., which was based on above-threshold ionization De et al. (2009). The resulting field-asymmetric two-color pump pulses are focused onto a supersonic jet of CO molecules (T 60 K) inside a velocity-map imaging spectrometer (VMIS) Eppink and Parker (1997) by a spherical mirror (f = 75 mm) placed at the rear side of the VMIS. The intensity of the two-color pump pulses was varied between 2.41013 W/cm2 and 1.21014 W/cm2.
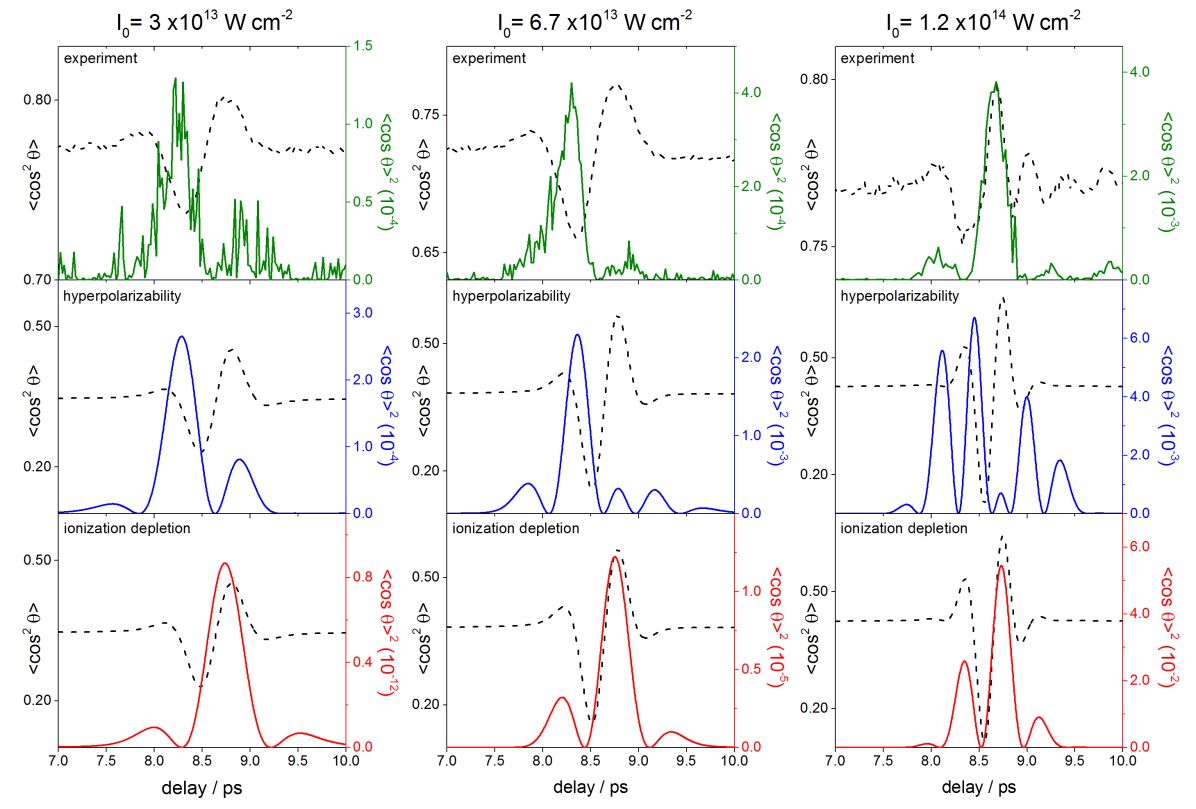
The degree of orientation and alignment induced by the pump pulse is typically characterized by the observables and respectively, where is the angle between the molecular axis and the polarization direction of the laser. It is not trivial to directly measure the angle . As in Ref.De et al. (2009), we use a strong single-color (800 nm) probe pulse to multiply ionize and Coulomb explode the molecule. The angle was then approximated by the angle at which fragments arising from the Coulomb explosion are detected with the VMIS. The intensity of the probe pulse is (2.60.6)1014 W/cm2. Similar to the studies reported in Ref.De et al. (2009), we have chosen to analyze the angular emission of C2+ fragments at kinetic energies above 2.5 eV. The top row of Fig. 1 shows the experimental alignment traces (dashed black lines) around the first full revival of near the molecules’ full rotation time 1/(2Bc) of 8.64 ps (with B = 1.93 cm-1) Linstrom and W.G. Mallard (retrieved September 25, 2011) at three selected two-color pump intensities. Also shown are the corresponding experimental orientation traces (green lines), which are reflected here by the parameter , following the presentation in Spanner et al. (2012). Plotting the square of the orientation makes it easier to compare the maximum of the orientation relative to the alignment revival signal. We note that the linearly polarized probe pulse increases the measured degree of alignment. Furthermore, since the probability of ionizing to the C2+ fragment as a function of the actual is not rigorously known, both the alignment and orientation values extracted from the Coulomb explosion will be proportional to, but not exact representations of, the and observables.
We now turn to the theoretical description of the orientation mechanisms. For the computations, the two-color laser pulse is written as
| (1) |
where is the pulse envelope, is the peak electric field strength. In this definition of the , we have set the relative phase between the colors to zero, , which assumes the maximum field asymmetry. We choose the envelope function to be
| (2) |
corresponding to a pulse for the intensity . The parameter is the full width at half-intensity, which we set to fs.
The rotational motion of the molecules does not follow the carrier oscillations of the laser, and hence it is appropriate to use the cycle-averaged Hamiltonian of the system to compute the rotational dynamics
| (3) |
where is the rotational constant, is the polarizability term that generates molecular alignment Friedrich and Herschbach (1995), is the hyperpolarizability term, and accounts for ionization Spanner et al. (2012). All equations use Hartree atomic units (). For the particular chosen in Eq. 1, the first two potential terms in Eq. 3 are given by Kanai and Sakai (2001)
| (4) |
where is the polarizability anisotropy, and the are elements of the hyperpolarizability tensor. The ionization depletion term is given by
| (6) |
where
| (7) |
accounts for the tunneling exponent Keldysh (1965) that provides the dominant scaling of strong-field ionization, and
| (8) |
accounts for the angle-dependence of the ionization rate. As outlined in Ref.Spanner et al. (2012), this analytical form of is specific to CO and was constructed as a fit to purely numerical computations that used the method of Ref.Spanner and Patchkovskii (2009). It is a complex potential causing non-unitary quantum evolution that removes amplitude as a function of angle, which captures the effects of population loss due to ionization. All the molecular constants that appear in the potentials are collected in Table 1. Although the Hamiltonian (Eq. 3) includes both the hyperpolarizability and ionization terms, we present results for each mechanisms separately in order to clearly elucidate the characteristic features of the two mechanisms.
| Parameter | Value [Ref.] | Parameter | Value [Ref.] |
|---|---|---|---|
| 8.7997 Linstrom and W.G. Mallard (retrieved September 25, 2011) | 3.6 Peterson and T.H. Dunning (1997) | ||
| 28.91 Peterson and T.H. Dunning (1997) | 7.69 Peterson and T.H. Dunning (1997) | ||
| 0.516 Linstrom and W.G. Mallard (retrieved September 25, 2011) | 0.2214 | ||
| 0.0535 | -0.2141 | ||
| 0.0822 |
The time-dependent rotational Schrödinger equation for the Hamiltonian in Eq. (3) is solved in a spherical harmonics basis using the Crank-Nicholson method et al. (1992). We account for the thermal distribution by propagating each initial rotational state independently and then incoherently averaging the and observable weighted by the Boltzmann distribution at temperature K. For the ionization depletion mechanism, the observables are further normalized to the remaining neutral population.
The results of our calculations for the HP (ID) mechanism are shown in the middle (bottom) row of Fig. 1, where alignment is displayed as dashed black lines and orientation as blue (red) lines. It can be seen that the temporal structure of the measured orientation revival is reflected well by the HP mechanism for the two lower intensities of 31013 W/cm2 and 6.71013 W/cm2. At these two intensities, the ID mechanism does not yet yield a significant orientation signal and stays below the expected signal from the HP mechanism. The situation changes at the highest intensity investigated of 1.21014 W/cm2. Here, the ID mechanism creates an orientation that is stronger than the one generated from the HP mechanism. In good agreement with the theoretical prediction, the experimental orientation trace resembles the orientation revival predicted by the ID mechanism. Remarkably, the transition between the mechanisms is well reflected in a temporal shift of the dominant orientation peak from around 8.25 ps and 8.3 ps at 31013 W/cm2 and 6.71013 W/cm2, respectively, to 8.7 ps at 1.21014 W/cm2. Close inspection of the timing of the maximum of the orientation revival is thus a good indicator of the active orientation mechanism.
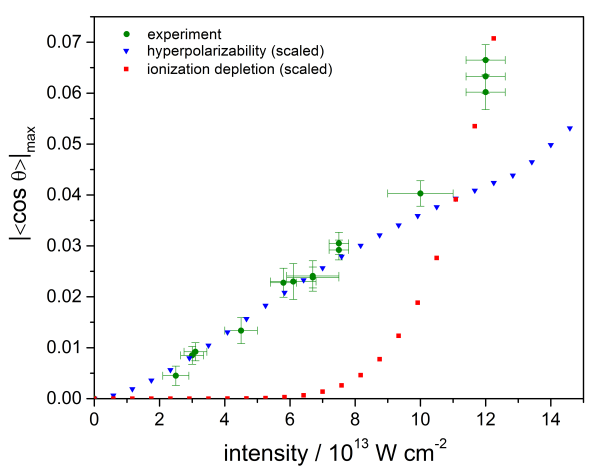
As further evidence for the transition between the mechanisms, Fig. 2 shows the measured maximum orientation values (green dots) as a function of the two-color pump intensity. The horizontal error bars reflect the uncertainty in the determination of the pump intensity and the vertical error bars the errors in the measured orientation values. The experimental data is compared to the predictions from the HP (blue triangles) and ID (red squares) mechanisms. The theoretical values are scaled by a constant, intensity independent factor to give best quantitative agreement with the experimental data. Since the analysis of the data in Fig. 1 suggests that the HP mechanism is dominant at low intensities, the theoretical data for the HP mechanism was scaled to fit best to the data below 81013 W/cm2. It is remarkable, that the measured gradient of with intensity is so well predicted by the HP mechanism in this regime, lending further support for this assignment to be correct. At the intensities above 81013 W/cm2, the experimental points diverge sharply from the HP curve and display a rapid increase. This rapid increase in the experimental maximum orientation matches qualitatively the exponential increase we would expect from the theoretical predictions of ID mechanism.
The transition between the HP and ID mechanisms offer a unique opportunity for the calibration of strong-field ionization (SFI) rates. At present, there is no reliable methods of computing absolute SFI rates for molecules. Many approaches exist to calculate the molecular SFI, from tunneling and semiclassical models like MO-SFA Muth-Bohm et al. (2000) and MO-ADK Tong et al. (2002), to more numerically intensive methods like TD-DFT Telnov and Chu (2009), TD-CIS Rohringer et al. (2006), MCTDHF Kitzler et al. (2004), and the mixed orbital-grid method of Ref.Spanner and Patchkovskii (2009). These methods have certainly provided much insight into molecular SFI, and can explain reasonably well the general intensity scaling and angular dependence of molecular SFI. However, the ultimate reliability of these theories with respect to absolute ionization rates has not been tested. Although attempts to measure the absolute SFI rates of molecules can be found Alnaser et al. (2004); Smeek et al. (2011), they are by no means routine. Detailed and well calibrated measurements of the transition between the HP and ID mechanisms provide a means to calibrate the strongly-non-perturbative SFI response of polar molecules against the perturbative (and hence much better understood) hyperpolarizability response in one clean experiment. One can first ensure the modelling reproduces the orientation in the HP regime to yield a properly calibrated measurement, than extract the absolute SFI rate fitting the orientation in the ID regime. Since the uncharacterized angular probability of Coulomb exploding to the C2+ charge state presently prevents a quantitative extraction of SFI rate, future work would need to focus on finding a more reliable experimental measure of .
In conclusion, we have studied the intensity dependent transition between two mechanisms for the orientation of CO molecules in two-color laser fields. At low intensities the HP mechanism is active, while at higher intensities the ID mechanism dominates. Apart from reconciling the two differing mechanisms proposed in the literature, this assignment is important for the future applicability of the two-color orientation technique. Since the highest degrees of orientation are reached via the ID mechanism, achieving large orientation will always entail the generation of large numbers of cations and free electrons in the sample. This necessary generation of cations and electrons that comes with large orientation could affect experiments using the two-color orientation technique, and it may be important to take them into account when using the technique as a tool in subsequent experiments. In addition to resolving the active mechanism in laser-induced molecular orientation, the observation of the transition between the two mechanism offers a potential experimental observable that can be used to calibrate or extract the absolute strong-field ionization rates of molecules, which is presently a remaining computational challenge for all existing theories of strong-field ionization.
We are grateful for fruitful discussions with E. Frumker. We acknowledge support by the U.S. Department of Energy under DE-FG02-86ER13491, the DFG via Kl-1439/3, and Kl-1439/5, and the Cluster of Excellence: Munich Center for Advanced Photonics (MAP).
References
- Stapelfeldt and Seideman (2003) H. Stapelfeldt and T. Seideman, Rev. Mod. Phys. 75, 543 (2003).
- Krausz and Ivanov (2009) F. Krausz and M. Ivanov, Rev. Mod. Phys. 81, 163 (2009).
- Kanai et al. (2005) T. Kanai, S. Minemoto, and H. Sakai, Nature 435, 470 (2005).
- Bisgaard et al. (2009) C. Bisgaard, O. Clarkin, G. Wu, A. Lee, O. Gesner, C. Hayden, and A. Stolow, Science 323, 1464 (2009).
- Goban et al. (2008) A. Goban, S. Minemoto, and H. Sakai, Phys. Rev. Lett. 101, 013001 (2008).
- Ghafur et al. (2009) O. Ghafur, A. Rouzee, A. Gijsbertsen, W. Siu, S. Stolte, and M. Vrakking, Nature Physics 5, 289 (2009).
- Holmegaard et al. (2010) L. Holmegaard, J. Hansen, L. Kalhoj, S. Kragh, H. Stapelfeldt, F. Filsinger, J. Kupper, G. Meijer, D. Dimitrovski, M. Abu-samha, et al., Nature Physics 6, 428 (2010).
- De et al. (2009) S. De et al., Phys. Rev. Lett. 103, 153002 (2009).
- Oda et al. (2010) K. Oda, M. Hita, S. Minemoto, and H. Sakai, Phys. Rev. Lett. 104, 213901 (2010).
- Frumker et al. (2012) E. Frumker et al., Phys. Rev. Lett. 109, 113901 (2012).
- Kanai and Sakai (2001) T. Kanai and H. Sakai, J. Chem. Phys. 115, 5492 (2001).
- Spanner et al. (2012) M. Spanner, S. Patchkovskii, E. Frumker, and P. Corkum, Phys. Rev. Lett. 109, 113001 (2012).
- Li et al. (2011) H. Li et al., Phys. Rev. A 84, 043429 (2011).
- Eppink and Parker (1997) A. T. J. B. Eppink and D. H. Parker, Rev. Sci. Instr. 68, 3477 (1997).
- Linstrom and W.G. Mallard (retrieved September 25, 2011) P. Linstrom and E. W.G. Mallard, NIST Chemistry WebBook, NIST Standard Reference Database Number 69, National Institute of Standards and Technology, Gaithersburg MD, 20899, http://webbook.nist.gov (retrieved September 25, 2011).
- Friedrich and Herschbach (1995) B. Friedrich and D. Herschbach, Phys. Rev. Lett. 74, 4623 (1995).
- Keldysh (1965) L. Keldysh, Sov. Phys. JETP 20, 1307 (1965).
- Spanner and Patchkovskii (2009) M. Spanner and S. Patchkovskii, Phys. Rev. A 80, 063411 (2009).
- Peterson and T.H. Dunning (1997) K. Peterson and J. T.H. Dunning, J. Mol. Struct. (Theochem) 400, 93 (1997).
- et al. (1992) W. H. P. et al., Numerical Recipes (Cambridge University Press, Cambridge, 1992), 2nd ed.
- Muth-Bohm et al. (2000) J. Muth-Bohm, A. Becker, and F. Faisal, Phys. Rev. Lett. 85, 2280 (2000).
- Tong et al. (2002) X. M. Tong, Z. Zhao, and C. D. Lin, Phys. Rev. A 66, 033402 (2002).
- Telnov and Chu (2009) D. Telnov and S.-I. Chu, Phys. Rev. A 79, 041401(R) (2009).
- Rohringer et al. (2006) N. Rohringer, A. Gordon, and R. Santra, Phys. Rev. A 74, 043420 (2006).
- Kitzler et al. (2004) M. Kitzler, J. Zanghellini, C. Jungreuthmayer, M. Smits, A. Scrinzi, and T. Brabec, Phys. Rev. A 70, 041401(R) (2004).
- Alnaser et al. (2004) A. Alnaser et al., Phys. Rev. A 70, 023413 (2004).
- Smeek et al. (2011) C. Smeek et al., Opt. Exp. 19, 9336 (2011).