Dust around R Coronae Borealis stars: II. Infrared emission features in a H-poor environment
Abstract
Residual Spitzer/IRS spectra for a sample of 31 R Coronae Borealis (RCB) stars are presented and discussed in terms of narrow emission features superimposed on the quasi-blackbody continuous infrared emission. A broad 6-10 m dust emission complex is seen in the RCBs showing an extreme H-deficiency. A secondary and much weaker 11.5-15 m broad emission feature is detected in a few RCBs with the strongest 6-10 m dust complex. The Spitzer infrared spectra reveal for the first time the structure within the 6-10 m dust complex, showing the presence of strong C-C stretching modes at 6.3 and 8.1 m as well as of other dust features at 5.9, 6.9, and 7.3 m, which are attributable to amorphous carbonaceous solids with little or no hydrogen. The few RCBs with only moderate H-deficiencies display the classical ‘unidentified infrared bands (UIRs)’ and mid-infrared features from fullerene-related molecules. In general, the characteristics of the RCB infrared emission features are not correlated with the stellar and circumstellar properties, suggesting that the RCB dust features may not be dependent on the present physical conditions around RCB stars. The only exception seems to be the central wavelength of the 6.3 m feature, which is blue-shifted in those RCBs showing also the UIRs, i.e., the RCBs with the smallest H deficiency.
1 Introduction
The R Coronae Borealis (hereafter RCB) stars are peculiar stars with two main distinguishing characteristics: an extreme hydrogen deficiency (ranging from factors of 10-100 to greater than 108) and an unpredictable optical variability with relatively rapid declines in brightness (variations from 2 to 8 magnitudes are usually seen in the V-band) that can last from a few weeks to many months (see e.g., Lambert & Rao 1994; Clayton 1996, 2012). The H-deficiency seen in RCBs may be explained by two possible scenarios: the double-degenerate (DD) and the final flash (FF) scenarios. The resulting H-deficient star is produced either from the merger of a He white dwarf with a C-O white dwarf (DD scenario)111Note that Zhang & Jeffery (2012) suggest that some RCB stars may be formed from the merger of two He white dwarfs. or from a final post-asymptotic giant branch (post-AGB) helium flash in the central stars of Planetary Nebulae (FF scenario). Detailed abundance analysis of RCBs (Lambert & Rao 1994; Asplund et al. 2000; Clayton et al. 2005, 2007; García-Hernández et al. 2009, 2010a; Jeffery et al. 2011; Pandey & Lambert 2011) suggest that the DD scenario may account for the great majority of the RCBs. Indeed, simulations by Longland et al. (2011) show that a “hot” white dwarf merger may qualitatively explain the chemical abundances observed in RCB stars222In this context, ‘hot’ means that nucleosynthesis occurs during and following a merger in contrast to a ‘cold’ merger where material is mixed but unaltered by nucleosynthesis. (see also Staff et al. 2012 for more details about merger simulations and RCBs). Another simulation of a hot merger and its subsequent post-merger evolution, nucleosynthesis and mixing (Menon et al. 2012), provides a rather satisfactory account of observed abundances for RCBs.
A RCB’s characteristic optical variability is caused by the formation of dust clouds along the line of sight towards the star (e.g., Forrest, Gillett & Stein 1972; Leão et al. 2007). A collection of dust clouds around the RCB through absorption and reradiation of stellar flux provide an infrared excess. A typical RCB star emits approximately 30% of the stellar flux in the infrared, confirming that they are producers of dust with typical blackbody temperatures ranging from 400 K to 900 K (Stein et al. 1969; Feast et al. 1997)333Note that a colder (30-100 K) dust component, has also been detected in some RCB stars (e.g., Rao & Nandy 1986). Cold dust around R CrB itself has been recently detected out to 500 m (Clayton et al. 2011a).. However, key questions about the composition of the dust grains around RCBs as well as about where and how (i.e., the possible chemical pathways followed in the condensation process) dust nucleation takes place remain unanswered (see also García-Hernández, Rao & Lambert 2011a). This has been due to the lack of high-quality infrared spectra for all but the two or three infrared-brightest RCB stars.
Recently, we have tried to correct this situation by carrying out a Spitzer/IRS spectroscopic survey for essentially all of the known Galactic RCB stars (García-Hernández, Rao & Lambert 2011a, hereafter Paper I). Examination of RCB’s infrared spectra and detection of spectroscopic features is a pathway to identification of the circumstellar constituents (dust grains and large molecules). Spitzer/IRS spectra of RCBs are especially valuable because, in contrast to the usual dusty red giants (and main sequence stars), dust in a RCB is formed in a H-poor, He-rich, and usually C-rich environment: a C/He ratio of one per cent by number and a C/O ratio of somewhat greater than one are typical (Asplund et al. 2000). An understanding of dust formation in both H-rich (both O-rich and C-rich) normal stars and H-poor (C-rich) environments of the RCBs is desired before one can pronounce that dust formation is understood; see Woitke et al. (1996) for a quantitative model of carbon chemistry and dust condensation around RCB stars.
In Paper I, individual spectral energy distributions (SEDs) compiled from optical and infrared photometry and the Spitzer spectra were corrected for interstellar reddening and then fit by blackbodies representing the star and the dust. Subtraction of the flux provided by the blackbodies from the dereddened SED provides what we term the residual or difference spectrum which is dominated by infrared emission features. In this second paper of the series of Spitzer/IRS RCB spectra, we discuss the residual (or difference) spectra. The residual Spitzer/IRS spectra of the least H-poor RCBs DY Cen and V854 Cen showing both possible C60 or fullerene-related features and the classical ‘unidentified infrared bands (UIRs)’ - usually attributed to polycyclic aromatic hydrocarbons (PAHs) - have been previously discussed by us (García-Hernández, Rao & Lambert 2011b) but see García-Hernández, Rao & Lambert (2012). Clayton et al. (2011b) recently discussed residual Spitzer spectra of the two hot RCB stars V348 Sgr and HV 2671 and noted that the spectrum of the former is very different from that of the latter.
A summary of the Spitzer/IRS observations and of the construction of the residual spectra is presented in Section 2. Section 3 gives an overview of the Spitzer/IRS residual spectra, where the dust features are easily seen, while Section 4 discusses the characteristics and identifications of the dust features around RCB stars. A few RCBs with exceptional residual spectra are highlighted in Section 5. The conclusions of our work are given Section 6. In a future paper we will attempt to model the infrared RCB spectra in order to get information on the physical properties of the dust clouds.
2 Spitzer/IRS observations and residual spectra
Spitzer Space Telescope observations of a large number of RCB stars were presented and discussed in Paper I. Stars were chosen to provide comprehensive coverage of warm RCBs across the chemical composition range observed in RCB stars, to sample the coolest RCBs as well as to complete observations of minority RCBs.444Minority RCBs were defined by Lambert & Rao (1994) as stars having extraordinarily high Si/Fe and S/Fe ratios. Table 1 (updated from Paper I) lists the 31 RCB stars included in our study together with some relevant information such as stellar and dust temperatures, the interstellar reddening E(B-V), and variability status. Finally, the inner parts of the hydrogen deficient planetary nebulae (PNe) A 78, A 30, and IRAS 1833-2357 have also been observed by Spitzer and we retrieved their infrared spectra from the Spitzer database for comparison purposes.
The stellar effective temperature () is taken from Paper I. The blackbody temperatures of the dust continua are given as and, where necessary, as with the corresponding fractional coverages as and 555The fractional covering factors are defined as the flux ratios for the blackbodies relative to the stellar flux = / (see Paper I for more details).. The equivalent width of the 6-10 m emission feature is given in the column headed EQW6-10μm (see below for remarks on how this quantity was measured). The final two columns describe the optical brightness of the star at the time of the Spitzer observations and give the estimated interstellar reddening from Paper I.
We refer the reader to Paper I for a detailed description of the SEDs from 0.4 to 40 m for the RCB stars in our sample and the construction of the blackbody fits to the continuum emitted by the circumstellar dust.666Note that a star’s photospheric contribution to the observed Spitzer spectra is generally very small. Subtraction of the blackbody fluxes from the reddening-corrected infrared fluxes provides the residual spectrum for a RCB. Blackbody continua are essentially a convenient device for specifying the local continuum on which sit the emission features. Interpretation of the spectral structure in the residual spectra is the principal focus of this paper.
The shape of this spectral structure is sensitive to several factors. First, the correction for interstellar reddening and especially the correction for the interstellar 9.7 m (and 18 m) amorphous silicate features affects the long-wavelength shape of the 6-10 m dominant feature in the residual spectra. Detailed information on the effect of reddening corrections is given in the next Section. The method of correction assumes that the strength of the amorphous silicate features relative to the broad wavelength-dependent extinction is the same for all lines of sight and independent of E(B-V). Second, the shape of the short-wavelength end of the 6-10 m dominant feature is affected by the gap in contemporary measurements defining the SED between the short-wavelength limit of the Spitzer observations and the K-band. Flux from the fitted dust blackbody is falling rapidly shortward of about 6 m but a contribution across the 3-6 m interval from warmer dust closer to the star is ill-defined for lack of photometry and particularly spectrophotometry across the L-M-N bands at the time of the Spitzer observations. Thirdly, the discernible detail across the residual spectra is dependent - of course - on the signal-to-noise (S/N) ratio of the Spitzer spectra.
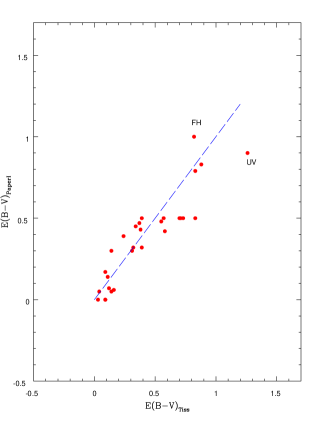
In Paper I, the interstellar reddening was estimated in a very inhomogeneous way with emphasis given to estimates from various techniques reported in previous papers discussing the individual stars. Thus, it is of great interest to compare these estimates with independent estimates obtained in a very homogeneous way. Such estimates have been provided by Tisserand (2012) from the COBE/DIRBE maps (Schlegel et al. 1998). In Figure 1, we compare Tisserand’s E(B-V) with those from Paper I. The dashed line shows that the two methods give generally very similar values, especially for E(B-V) less than about 0.5. Two obvious discrepancies at large E(B-V) – FH Sct and UV Cas – are marked on the figure (see Section 2.1 for more details).
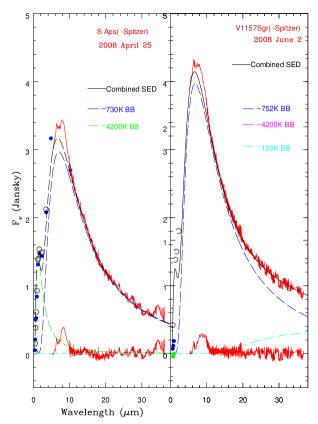
In order to reduce the influence of the reddening correction (Section 2.1) on the residual spectra, we consider first and foremost those RCBs with the smallest E(B-V) values, say E(B-V) where E(B-V) is taken from Table 1. The octet includes S Aps, Z UMi, WX CrA, V1157 Sgr, VZ Sgr, U Aqr, V CrA, and RS Tel. R CrB and RY Sgr would be in this group but for the fact that their Spitzer spectra do not extend shortward of 10 m; we are reluctant to combine Infrared Space Observatory (ISO) spectra (Lambert et al. 2001) with the Spitzer spectra for these two stars which are so obviously variable in the mid-infrared. V854 Cen and HV 2671, also low E(B-V) stars, and DY Cen, a star with a higher E(B-V), have distinctly different residual spectra, presumably on account of their small H-deficiencies. Their residual spectra were discussed by García-Hernández, Rao & Lambert (2011b). Fortunately, the low-reddening octet samples the different classes (warm vs cool, majority vs minority) of RCBs. Thus, it is likely that their residual spectra are representative of the range among RCBs (see below). Construction of residual spectra is illustrated in Figure 2 for S Aps (E(B-V) = 0.05) and V1157 Sgr (E(B-V) = 0.30). Figure 3 shows the complete set of residual spectra for the low reddening octet. The residual spectra are normalized to the maximum value longward of 6 m (i.e., the occasional and spurious flux rise at the short wavelength limit seen in some stars is ignored) and displaced for clarity. Residual spectra for the more-reddened RCBs are shown in Figures 4, 5, and 6. V517 Oph and SU Tau are not shown in these Figures because their Spitzer spectra do not extend shortward of 10 m (see Section 3). The effect on the residual spectra of reddening uncertainties is discussed below.
An artefact in the Spitzer spectra should be noted. Some RCB stars (e.g., V348 Sgr, RZ Nor, and V CrA) display an emission feature centred at 14.20.2 m. Although the feature may be attributable to a weak C-C-C bending mode (Hony et al. 2001) in carbon grains, we noted that detection of this feature is made using the low-resolution modules, and the feature lies right on the boundary between the SL and LL modules. In addition, this feature is not obvious in the SH spectra of the few sources (e.g., V854 Cen) observed with both low- and high-resolution modules. According to the IRS Instrument Handbook777see e.g., http://ssc.spitzer.caltech.edu/irs/irsinstrumenthandbook/home/, extreme caution is recommended in interpreting features at 13.2-15 m because there is a known “SL 14 micron teardrop”, which produces an excess emission that is correlated with the source brightness. The apparent 14.2 m feature is stronger in the brightest RCBs, and, thus, we conclude that the 14.2 m feature is primarily an artifact related to the “SL 14 micron teardrop”.
2.1 Correction for interstellar reddening
We have undertaken an examination of the effect of the correction for interstellar reddening (i.e., varying E(B-V)) on the resulting spectral structure (e.g., the shape of the 6-10 m emission complex). As we mentioned above, our estimates of E(B-V) values from Paper I are compared with the independent estimates by Tisserand (2012) as obtained from COBE/DIRBE measurements, for 29 of the 31 stars in Table 1; Tisserand did not give E(B-V) for MACHOJ181933 and HV 2671. For these 29 RCB stars, the mean difference between Tisserand’s E(B-V) and our E(B-V) values is 0.044 with a root mean square deviation of 0.14. We thus assume that the error in our E(B-V) estimates is about 0.1 (see Figure 1).
We have adopted the reddening curve of Chiar & Tielens (2006) of the diffuse interstellar medium (ISM) (their Table 7). This table provides the extinction from 1.24 m to 30 m but was extended to 38 m, as indicated in Paper I. The 9.7 m (and 18 m) profile of the silicate feature inferred from observations of the Wolf-Rayet (WR) star WR98a is taken as representative of the local ISM. Our adoption of a single profile for the 9.7 and 18 m silicate features might affect the reddening-corrected emission profiles in the 8-11 m range because the silicate profile (as well as other profile changes at 14 m) varies towards dark clouds, the Galactic center and/or other directions. The strength of the 9.7 m feature also changes appreciably even in the diffuse ISM. This is reflected in the Av/(9.7) ratio, which changes from 14.4 to 17.5 even for the calibrating WR stars used by Chiar & Tielens (2006) and Williams et al. (2012) give Av/(9.7)=16.64.6 for WR stars.
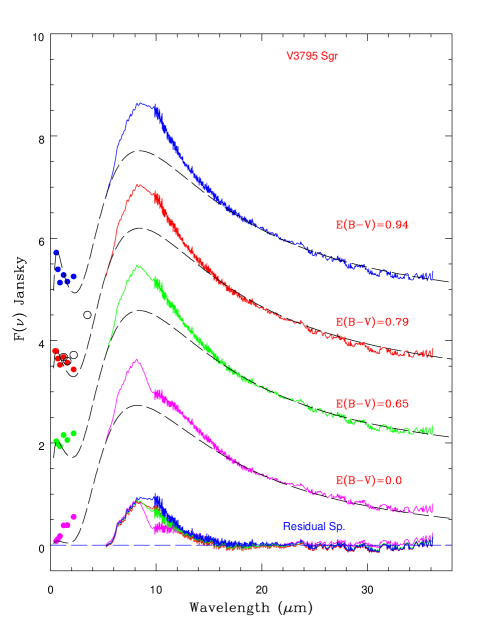
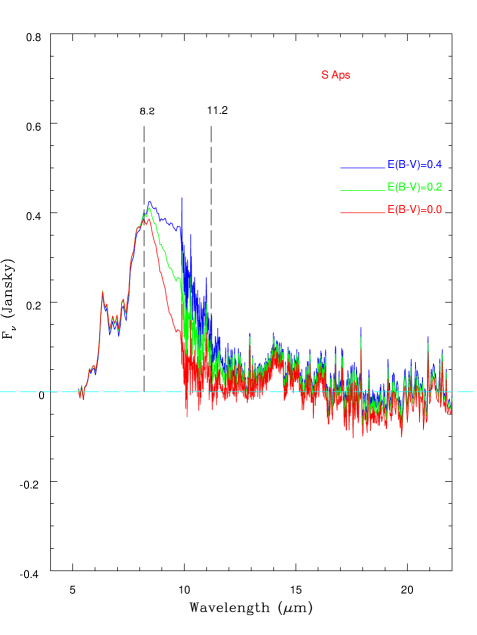
Correction for the silicate feature centered at 9.7 m affects the 6-10 m profile from about 8.2 to 11.2 m. Obviously, increasing the reddening increases the emission for 8 to 11 m. This is clearly shown in Figures 7 and 8 where we display resultant residual spectra obtained for various E(B-V) values for V3795 Sgr and S Aps. In the case of V3795 Sgr (Figure 7), our adopted E(B-V) of 0.79 is preferred because the optical colors are better corrected with this E(B-V) value. E(B-V) values in the range 0.65-0.82 may fit reasonably well the Spitzer spectrum, being consistent with our estimated E(B-V) uncertainty of about 0.1. Unlike the majority of RCBs, the emission excess for V3795 Sgr relative to the fitted blackbody extends to about 15 m but the profile of this extension is effectively independent of the assumed E(B-V) value. Figure 8 shows the sensitivity of the residual spectra for S Aps, a star almost unreddened by the intervening interstellar medium: spectra are shown for E(B-V) of 0.0 (as observed), 0.2, and 0.4. For both stars V3795 Sgr and S Aps, the dust temperature obtained from blackbody fits to the Spitzer continua are essentially unaffected by the adopted E(B-V) values over the range investigated. The total flux emitted in the infrared is weakly dependent on E(B-V). The principal effect of the reddening is its effect on the profile of the (dust) 6-12 m emission feature where correction for the interstellar silicate feature defines the profile between about 8.2 and 11.2 m.
2.2 Characterization of emission components
Characterization of the emission features in the residual spectra begins with estimating the equivalent width (EQW) of the 6-10 m dust emission complex seen in all RCB stars in our sample (see Figures 36). For this measurement, the wavelength interval was adjusted for the individual star. A source of uncertainty arises from the definition of the short-wavelength edge to the broad 6-10m emission feature (see above). The EQWs (Table 1 and the column headed EQW6-10μm) appear to fall into two groups. In the minor group with large EQW are the less H-deficient RCBs DY Cen, V854 Cen, and HV 2671888We note that the chemical abundances (e.g., H-content) of HV 2671 are not known but its optical spectrum is very similar to V348 Sgr (De Marco et al. 2002). The abundances of both stars are thought to resemble those from [WC] central stars but their Spitzer spectra are very different (Clayton et al. 2011b). The HV 2671 Spitzer spectrum (with PAH-like features) looks identical to the other less H-deficient RCBs, while the V348 Sgr IR spectrum is more similar to that of extremely H-poor RCBs. Thus, based on the Spitzer spectra alone, we consider HV 2671 as a possibly less H-deficient star. and also the minority star V3795 Sgr and the hot RCB MV Sgr. The major group with EQWs less than about 0.6 m are the ‘normal’ RCBs. This apparent separation and the EQW spread within the major group are discussed in the next section.
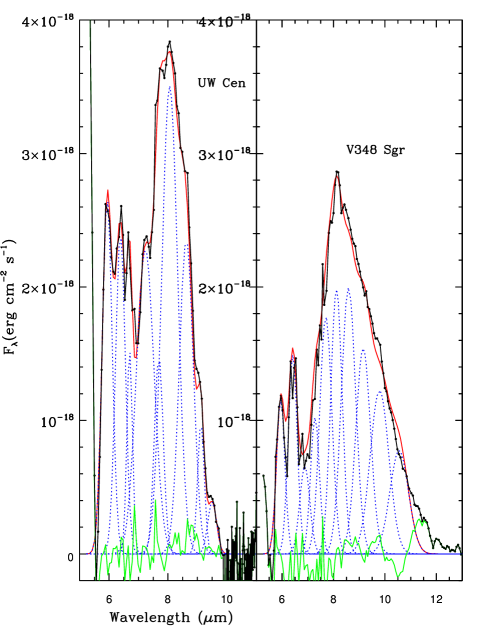
Residual Spitzer spectra display structure within the 6-10 m dust emission complex of RCB stars. In spectra of high S/N ratio (e.g., UW Cen), the complex is seemingly resolvable into emission components at 5.9, 6.3, 6.9, 7.3, 7.7, 8.1, 8.6, 9.1, and 9.6 m. These emission components have similar wavelengths and similar widths (FWHM) across the sample (see below). In most RCBs, however, the features are blended and discerning them may not be an easy task, particularly between 7 and 10 m (i.e., other than the 6.3 m feature). High S/N residual RCB spectra such as UW Cen set the central wavelength of the emission components within the broad 7-10 m feature and show that there are several components rather than one broad asymmetrical band. Indeed, by overlapping most of the residual RCB spectra on each other, common emission bumps at 6.3, 6.9, 7.3, 7.7, 8.1, and 8.6 m are usually found. Thus, we were encouraged to carry out a multi-Gaussian fit using a deblending routine written for SUPERMONGO. A condition of the fit was that Gaussians were introduced at wavelengths of 5.9, 6.3, 7.3, 7.8, 8.1, 8.6, 9.1, and 9.6 m with small adjustments allowed for the central wavelengths and FWHMs. Parameters from the multi-Gaussian fits (central wavelength, FWHM, and integrated flux) are listed in Table 2 for the low-reddening octet and in Table 3 for the more reddened stars including the three least H-deficient RCBs. Examples of fits are shown in Figure 9 for UW Cen and V348 Sgr, a warm and a hot RCB, respectively. In general, the FWHM of components in the 7-14 m interval are considerably greater than the instrumental width which according to the Spitzer manual is two pixels or 0.12 m999http://irsa.ipac.caltech.edu/data/SPITZER/docs/irs/irsinstrumenthandbook/ The 5.9 m component has a FWHM 0.2 m for many stars but definition of this component is greatly influenced by the assumed Wien tail of the dust continuum emission and the short wavelength termination of the Spitzer spectrum.
Finally, we also carried out the multi-Gaussian fits on the residual Spitzer spectra of the three hydrogen deficient PNe - A 78, A 30, and IRAS 1833-2357 - studied here for comparison. The corresponding residual spectra were obtained by subtracting the dust continuum emission, which was represented by 5-order polynomials fitted at spectral locations free from any dust or gas feature. Interestingly, all three PNe show weak infrared features at 6.4, 7.3, and 8.0 m only (see Section 4). For comparison, the parameters (central wavelength, FWHM, and integrated flux) of the three IR emission features in H-poor PNe are listed at the bottom of Table 3.
3 Overview of the residual spectra
In both the observed and the dereddened spectra, all stars show emission features superimposed on the smooth continuum which is fitted with one, two, and, in rare cases, three blackbody continua. Stars may be sorted into two groups.
The first group with large EQWs for the emission features include three stars (DY Cen, V854 Cen, and HV 2671) known (presumed in the case of HV 2671, see above) to possess relatively large amounts of hydrogen. Their emission features are not limited to those in the 6-10m interval. Residual spectra of this trio are shown in Figure 10. These emission features are attributed to PAHs (see García-Hernández, Rao & Lambert 2011b for V854 Cen and DY Cen and Clayton et al. 2011b for HV 2671). In addition, the mid-infrared features of the C60 molecule or proto-fullerenes may be detected in DY Cen and V854 Cen (García-Hernández, Rao & Lambert 2011b, 2012) but not in HV 2671 (Clayton et al. 2011b). The cool RCB DY Per and the warm RCB V482 Cyg also show PAH-like emission features at 11.3 and 12.7 m (see Figure 10 and Section 5).
All other RCBs fall into the second group with an emission feature from about 6 to about 11 m (the 6-10m complex). The shape, essentially the wavelength extent, of this feature is dependent on two ‘external’ factors. First, the feature’s long-wavelength profile is sensitive to the correction for the 9.7 m interstellar silicate absorption (Section 2.1). Second, the feature’s shape shortward of 6 microns is sensitive to the Wien tail of the fitted warmer dusty blackbody and, more generally, to the lack of contemporaneous spectral information shortward of the short-wavelength limit of the Spitzer spectra.
In order to illustrate the quasi-continuous distribution of shapes for the 6-10 m emission feature with minimal sensitivity to the adopted reddening, we concentrate first on the eight RCB stars in the second group with the least reddening, i.e., with adopted values of E(B-V)0.3. This octet do not display a common profile for the 6-10 m feature. Visual inspection of the eight spectra suggests a simple classification by the relative strength and separation of the sharp emission features at 6.36.4 to the much broader feature at 7-10 m. The apparent resolution of these two features is influenced by the strength of emission at 7 m. In order of increasing strength of the 7m feature and thus decreasing minimum between the 6.3-6.4m and 7-10m features, the eight are, as shown in Figure 11: V CrA, V1157 Sgr, S Aps, RS Tel, VZ Sgr, WX CrA, U Aqr, and Z Umi. This small sample isolated by interstellar reddening, a property extrinsic to a RCB, spans the range of the full sample from warm to cool, minority to majority and includes the light -process enriched star U Aqr. Mean parameters from the multi-Gaussian fits for nine components are given in Table 4.
Examination of the relative fluxes along the sequence from V CrA to Z UMi shows not suprisingly given the classification by morphology that the leading variation occurs for the 6.9 m to 6.3 m pair which runs approximately monotonically from 0.13 for V CrA to 1.6 for Z UMi. There is a weaker and more erratic trend for the 7.3 m to 6.3 m ratio from 0.3 for V CrA to 1.0 for Z UMi. The complex of features 7.7-9.6 m shows a nearly constant flux ratio with respect to the 6.3 m feature with limits of 2.4 for VZ Sgr and WX CrA and 4.3 for S Aps but an exceptional ratio of 6.3 for U Aqr. Within the 7.7-9.6 m complex, the relative fluxes of the various components appear approximately the same from star to star. One or two exceptions appear to result from an unusual FHWM assigned to a component affecting the flux of that and adjacent components. An exception may be the 9.6 m feature for which the ratio relative to the 7.7 m feature runs from 0.07 for WX CrA to 1.6 for V1157 Sgr. Except for WX CrA and V1157 Sgr, the 7.3 m to the 7.7-9.6 m flux is approximately constant which may imply that the 7.3 m feature is a blend composed of a feature from the 6.3 m carrier and the 7.7-9.6 m carrier. In summary, it seems plausible to attribute the emission features to two principal sets: one contributing the 6.3 m and the 7.7-9.6 m features and another the 6.9 m feature.
Making use of the relative strengths of these two principal sets of emission features, the residual spectra in Figure 11 for the least-reddened stars and also for the more heavily reddened stars (shown in Figures 46) may be classifed into classes to . The IR classes (, , ) for all RCBs in our sample are given (when possible) in the last column of Table 1. For the octet in Figure 11, Z UMi and U Aqr are in class , VZ Sgr and WX CrA in class , S Aps and RS Tel in class and V CrA and V1157 Sgr in class . Across the entire sample excluding DY Cen, V854 Cen, and HV 2671, the EQW (column EQW6-10μm in Table 1) increases systematically down the classes from to , i.e., the mean EQW from four stars is 0.16 m and 0.35 m from six stars. Within a class, the EQW appears to be constant to within the measurement errors. The EQW is independent of stellar and dust temperature. The greater part of this increase from to comes from the growth of the 6.9 m feature. The only gross departures from the above trend occur for VZ Sgr with an EQW about a factor of three less than the mean for the class and V3795 Sgr with an EQW about a factor of three greater than the mean for its class. Both stars are discussed in Section 5.
The sample of the more reddened RCBs gives similar results to the lightly-reddened sample. Inspection of the residual spectra for the reddened sample shows greater differences star-to-star at and beyond about 10 m than for the lightly-reddened sample. For example, the residual spectrum for UV Cas ends at 9 m but for V3795 Sgr the spectrum extends beyond 12 m but this difference is not due to inappropriate corrections for interstellar reddening (see above). Average measurements of the emission features for the two samples are compared in Table 4 and show that in the mean they share the same emission features. This level of agreement implies that appropriate corrections for interstellar reddening have been applied.
Finally, it is worth mentioning that a secondary and very weak broad emission feature from 11.5 to 15-18 m is also seen in the brightest mid-IR RCBs such as UW Cen, V517 Oph, RY Sgr, and SU Tau - although there is tentative evidence for its presence in a few other RCBs like SV Sge, ES Aql, and WX CrA (see Figures 36). Figure 12 displays the Spitzer residual spectra around the weak and broad 11-15 m emission feature for RCBs UW Cen, ES Aql, WX CrA, V517 Oph, and SU Tau. Unfortunately, the spectra of V517 Oph and SU Tau do not cover the 5-10 m spectral region, but UW Cen with a strongest 11.5 to 15-18 m broad feature displays the brightest 6-10 m dust complex. The presence of this secondary and weaker 11.5-18 m broad emission feature in RCB infrared spectra was revealed by previous ISO observations of the RCB stars R CrB and RY Sgr (Lambert et al. 2001).
4 Amorphous carbonaceous solids in H-poor environments
Emission features in the 6-10 m region may possibly belong to a sequence of what were once termed ‘unidentified infrared bands (UIRs)’ between 3 and 13 m with principal features at wavelengths of 3.3, 6.2, 7.7, 8.7, 11.3, and 12.7 m (Tielens 2008) in spectra of many dusty objects heated by O-rich and C-rich stellar atmospheres but with presumably a normal H abundance. It would surely not be surprising if UIRs from around RCBs differed from those around normal stars. Useful collections of mid-infrared spectra for normal stars are illustrated and discussed by Peeters et al. (2002) from ISO 6 to 9 m spectra and Sloan et al. (2007) from Spitzer/IRS 5 to 40 m spectra.
Peeters et al. describe UIRs at 6.2 m, a blend apparently composed of features at 7.6, 7.8, and 8.0 m and a feature at 8.6 m. Extensive discussion of the central wavelengths and profiles of these UIRs led to identification of three classes (A, B, and C). Sloan et al. in addition to listing UIRS at 6.2, 7.9, and 8.6 m report UIRs beyond the 9 m limit of the ISO spectra at 11.3, 12.7 and 13.7 m. Figure 13 composed from residual spectra constructed from Sloan et al. (2003)’s ISO spectra shows representative residual spectra of Peeters et al.’s classes A, B, and C, and, in addition, the Spitzer residual spectrum of the RCB V CrA.
Comparison with our spectra of the H-poor RCBs (see, for example, Figure 11 for the 5-10 m interval and Figures 36 for a longer wavelength interval) shows a generally poor correspondence between classes A, B, and C with a normal H abundance and H-poor RCBs. Not only is the (usually) strong 11.3 m UIR in classes A, B, and C absent from the RCB spectra but there are differences too across the 6-10 m interval; specifically, the line at 6.9 m present in most RCB spectra is absent from spectra of classes A, B, and C. Apart from the absence of UIRs beyond 10 m, the class C spectra and those of the RCB class are quite similar – see IRAS 13416-6243 and V CrA in Figure 13. These differences would suggest that even where there is a close wavelength correspondence between a UIR from classes A, B, and C and the H-poor RCBs the carrier of the UIR may not be the same.
The UIRs from normal H circumstellar envelopes are attributed to different vibrational modes of PAHs (i.e., organic structures formed of benzene rings) and their aliphatic attachments (i.e., organic structures not containing benzene rings). Table 4 from Jäger et al. (2008) identifies modes with wavelength ranges from laboratory measurements of carbon soot particles. When the aromatic hydrocarbons are large structures, vibrational frequencies will be similar for a given mode from one structure to the next. This physical-chemical property explains why the UIR bands appear at very similar wavelengths in a wide variety of sources hosting different hydrocarbons in gaseous or solid form as small particles. Neutral and ionized PAH molecules are possible carriers with the attractive property that they are hardy survivors in harsh environments around and between stars.
Most of the RCBs are extremely H-deficient so that the circumstellar molecules and solids are expected to also be H-poor; the UIRs in these cases have been broadly attributed to amorphous carbon, soot particles, etc. For the few RCBs such as DY Cen and V854 Cen with less extreme H-deficiences, the infrared emission features present in their Spitzer spectra have been attributed to PAHs and (proto-)fullerenes (García-Hernández, Rao & Lambert 2011b, 2012)101010V854 Cen showed extraordinary spectral variations between the ISO and Spitzer spectra, suggesting that a significant fraction of the circumstellar dust grains may have evolved from hydrogenated amorphous carbon (HAC) to PAHs and fullerene-related molecules (García-Hernández, Rao & Lambert 2011b; see also García-Hernández et al. 2010b, 2011, 2012)..
Laboratory studies on PAHs and small carbon particles (amorphous carbon, hydrogenated amorphous carbon - HAC) have characterized the band wavelengths and strengths. For example, Colangeli et al. (1995) provide wavelengths of bands from submicron amorphous carbon particles as well as mass extinction coefficients from 40 nm to 2 mm. Amorphous carbon was produced in three different ways (arc discharge with carbon electrodes in an Ar [ACAR] or a H2 atmosphere [ACH2], and the burning of benzene in air [BE]). The mean central wavelengths from these experiments (ACAR, ACH2, and BE in Table 5) agree well with the values from the multi-Gaussian fits to the spectra of the eight least-reddened stars – see Table 5. The 8.6, 9.1, and 9.6 m features were not explicitly isolated by Colangeli et al. but illustrated emission profiles show emission extending to these wavelengths. All Colangeli et al. laboratory samples (ACAR, ACH2, and BE) also display a few much weaker features in the 11-17 m interval. In particular, the ACAR sample displays a rather broad feature from 11.5 to 16 m (Fig. 5 in Colangeli et al. 1995) that may be related with the secondary and weak broad 11.5-15-18 m emission feature seen in the few brightest mid-IR RCBs (see below and also Lambert et al. 2001). Perfect agreement between laboratory and circumstellar wavelengths should not be expected because the precise central wavelengths are sensitive to the nature of the amorphous carbon and, perhaps, the circumstellar environment’s history and properties. But the wavelength agreement does show, as expected, that large organic molecules or small carbon grains are likely carriers of the emission features and, therefore, are also likely responsible for the continuum infrared excess on which these features are superimposed. Remarkably, laboratory HAC samples with very low hydrogen content also show discrete dust features at 5.9, 6.3, 6.9, and 7.3 m together with the lack of emission at 11.3 m (W. Duley, private communication). However, the HAC laboratory samples with little H do not show any strong feature around 8.1 m.
Carpentier et al. (2012) have recently studied the nanostructures of laboratory analogues of carbonaceous circumtellar/interstellar dust, finding that the positions of the 6.2 and 8 m bands trace defects of the soot polyaromatic structures in the form of non-hexagonal rings and/or aliphatic bridges. Their sample 3 (that with the lowest hydrogenation of the carbon skeleton) laboratory spectrum (see Figure 5 in Carpentier et al. 2012) looks quite similar to some RCB spectra (e.g., U Aqr, V739 Sgr) where the 8 m feature is stronger than the 6.3 m one. Sample 3 in Carpentier et al. (2012) provides a good laboratory analog for the carriers of the ‘class C’ spectra as described by Peeters et al. (2002) – see Figure 13. Other weaker features at 5.8, 6.9, 7.3, and 8.6 m - which could find a counterpart in the RCB spectra - are also present in their sample 3 laboratory spectrum. Insterestingly, their sample 3 is composed of big (about 30 nm in diameter) and rather spherical primary soot particles and characterized by a more evident curvature of the polyaromatic structures where numerous fullerene-like structures are found. Similar nanostructures could thus be present in the carbonaceous dust around RCB stars.
Table 6 presents the assignments for the infrared bands from 5 to 14 m. Bands between 6 and 9 m are a mix of C-O and C-C stretching (skeletal) modes and C-H in-plane bending modes. The 11.3 and 12.7 m bands are C-H out-of-the-plane bending modes and with hydrogen being underabundant in RCB circumstellar shells, the absence of these bands in the majority of RCB spectra is not surprising. The bands appear weakly in V854 Cen, DY Cen, and HV 2671, the trio with less extreme deficiencies of H. Similarly, a 3.3 m band composed of C-H stretching modes is absent from R CrB and RY Sgr (Lambert et al. 2001) weakly present in V348 Sgr (Nandy, Rao & Morgan 1986) and more prominent in the more H-rich V854 Cen (Lambert et al. 2001).
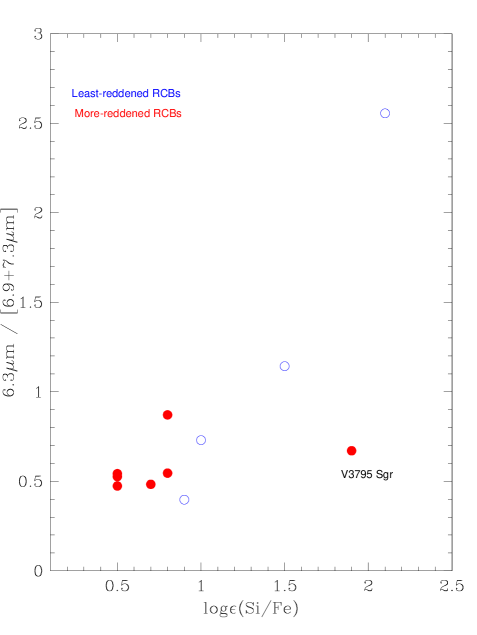
This explanation for the weakness of the 11.3 and 12.7 m bands does not simply carry over to the C-H deformation modes at about 6.9 and 7.3 m. Consider these C-H deformation bands at 6.9 and 7.3 m and the reference band at 6.3 m arising from the C-C stretch. A naive expectation would be that the C-H deformation band fluxes relative to that of the C-C stretch at 6.3 m should correlate with the spectroscopically measured H abundance (Asplund et al. 2000). In particular, one might compare H abundances for class stars and class stars where the latter have the weaker 6.9-7.3m component. One difficulty is that H abundances are available for just two of the four stars and for four of the seven stars. For the stars, the logarithmic H abundances are 4.1, 4.8, 6.1, and 6.5. For the pair, the H abundances are 6.0 and 8.0 where the latter H abundance, the strongest across the entire sample, applies to V CrA, the star with the weakest 6.9-7.3m feature. (In normal stars, the logarithmic H abundane is 12.0 by convention.) An idea that a high H abundance in the stellar atmosphere might result in a strong flux for the 6.9 m band is contradicted by the appearance of V CrA’s residual spectrum in Figure 11 showing a deep minimum between the 6.3 m band and the 8-10 m complex just where the 6.9m C-H deformation should be; yet this RCB has the highest H abundance of the octet illustrated in the Figure and most closely resembles class C spectra for stars having a normal H abundance (see also Fig. 13). Moreover, relative fluxes for the two C-H deformation bands within the 6.9-7.3m feature are uncorrelated; the flux ratio of the 7.3 m band to the 6.9 m band varies over a factor of 20 for the six stars with H abundances between 5 and 6.5. An interpretation of this result may be that the 7.3 m band is not entirely due to C-H deformation. This conclusion may extend to the 6.9 m band. There is tentative evidence that the relative strength of the 6.9-7.3 m feature in RCBs may be anticorrelated with the silicon abundance. Figure 14 displays the flux ratio 6.3m/6.9-7.3m versus log(Si/Fe) as taken from Asplund et al. (2000). The ‘minority’ RCBs VZ Sgr and V CrA, stars with high Si/Fe abundances, display the largest 6.3m/6.9-7.3m flux ratios. However, the small number of stars in Figure 14 caution us about reaching a conclusive result. In addition, the other ‘minority’ RCB V3795 Sgr shows a rather normal 6.9-7.3m feature (Fig. 14).
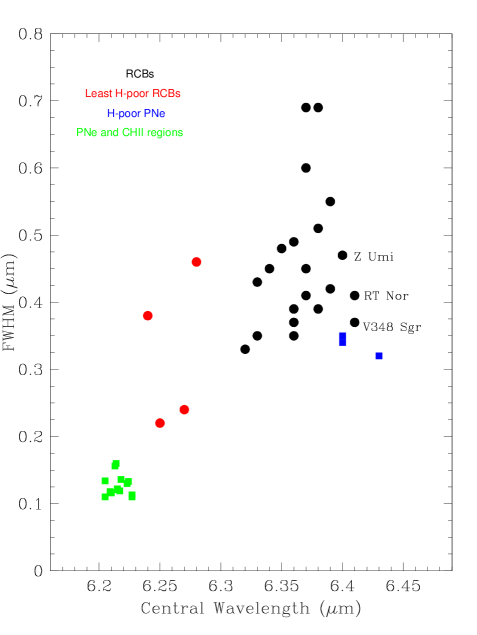
Interestingly, there exists a clear difference in the central wavelength of the 6.3 m feature in RCB stars with mild H-deficiencies (DY Cen, V854 Cen, and possibly HV 2671, and V482 Cyg111111V482 Cyg is extremely H-poor (Asplund et al. 2000) but its Spitzer spectrum display PAH-like features and the central wavelength of its 6.3 m feature is similar to the three least H-deficient RCBs (see Section 5 for more details).) and in extremely H-deficient RCBs. The mean central wavelength is 6.260.02 (4 stars) and 6.360.03 (19 stars) for the mildly H-poor and extremely H-poor RCBs, respectively. The central wavelenght of this feature is red-shifted up to 6.410.01 in the three H-deficient PNe. Similar FWHMs (within the estimated errors) are found among the three types of objects mentioned above. However, the 6.3 m feature in PNe with normal H abundances and compact H II regions is blue-shifted to 6.220.01 (from 13 objects in Peeters et al. 2002) and it is generally narrower (FWHM=0.130.02). This is shown in Figure 15, which clearly shows the different central wavelenghts of the 6.3 m feature depending on the object type. Note also that the 6.3 m feature in the RCBs V348 Sgr, RT Nor, and Z Umi is similar to that of the H-deficient PNe (Fig. 15). Harrington et al. (1998) reported the detection of a 6.4 m feature in the H-poor PN A 78 and that they identified with the 6.4 m aromatic C-C stretch feature produced by small, H-free carbonaceous grains121212Note that the FF star V605 Aql has also been observed with Spitzer but it shows a featureless continuum with no silicate or PAH features (see e.g., Evans et al. 2006; Clayton et al. 2013).. Their low quality spectrum taken with the ISOPHOT low-resolution spectrometer did not reveal any other feature in the spectral region from 6 to 12 m. The higher quality residual Spitzer spectrum of the H-poor PN A 78 displays clear features at 6.4, 7.3, and 8.0 m. The same set of infrared features is also present in the other H-poor PNe A 30 and IRAS 18332357 (see Table 3). Residual Spitzer spectra of V CrA, S Aps, and V348 Sgr - as representative examples of ‘minority’, cool, and hot RCBs, respectively - are compared with that of PN A 30 in Figure 16. The feature to continuum ratio in H-poor PNe is even lower than in RCBs but the spectral coincidence between H-poor PNe and RCB stars suggests a similar nature and chemical composition of the dust in both circumstellar environments.
A more general search for correlations between properties (integrated flux, central wavelength, and FWHM) of the RCB dust features (at 5.9, 6.9, 7.3, 7.7, 8.1, 8.6, 9.1, and 9.6 m) and stellar (effective temperature, chemical composition) and circumstellar (blackbody temperatures, filling factor) proved negative. A variety of reasons may be suggested for this disappointment. For example, a band’s properties may be dependent on the carrier’s past exposure to photons and particles and not just to present physical conditions in the circumstellar shell. Optical depth effects may be present. Definition of a band’s properties are subject to systematic errors which differ from star-to-star; for example, the 5.9 m band is sensitive to subtraction of the underlying blackbody’s Wien tail, and many bands are dependent on how other bands, particularly adjacent bands, are fitted in the decomposition of the residual spectrum into multi-Gaussians. Yet, the wavelength agreement (Table 5) between laboratory and circumstellar bands is evidence that structures similar to amorphous carbon reside in most RCB circumstellar shells.
5 Exceptional infrared emission spectra?
Inspection of the complete suite of residual spectra shows that all but a minority may be placed in one of the classes to . This minority is discussed in this section.
V3795 Sgr: Examination of the suite of residual spectra shows that the 6-10 m emission feature generally vanishes at or about 10 m. A clear exception is shown by V3795 Sgr (Fig. 6). Figure 7 illustrates the residual spectra for four values of the interstellar E(B-V) including E(B-V)=0.0 and the value E(B-V)=0.79 recommended in Paper I (Tisserand 2012 gives E(B-V)=0.83). With the continuum fit limited to two blackbodies, the residual spectra extend clearly to 15 m with the long wavelength limit declining with increasing reddening but emission longer than 10 m cannot be eradicated by a reasonable increase of E(B-V). The shape of the residual spectrum depends sensitively on the temperature of the warmer of the two blackbodies ( K – Table 1) and modification of this temperature or introduction of a non-Planckian spectrum could alter the shape of the residual spectrum beyond 10 m. The extension to 15m also provides for an above average EQW for this class RCB star.
VZ Sgr: This star stands out in Table 1 for the EQW of the 6-10 m emission feature which is a factor of four smaller than for other stars in the class. This fourfold difference in strength is possible tied to the fact that VZ Sgr was about four magnitudes in V below maximum light.
MACHOJ181933: The S/N ratio of th Spitzer spectrum is low. The residual spectrum is noteworthy for the lack of emission at 7-8 m (Fig. 5). Given the sensitivity of the emission at 5-6 m to the Wien tail of the fitted blackbody, the weak emission in this interval may be an artefact of the subtraction procedure, i.e., MACHOJ181933 may be similar to RT Nor (see below) in having a featureless residual spectrum. Unlike RT Nor, however, MACHOJ181933’s dusty shell has a covering factor not of 1% but of 50% when the two blackbodies are combined (Table 1).
DY Per: The Spitzer observations of this cool RCB did not extend shorter than 10 m so that the shape of the 6-10 m emission feature cannot be determined. The available spectrum from 10 to 36 m is distinctive in that the 11.3 and 12.7 m PAH-like features are prominent (Fig. 10). These features occurs also in V854 Cen, DY Cen, and HV 2671, RCBs with modest H deficiencies. This suggests that the DY Per’s circumstellar shell is not terribly H-poor, something that seems to be confirmed by our unpublishd spectra of the CH Fraunhofer G-band.
V482 Cyg: This RCB star is a very peculiar case. The Spitzer residual spectrum display the 6-10 m RCB feature but the 11.3 and 12.7 m features that may be attributed to PAHs also appear weakly in the spectrum of V482 Cyg (Fig. 10). According to Asplund et al (2000), this RCB star is supposed to be extremely H-deficient and detection of 11.3 and 12.7 m emission come us as total surprise. Interestingly, the characteristics (i.e., the central wavelength) of its 6.3 m feature are similar to the other RCB stars with normal hydrogen abundances such as DY Cen, V854 Cen, and HV 2671. V482 Cyg is known to have a K5III companion only 6” away (e.g., Rao & Lambert 1993). However, the Spitzer SL aperture aperture (where the 11.3 and 12.7 m PAH-like features are seen) is only 3.7”. Thus, contamination by the nearby companion can be excluded.
RT Nor: This RCB is one of the few RCBs with a weak infrared excess: i.e., = 0.01 in Table 1. Given the low S/N ratio of the Spitzer spectrum and the weak infrared emission, it is not surprising that the residual spectrum is ill-defined. The blackbody fits are not so good as for the other RCBs and the real continuum may not be a composite of blackbody spectra. The 6-10m emission is peculiar, peaking at 7.3 m and there is an apparent 14-18 m broad emission in the resulting residual spectrum (Fig. 4), but one may draw in a non-Planckian continuum relative to which the residual spectrum vanishes. RT Nor is not alone in our sample in having a low value of . Y Mus also has = 0.01. The residual spectrum for Y Mus (Fig. 5) is also peaked at about 7.3 m and there is no obvious significant emission from 14 to 18 m.
MV Sgr: This is an exceptional star in our sample in that the excess emission peaks at about 25 m corresponding to a blackbody of about 200 K. MV Sgr has not had a decline since at least 1986 so that this fact may account for the presence of much cooler dust in this star. This excess declines towards shorter wavelengths but we still see the signature of the 6-10m RCB dust complex. Ground-based photometry at JHKLMN (see Paper I) show an excess over the stellar flux for a hot (15400 K) star indicating the presence of hot (1500-1600 K) dust in addition to the 200 K dust, both with sizeable covering factors ( = 0.33 for the 1500 K dust and = 0.18 for the 200 K dust). The broad 6-10m emission feature coincides with the interval where the warm and cold dust contribute about equally to the circumstellar flux. Changes in one or both of the blackbody contributions affect the definition (e.g., the long-wavelength end) of the emission feature, as would the introduction of flux from dust at an intermediate temperature. The MV Sgr 6-10m emission shows the peculiarity of the 7.3 m feature being the most intense feature. This contrasts with the case of V348 Sgr, another hot RCB where the 8.1 m feature dominates in the 6-10 m interval.
V348 Sgr: Although V348 Sgr is among the least H-poor of RCBs (Jeffery 1995) and of a similar effective temperature to similarly ‘H-rich’ RCBs as DY Cen and HV 2671, its residual spectrum is unlike the latter pair and resembles the spectra of H-poor RCBs.
6 Conclusions
We have presented and discussed residual Spitzer/IRS spectra for a sample of 31 RCB stars, including warm RCB stars across the chemical composition range observed, the coolest RCB stars, and minority RCBs. The RCB dust features present in the residual spectra do not strongly depend on the adopted interstellar reddening as shown by our distinction between the least reddening and more reddening RCB stars.
A broad 6-10 m dust emission feature is detected in the residual spectra of almost all RCB stars with extreme H-deficiencies. In the few brightest RCBs, the 6-10 m dust emission complex is accompanied by a secondary and weaker broad 11.5-15 m emission feature. These broad features were previously seen in the lower S/N ISO spectra of R CrB and RY Sgr but the Spitzer/IRS observations presented here reveal the detailed structure within the broad 6-10 m dust emission complex for the first time. Depending on the relative strenghts of two principal sets of emission features (the 6.3m and 7.7-9.6m features and the 6.9m feature), extremely H-poor RCB stars may be classified in several classes from to . The few least H-deficient RCBs except for V348 Sgr, however, display much richer infrared spectra, with the presence of narrower features that may be attributed to PAHs and fullerene-related molecules.
By using the highest-quality RCB residual spectra (e.g., UW Cen) as a reference, we find that the 6-10 m RCB complex is resolvable into indivivual emission features at 5.9, 6.3, 6.9, 7.3, 7.7, 8.1, 8.6, 9.1, and 9.6 m. A multi-Gaussian fit across the RCB sample shows that these infrared emission features have similar wavelengths and widths. Interestingly, we find a reasonably good agreement between the circumstellar wavelengths and those measured in the laboratory for small carbon particles such as amorphous carbon and HAC grains with little H. We conclude that infrared emission features in the H-poor environments of RCBs are consistent with the carriers being amorphous carbonaceous solids with little or no hydrogen. In addition, the spectral coincidence between RCB stars and H-poor PNe suggests a similar nature and chemical composition of the dust in both circumstellar environments.
Remarkably, the wavelength position of the 6.3 m emission feature is found to be dependent on the object type; mildly H-deficient and extremely H-deficient RCBs and H-poor PNe. However, our general search for correlations between the characteristics of the RCB infrared emission features (central wavelength, integrated flux, FWHM) and stellar (effective temperature, chemical composition) and circumstellar (blackbody dust temperature, filling factor) properties has been proved negative. This possibly suggests that the RCB dust features are sensitive to the chemical composition and thermal/photochemical history of the amorphous carbon solids in the circumstellar shells rather than to the actual physical conditions around RCBs.
References
- Asplund et al. (2000) Asplund, M., Gustafsson, B., Lambert, D. L., Rao, N. K. 2000, A&A, 353, 287
- Carpentier et al. (2012) Carpentier, Y., Féraud, G., Dartois, E. et al. 2012, A&A, 548, A40
- Chiar & Tielens (2006) Chiar, J. E., & Tielens, A. G. G. M. 2006, ApJ, 637, 774
- Clayton (1996) Clayton, G. C. 1996, PASP, 108, 225
- Clayton (2012) Clayton, G. C. 2012, JAAVSO, 40, 539
- Clayton et al. (2013) Clayton, G. C., Bond, H. E., Long, L. A. et al. 2013, ApJ (in press; arXiv: 1305.6563)
- Clayton et al. (2011b) Clayton, G. C., De Marco, O., Whitney, B. A. et al. 2011b, AJ, 142, 54
- Clayton et al. (2007) Clayton, G.C., Geballe, T.R., Herwig, F., Fryer, C. & Asplund, M. 2007, ApJ, 662, 1220
- Clayton et al. (2005) Clayton, G.C., Herwig, F., Geballe. T.R., Asplund, M., Tenenbaum, E.D., Engelbracht, C.W., & Gordon, K.D. 2005, ApJ, 623, L141
- Clayton et al. (2011) Clayton, G. C., Sugerman, B. E. K., Stanford, S. A. et al. 2011a, ApJ, 743, 44
- Colangeli et al. (1995) Colangeli, L., Mennella, V., Palumbo, P., Rotundi, A., Bussoletti, E. 1995, A&AS, 113, 561
- De Marco et al. (2002) De Marco, O., Clayton, G. C., Herwig, F., et al. 2002, AJ, 123, 3387
- Evans et al. (2006) Evans, A., Tyne, V. H., van Loon, J. Th. et al. 2006, MNRAS, 373, L75
- Feast et al. (1997) Feast, M. W., Carter, B. S., Roberts, G., Marang, F., Catchpole, R. W. 1997, MNRAS, 285, 317
- Forrest, Gillett & Stein (1972) Forrest, W. J., Gillett, F. C., & Stein, W. A. 1972, ApJ, 178, L17
- García-Hernández et al. (2009) García-Hernández, D. A., Hinkle, K. H., Lambert, D. L., Eriksson, K. 2009, ApJ, 696, 1733
- García-Hernández et al. (2011) García-Hernández, D. A., Iglesias-Groth, S., Acosta-Pulido, J. A. et al. 2011, ApJ, 737, L30
- García-Hernández et al. (2010a) García-Hernández, D. A., Lambert, D. L., Rao, N. K., Hinkle, K. H., Eriksson, K. 2010a, ApJ, 714, 144
- García-Hernández et al. (2010b) García-Hernández, D. A., Manchado, A., García-Lario, P. et al. 2010b, ApJ, 724, L39
- García-Hernández, Rao & Lambert (2011a) García-Hernández, D. A., Rao, N. K., & Lambert, D. L. 2011a, ApJ, 739, 37 (Paper I)
- García-Hernández, Rao & Lambert (2011b) García-Hernández, D. A., Rao, N. K., & Lambert, D. L. 2011b, ApJ, 729, 126
- García-Hernández, Rao & Lambert (2012) García-Hernández D. A., Rao, N. K., & Lambert, D. L. 2012, ApJ, 759, L21
- García-Hernández et al. (2012) García-Hernández, D. A., Villaver, E., García-Lario, P. et al. 2012, ApJ, 760, 107
- Harrington et al. (1998) Harrington, J. P., Lame, N. J., Borkowski, K. J., Bregman, J. D., Tsvetanov, Z. I. 1998, ApJ, 501, L123
- Hony et al. (2001) Hony, S., Van Kerckhoven, C., Peeters, E., Tielens, A. G. G. M., Hudgins, D. M., Allamandola, L. J. 2001, A&A, 370, 1030
- Jäger et al. (2008) Jäger, C., Mutschke, H., Henning, Th. & Huisken, F. 2008, ApJ, 689, 249
- Jeffery (1995) Jeffery, C. S. 1995, A&A, 297, 779
- Jeffery et al. (2011) Jeffery, C. S., Karakas, A. I., & Saio, H. 2011, MNRAS, 414, 3599
- Lambert & Rao (1994) Lambert, D. L., & Rao, N. K. 1994, JApA, 15, 47
- Lambert et al. (2001) Lambert, D. L., Rao, N. K., Pandey, G., Ivans, I. I. 2001, ApJ, 555, 925
- Leão et al. (2007) Leão, I. C., de Laverny, P., Chesneau, O., Mékarnia, D., de Medeiros, J. R. 2007, A&A, 466, L1
- Longland et al. (2011) Longland, R., Lorén-Aguilar, P., José, J., García-Berro, E., Althaus, L. G., Isern, J. 2011, ApJ, 737, L34
- Menon et al. (1012) Menon, A., Herwig, F., Denissenkov, P. A., Clayton, G.C., Staff, J., Pignatari, M. & Paxton, B. 2012, astro-ph 1211.3392
- Nandy, Rao & Morgan (1986) Nandy, K., Kameswara Rao, N., & Morgan, D. H. 1986, in “Hydrogen Deficient Stars and Related Objects”, Proceedings of IAU Colloq. 87. Eds. K. Hunger, D. Schönberner, & N. Kameswara Rao. Dordrecht, D. Reidel Publishing Co. (Astrophysics and Space Science Library. Volume 128), p.203
- Pandey & Lambert (2011) Pandey, G., & Lambert, D. L. 2011, ApJ, 727, 122
- Peeters et al. (2002) Peeters, E., Hony, S., Van Kerckhoven, C., Tielens, A. G. G. M., Allamandola, L. J., Hudgins, D. M., Bauschlicher, C. W. 2002, A&A, 390, 1089
- Rao & Lambert (1993) Rao, N. K., & Lambert, D. L. 1993, PASP, 105, 574
- Rao & Nandy (1986) Rao, N. K., & Nandy, K. 1986, MNRAS, 222, 357
- Schlegel et al. (1998) Schlegel, D.J., Finkbeiner, D.P., & Davis, M. 1998, ApJ, 500, 525
- Sloan et al. (2007) Sloan, G. C., Jura, M., Duley, W. W. et al. 2007, ApJ, 664, 1144
- Sloan et al. (2003) Sloan, G. C., Kraemer, K. E., Price, S. D., Shipman, R. F. 2003, ApJS, 147, 379
- Staff et al. (2012) Staff, J., Menon, A., Herwig, F. et al. 2012, ApJ, 757, 76
- Stein et al. (1969) Stein, W. A., Gaustad, J., Gillett, F. C., Knacke, R. F. 1969, ApJ, 155, L3
- Tielens (2008) Tielens, A. G. G. M. 2008, ARA&A, 46, 289
- Tisserand (2012) Tisserand, P. 2012, A&A, 539, A51
- Williams et al. (2012) Williams, P. M., van der Hucht, K. A., van Wyk, F., Marang, F., Whitelock, P. A., Bouchet, P., Setia Gunawan, D. Y. A. 2012, MNRAS, 420, 2626
- Woitke et al. (1996) Woitke, P., Goeres, A., & Sedlmayr, E. 1996, A&A, 313, 217
- Zhang & Jeffery (2012) Zhang, X., & Jeffery, C. S. 2012, MNRAS, 426, L81
| RCB star | Tstar | TBB1 | RBB1 | TBB2 | RBB2 | EQW6-10μm | Var.a | E(B-V)b | IR Class |
|---|---|---|---|---|---|---|---|---|---|
| (K) | (K) | (K) | (m) | ||||||
| RY Sgr | 7200 | 675 | 0.20 | 0.26c | min | 0.00 | |||
| R CrB | 6750 | 950 | 0.30 | 0.88c | max | 0.00 | |||
| Z UMi | 5200 | 710 | 0.43 | 0.32 | min | 0.00 | |||
| S Aps | 4200 | 730 | 0.37 | 0.27 | max | 0.05 | |||
| U Aqr | 5000 | 473 | 0.23 | 140 | 0.021 | 0.29 | max | 0.05 | |
| WX CrA | 4200 | 575 | 0.15 | 120 | 0.006 | 0.25 | max | 0.06 | |
| V854 Cen | 6750 | 900 | 0.32 | 140 | 0.030 | 0.87d | min | 0.07 | |
| V CrA | 6500 | 552 | 0.38 | 156 | 0.020 | 0.11 | max | 0.14 | |
| HV2671 | 20000 | 590 | 0.36 | 150 | 0.268 | 0.76e | 0.15 | ||
| RS Tel | 6750 | 830 | 0.25 | 135 | 0.005 | 0.21 | max | 0.17 | |
| V1157 Sgr | 4200 | 770 | 0.59 | 120 | 0.007 | 0.19 | min | 0.30 | |
| VZ Sgr | 7000 | 750 | 0.17 | 140 | 0.008 | 0.09 | min | 0.30 | |
| UW Cen | 7500 | 636 | 0.44 | 120 | 0.013 | 0.21 | max | 0.32 | |
| ES Aql | 4500 | 774 | 0.49 | 0.18 | max | 0.32 | |||
| RT Nor | 6700 | 365 | 0.01 | 152 | 0.001 | 0.20 | max | 0.39 | |
| V1783 Sgr | 5600 | 560 | 0.28 | 0.50 | max | 0.42 | |||
| MV Sgr | 15400 | 1640 | 0.32 | 207 | 0.160 | 0.90 | max | 0.43 | |
| V348 Sgr | 20000 | 707 | 0.63 | 100 | 0.035 | 0.36f | min | 0.45 | |
| DY Cen | 19500 | 272 | 0.09 | 2.76g | max | 0.47 | |||
| DY Per | 3000 | 1400 | 0.31 | max | 0.48 | ||||
| V517 Oph | 4100 | 886 | 0.84 | min | 0.50 | ||||
| SU Tau | 6500 | 637 | 0.45 | max | 0.50 | ||||
| Y Mus | 7200 | 395 | 0.01 | 0.38 | max | 0.50 | |||
| V739 Sgr | 5400 | 640 | 0.59 | 100 | 0.005 | 0.18 | max | 0.50 | |
| MACHOJ181933 | 4200 | 710 | 0.48 | 130 | 0.022 | 0.03 | max | 0.50 | |
| RZ Nor | 5000 | 698 | 0.53 | 325 | 0.035 | 0.44 | max | 0.50 | |
| V482 Cyg | 4800 | 590 | 0.03 | 150 | 0.001 | 0.39 | max | 0.50 | |
| SV Sge | 4200 | 475 | 0.05 | 370 | 0.024 | 0.50 | max | 0.83 | |
| V3795 Sgr | 8000 | 610 | 0.31 | 1.1 | max | 0.79 | |||
| UV Cas | 7200 | 510 | 0.03 | 180 | 0.001 | 0.15 | max | 0.90 | |
| FH Sct | 6250 | 540 | 0.10 | 135 | 0.002 | 0.25 | max | 1.00 |
| RCB star | 5.9m | 6.3m | 6.9m | 7.3m | 7.7m | 8.1m | 8.6m | 9.1m | 9.6m |
|---|---|---|---|---|---|---|---|---|---|
| [F, FWHM] | [F, FWHM] | [F, FWHM] | [F, FWHM] | [F, FWHM] | [F, FWHM] | [F, FWHM] | [F, FWHM] | [F, FWHM] | |
| (m[b, m]) | (m[b, m]) | (m[b, m]) | (m[b, m]) | (m[b, m]) | (m[b, m]) | (m[b, m]) | (m[b, m]) | (m[b, m]) | |
| Z UMi | 5.95[2.0, 0.41] | 6.40[2.9, 0.47] | 6.86[4.5, 0.63] | 7.32[2.8, 0.50] | 7.73[4.6, 0.59] | 8.21[5.4, 0.62] | 8.67[2.4, 0.47] | 9.12[2.5, 0.58] | 9.68[1.3, 0.57] |
| S Aps | 5.83[1.6, 0.34] | 6.39[7.1, 0.42] | 6.90[4.7, 0.44] | 7.23[1.0, 0.16] | 7.68[8.6, 0.75] | 8.15[9.7, 0.85] | 8.64[6.8, 0.72] | 9.16[3.7, 0.56] | 9.70[2.0, 0.44] |
| U Aqr | 5.86[0.2, 0.21] | 6.34[1.2, 0.45] | 6.86[1.4, 0.67] | 7.26[0.7, 0.38] | 7.61[1.4, 0.56] | 8.11[2.4, 0.63] | 8.66[2.0, 0.65] | 9.11[0.8, 0.44] | 9.68[1.0, 0.72] |
| WX CrA | 5.94[0.2, 0.21] | 6.37[2.4, 0.45] | 6.81[1.1, 0.40] | 7.28[3.0, 0.68] | 7.72[1.4, 0.48] | 8.11[2.2, 0.52] | 8.60[1.5, 0.50] | 9.10[0.6, 0.45] | 9.57[0.1, 0.51] |
| V CrA | 5.96[0.6, 0.30] | 6.33[2.3, 0.35] | 6.83[0.3, 0.32] | 7.23[0.6, 0.25] | 7.70[2.2, 0.45] | 8.14[3.4, 0.50] | 8.63[3.7, 0.58] | 9.13[1.6, 0.59] | 9.75[1.2, 0.75] |
| RS Tel | 5.90[0.3, 0.22] | 6.36[2.7, 0.37] | 6.86[2.3, 0.48] | 7.26[1.4, 0.35] | 7.73[3.6, 0.62] | 8.12[1.9, 0.52] | 8.49[2.5, 0.65] | 9.08[1.1, 0.47] | 9.62[0.2, 0.38] |
| V1157Sgr | 5.57[0.6, 0.31] | 6.39[3.7, 0.55] | 6.90[1.0, 0.45] | 7.29[1.5, 0.31] | 7.65[2.1, 0.40] | 8.15[4.8, 0.58] | 8.69[2.9, 0.43] | 9.10[1.6, 0.34] | 9.55[3.3, 0.62] |
| VZ Sgr | 6.36[1.6, 0.39] | 6.86[0.9, 0.51] | 7.19[0.5, 0.50] | 7.54[0.7, 0.45] | 8.11[1.4, 0.67] | 8.72[0.8, 0.61] | 9.18[0.4, 0.55] | 9.65[0.6, 0.55] |
| RCB star | 5.9m | 6.3m | 6.9m | 7.3m | 7.7m | 8.1m | 8.6m | 9.1m | 9.6m |
|---|---|---|---|---|---|---|---|---|---|
| [F, FWHM] | [F, FWHM] | [F, FWHM] | [F, FWHM] | [F, FWHM] | [F, FWHM] | [F, FWHM] | [F, FWHM] | [F, FWHM] | |
| (m[c, m]) | (m[c, m]) | (m[c, m]) | (m[c, m]) | (m[c, m]) | (m[c, m]) | (m[c, m]) | (m[c, m]) | (m[c, m]) | |
| UW Cen | 5.94[11.1, 0.39] | 6.38[10.0, 0.39] | 6.70[3.7, 0.23] | 7.23[17.0, 0.70] | 7.69[5.6, 0.36] | 8.06[23.5, 0.63] | 8.62[14.0, 0.59] | 9.12[0.3, 0.27] | 9.50[1.5, 0.35] |
| ES Aql | 5.97[0.5, 0.20] | 6.36[3.2, 0.49] | 6.85[1.5, 0.38] | 7.24[0.9, 0.25] | 7.65[3.2, 0.50] | 8.10[3.9, 0.54] | 8.63[2.8, 0.58] | 9.13[0.6, 0.33] | 9.54[0.6, 0.49] |
| RT Nor | 5.96[0.03, 0.22] | 6.41[0.3, 0.37] | 6.86[0.3, 0.48] | 7.29[0.3, 0.35] | 7.73[0.09, 0.42] | 8.18[0.09, 0.52] | 8.49[0.1, 0.65] | 9.08[0.1, 0.47] | 9.62[0.05, 0.38] |
| V1783Sgr | 5.91[2.6, 0.30] | 6.37[10.6, 0.60] | 6.90[7.0, 0.50] | 7.27[5.5, 0.40] | 7.67[9.7, 0.54] | 8.27[17.2, 0.79] | 8.89[7.5, 0.64] | 9.40[5.1, 0.70] | 9.96[6.0, 0.81] |
| MV Sgr | 5.97[3.3, 0.28] | 6.38[1.3, 0.51] | 6.84[1.1, 0.46] | 7.26[1.3, 0.45] | 7.70[1.4, 0.55] | 8.11[1.1, 0.55] | 8.58[1.6, 0.63] | 9.10[1.2, 0.57] | 9.66[1.3, 0.58] |
| V348Sgr | 5.95[4.7, 0.38] | 6.41[6.5, 0.41] | 6.88[3.2, 0.46] | 7.28[4.4, 0.40] | 7.70[10.5, 0.55] | 8.11[11.0, 0.52] | 8.58[13.8, 0.65] | 9.15[11.0, 0.67] | 9.79[11.1, 0.85] |
| Y Mus | 6.35[0.6, 0.48] | 6.80[0.4, 0.35] | 7.28[0.7, 0.44] | 7.70[0.5, 0.43] | 8.12[0.4, 0.48] | 8.63[0.4, 0.50] | 9.15[0.2, 0.34] | 9.66[0.1, 0.39] | |
| V739Sgr | 5.84[0.4, 0.25] | 6.36[1.3, 0.35] | 6.84[1.2, 0.50] | 7.26[0.6, 0.60] | 7.69[1.8, 0.44] | 8.11[2.0, 0.50] | 8.61[2.1, 0.59] | 9.20[1.8, 0.67] | 9.82[1.2, 0.45] |
| MACHOJ18 | 5.92[0.5, 0.34] | 6.34[0.3, 0.37] | 8.11[0.1, 0.28] | ||||||
| RZ Nor | 6.33[7.0, 0.43] | 6.80[6.5, 0.48] | 7.24[6.4, 0.44] | 7.68[11.0, 0.57] | 8.17[8.5, 0.47] | 8.61[8.5, 0.53] | 9.09[6.5, 0.64] | 9.65[7.4, 0.76] | |
| V482Cyg | 5.69[0.07, 0.22] | 6.28[1.8, 0.46] | 6.76[2.0, 0.54] | 7.24[1.8, 0.54] | 7.77[2.3, 0.79] | 8.09[2.2, 0.79] | 8.58[1.2, 0.54] | 9.03[0.7, 0.53] | 9.69[0.2, 0.45] |
| SV Sge | 5.78[3.1, 0.45] | 6.37[15.8, 0.69] | 6.84[3.8, 0.40] | 7.29[13.9, 0.63] | 7.80[5.3, 0.44] | 8.16[8.1, 0.64] | 8.88[10.0, 0.95] | 9.59[4.5, 0.63] | |
| V3795Sgr | 5.60[2.2, 0.56] | 6.38[17.3, 0.69] | 6.88[10.0, 0.82] | 7.21[15.8, 0.80] | 7.68[17.8, 0.77] | 8.16[17.5, 0.67] | 8.65[15.0, 0.66] | 9.22[19.5, 0.82] | 9.89[11.8, 0.74] |
| UV Cas | 6.32[1.0, 0.33] | 6.72[0.6, 0.30] | 7.27[1.3, 0.42] | 7.67[0.9, 0.41] | 8.12[2.2, 0.58] | 8.65[1.0, 0.47] | 9.17[0.3, 0.42] | 9.68[0.4, 0.40] | |
| FH Sct | 5.92[4.2, 0.31] | 6.37[2.7, 0.41] | 6.81[1.3, 0.36] | 7.21[1.8, 0.41] | 7.64[2.3, 0.52] | 8.10[2.5, 0.58] | 8.61[1.9, 0.53] | 9.20[1.3, 0.61] | 9.76[1.5, 0.63] |
| H-rich RCBs | |||||||||
| V854 Cen | 5.97[15.0, 0.22] | 6.27[84.5, 0.24] | 6.58[52.5, 0.50] | 7.02[70.0, 0.64] | 7.87[314.0, 0.85] | 8.51[86.0, 0.55] | 9.11[38.7, 0.53] | 9.79[14.0, 0.64] | |
| HV2671 | 5.83[0.2, 0.30] | 6.24[0.6, 0.38] | 6.75[0.6, 0.55] | 7.29[0.5, 0.41] | 7.65[0.9, 0.58] | 8.10[0.2, 0.40] | 8.58[0.5, 0.56] | 9.13[0.06, 0.32] | 9.69[0.03, 0.32] |
| DY Cen | 6.25[3.3, 0.22] | 6.58[3.3, 0.47] | 7.02[3.5, 0.38] | 7.74[16.3, 0.81] | 8.55[4.7, 0.57] | 9.14[1.2, 0.79] | 9.79[1.9, 0.84] | ||
| H-poor PNed | |||||||||
| A 78 | 6.43[0.3, 0.32] | 7.31[0.2, 0.20] | 7.96[0.1, 0.29] | ||||||
| A 30 | 6.40[0.4, 0.35] | 7.33[0.3, 0.27] | 7.96[0.1, 0.32] | ||||||
| IRAS 18332357 | 6.40[0.2, 0.34] | 7.29[0.2, 0.31] | 7.96[0.03, 0.22]e |
| Least-reddened RCBsa | More-reddened RCBsb | ||||
|---|---|---|---|---|---|
| Feature | FWHM | FWHM | |||
| (m) | (m) | (m) | (m) | ||
| 5.9m | 5.860.14 | 0.290.08 | 5.870.12 | 0.330.11 | |
| 6.3m | 6.370.03 | 0.430.06 | 6.360.03 | 0.470.12 | |
| 6.9m | 6.860.03 | 0.490.12 | 6.820.06 | 0.450.14 | |
| 7.3m | 7.260.04 | 0.390.16 | 7.260.03 | 0.490.15 | |
| 7.7m | 7.670.07 | 0.540.12 | 7.700.04 | 0.520.13 | |
| 8.1m | 8.140.03 | 0.610.11 | 8.130.05 | 0.570.13 | |
| 8.6m | 8.640.07 | 0.580.10 | 8.640.11 | 0.610.12 | |
| 9.1m | 9.120.03 | 0.500.09 | 9.160.09 | 0.540.17 | |
| 9.6m | 9.650.07 | 0.570.13 | 9.700.13 | 0.570.17 |
| AC Samplesa | RCBsb | |||
|---|---|---|---|---|
| ACH2 | ACAR | BE | MeanAC | MeanRCBs |
| (m) | (m) | (m) | (m) | (m) |
| 5.84 | 5.80 | 5.82 | 5.840.03 | |
| 6.22 | 6.40 | 6.33 | 6.32 | 6.370.03 |
| 6.93 | 6.91 | 6.95 | 6.93 | 6.850.05 |
| 7.28 | 7.29 | 7.24 | 7.27 | 7.250.03 |
| 8.10 | 7.96 | 7.72 | 7.93 | 8.140.05 |
| Band | Assignment | ||
|---|---|---|---|
| (m) | |||
| 5.78 - 5.81 | -C=O stretch | ||
| 6.23 - 6.28 | -C=C- stretch | ||
| 6.83 - 6.87 | -C-H deformation | ||
| 7.25 - 7.35 | -C-H deformation | ||
| 7.81 - 7.87 | -C-C- stretch | -C-H deformation | |
| 8.73 - 8.92 | -C-C- stretch | -C-H deformation | |
| 11.6 - 11.8 | =C-H out of plane, | 1 H, 2 adjacent H | |
| 13.4 - 13.6 | =C-H out of plane, | 3-5 adjacent H |