The Cosmic Infrared Background Experiment (CIBER): the Narrow Band Spectrometer
Abstract
We have developed a near-infrared spectrometer designed to measure the absolute intensity of the Solar 854.2 nm Ca II Fraunhofer line, scattered by interplanetary dust, in the Zodiacal light spectrum. Based on the known equivalent line width in the Solar spectrum, this measurement can derive the Zodiacal brightness, testing models of the Zodiacal light based on morphology that are used to determine the extragalactic background light in absolute photometry measurements. The spectrometer is based on a simple high-resolution tipped filter placed in front of a compact camera with wide-field refractive optics to provide the large optical throughput and high sensitivity required for rocket-borne observations. We discuss the instrument requirements for an accurate measurement of the absolute Zodiacal light brightness, the measured laboratory characterization, and the instrument performance in flight.
1 Introduction
The intensity of the infrared Extragalactic Background Light (EBL) is a cornerstone of cosmological observations, a measure of the total radiation produced by stellar nucleosynthesis and gravitational accretion over cosmic history. Accurate measurements can determine if the EBL is consistent with the calculated surface brightness from galaxy counts, or if an additional background component is present, e.g., unaccounted flux from known galaxies or missing galaxy populations. Furthermore, light from the epoch of reionization must contribute to the total EBL, with Lyman cutoff and Lyman- features originating at redshifted into the near-infrared (NIR) wavelength band.
Current direct measurements of the NIR EBL intensity are mutually inconsistent. The dominant factor causing this discrepancy arises not from instrumental effects, but from different approaches to astrophysical foreground removal. In the NIR, all astronomical observations taken 1 AU from the Sun are completely dominated by Zodiacal Light (ZL). ZL originates from interplanetary dust scattering sunlight at optical and near-infrared wavelengths, and emitting thermal radiation at mid-infrared to far-infrared wavelengths. In the early 1990’s, the Diffuse Infrared Background Experiment (DIRBE) produced absolute measurements of the astrophysical sky brightness in multiple bands over a wide range of Solar elongation angles (Hauser et al., 1998). A model of ZL based on morphology derived from annual modulation of the signal measured by DIRBE was developed for subtracting the ZL foreground in order to assess the EBL (Kelsall et al., 1998). Applying this model has led to high EBL estimates (Cambrésy et al., 2001; Dwek & Arendt, 1998; Matsumoto et al., 2005). Zodiacal dust models based on morphology alone are not unique, and a separate ZL model was subsequently developed based on the assumption that the mid-infrared sky brightness observed by DIRBE is entirely due to ZL (Wright, 2001). Implementing this foreground treatment led to a significant decrease in estimated EBL levels (Levenson et al., 2007). Dwek et al. (2005) make the important observation that a 23% underestimate in ZL intensity in the Kelsall et al. (1998) model would account for the entire observed NIR EBL excess, as the residual EBL spectrum displays the same color as ZL within the statistical uncertainties. An independent test of the ZL contribution to total sky brightness is needed.
Solar Fraunhofer lines scattered by interplanetary dust provide an alternative method of estimating ZL brightness. As the equivalent widths of Fraunhofer lines are accurately known in the Solar spectrum, a measurement of the line in scattered light is directly related to the ZL continuum brightness. Empirically, the measured equivalent width of Fraunhofer lines in ZL matches the Solar spectrum to (Beggs et al., 1964). Early measurements by Dube et al. (1977) were the first to estimate ZL from its Fraunhofer signature. Bernstein et al. (2002a) attempted to measure the optical EBL using a combination of absolute sky brightness measurements with the Hubble Space Telescope and Fraunhofer line measurements with a ground-based telescope. This pioneering measurement was complicated by atmospheric airglow emission, but also by systematic uncertainties from atmospheric scattering, ground scattering, and stray light (Mattila, 2003). Mattila et al. (2011) have developed a technique to remove ZL by measuring the difference in brightness between a high-latitude dark nebula and its surrounding area, using Fraunhofer line measurements to remove diffuse Galactic light from starlight scattered by interstellar dust. They have applied this technique to estimate the EBL at 400 nm and provide an upper limit at 520 nm. A recent re-analysis of Pioneer 10 and 11 optical data at 440 nm and 640 nm from outside the Zodiacal cloud (Matsuoka et al., 2011) also derive an EBL that is consistent with Mattila et al. (2011). These measurements, done with a model-independent ZL foreground estimation, suggest a total EBL consistent with the integrated light from galaxies in the optical.
In this paper, we describe the design and implementation of a Narrow Band Spectrometer (NBS) aboard the Cosmic Infrared Background Experiment (CIBER) sounding rocket payload (see Zemcov et al., 2011). The instrument is optimized to measure ZL intensity by observing a single Fraunhofer line at 854.2 nm caused by Solar Ca II absorption, and work in synergy with a low-resolution spectrometer (LRS) (see Tsumura et al., 2011) to estimate the mean intensity of the EBL in the NIR. The LRS will measure the spectrum of the ZL (e.g. Tsumura et al. 2010) from 0.75 to m so that a determination of the ZL brightness at nm can be directly compared with predictions from ZL models based on the DIRBE 1.25 and m bands, where the EBL discrepancies are the largest. The CIBER payload also contains two wide field imaging camera (Bock et al., 2012), designed to probe the EBL through its spatial fluctuation characteristics.
2 Instrument Description
We have chosen to measure the 854.2 nm line, the strongest of the Ca II triplet lines at 849.8, 854.2 and nm. We selected a long-wavelength Fraunhofer line for comparison with the DIRBE/Kelsall model at 1.25 and m, and the nm line is the brightest non-hydrogenic Fraunhofer line, with an equivalent width (EW) of nm (Allen, 1976), at wavelengths longer than nm. We avoided hydrogen lines, which have a contribution from recombination line emission from the interstellar warm ionized medium (Martin, 1988). The narrow-band spectrometer (NBS) uses a tipped filter spectrometer with high-throughput refractive optics (Eather & Reasoner, 1969). Our goal is to make a percent-level determination of the ZL intensity, in comparison to the current 23 % error needed to explain the discrepancy between the excess EBL and galaxy counts (Dwek et al., 2005).
2.1 ZL Detection
The NBS measures the absolute sky brightness on and off a known Fraunhofer line, producing a photocurrent
| (1) |
where and are Planck’s constant and the speed of light, respectively, is the peak efficiency, is the detector throughput, is the sky surface brightness, and is the normalized instrument response function centered at wavelength . High instrument sensitivity is needed in order to make precise measurements during the short observation time available in a sounding rocket flight. In the simplified case where the sky consists of two brightness components, the ZL and the EBL, and the Fraunhofer line is unresolved, the photo currents measured on and off the line are
| (2) |
| (3) |
| (4) |
where and are the ZL and EBL continuum brightness off the line, is the equivalent width of the Fraunhofer line, and the spectral resolution is
| (5) |
Thus the estimated ZL local continuum brightness is simply
| (6) |
determined with an uncertainty given by
| (7) |
where and are the instrumental uncertainties in the on and off line detector currents. If the noise on detector current scales as the number of pixels on and off the line, the ZL sensitivity is given by
| (8) |
where is the per pixel current noise. Thus to optimize surface brightness sensitivity, we need to maximize the pixel throughput , and incorporate as many pixels on and off the line as possible.
In addition to the measurement errors, technically contains uncertainty itself, dominated by the stability of the Fraunhofer line profile over time. To quantify this contribution, we obtained publicly available high resolution spectra from the SOLIS111http://solis.nso.edu/iss/ instrument which sampled the Ca II line daily over the course of several years (2008 to 2012). The equivalent width of the line measured between 853.55 nm and 854.80 nm was observed to vary at the 0.5% level over this time period, and is therefore taken to be a highly sub-dominant source of error in ZL measurement using this technique.
In addition to raw sensitivity, we require sufficient spatial resolution to remove the foreground contribution from stars. As the Ca II Fraunhofer line is expected to have a comparable depth in the interstellar radiation field as in the Solar spectrum (Mattila, 1980b), residual starlight will add to the inferred ZL intensity in Eq. 5. We have chosen a pixel resolution of arcmin in order to mask stars down to Vega magnitude using positions and fluxes from an external catalog.
2.2 Optical Design
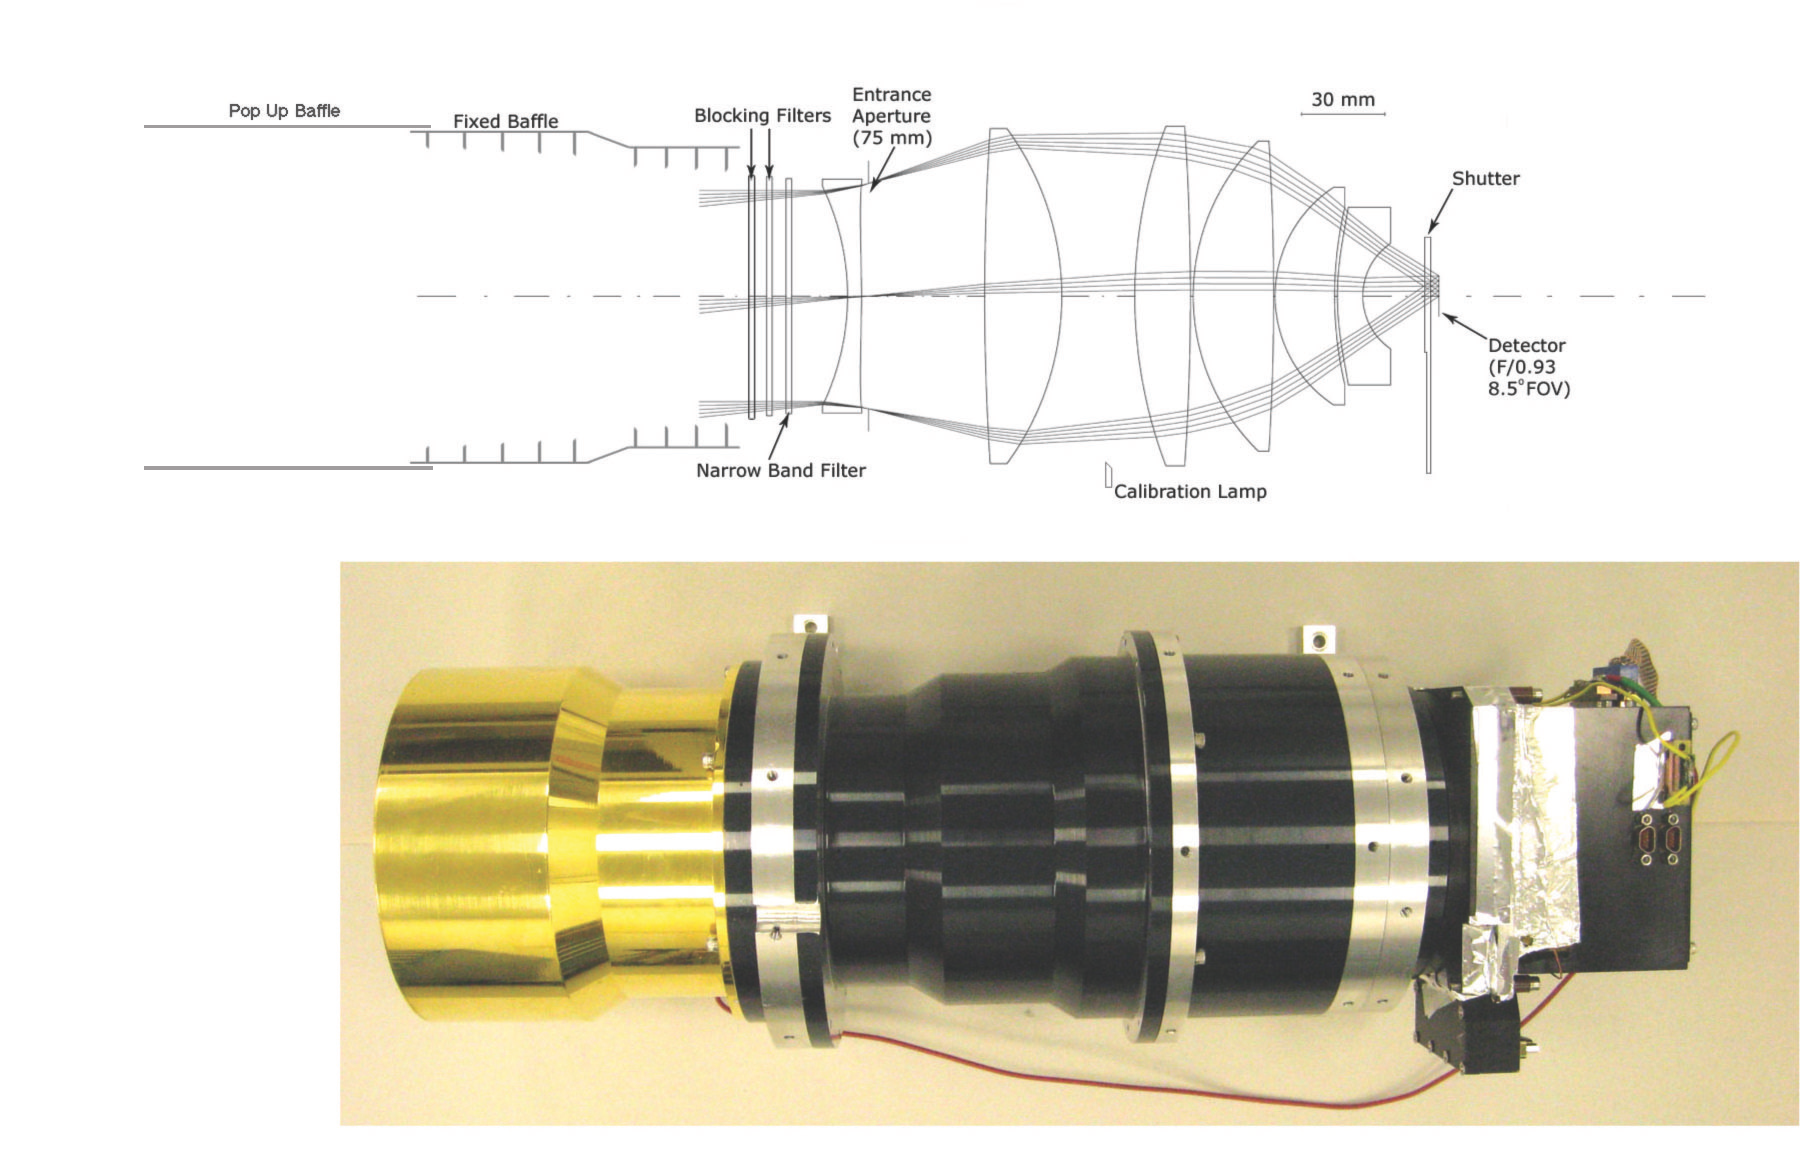
The NBS instrument uses a narrow-band interference filter placed at the aperture of an imaging camera with high-throughput refractive optics. This ‘tilted-filter photometer’ provides an intrinsic sensitivity advantage by having higher throughput than spectrometers using a prism or grating (Jacquinot 1954, Eather & Reasoner 1969). The design of the narrow-band spectrometer optics is shown in Figure 1, and detailed specifications are summarized in Table 1.
The narrow-band interference filter was fabricated by Materion Barr Precision Optics & Thin Film Coatings222http://materion.com/ to customized specifications from the science team. The filter is tipped by from normal in order to optimize sensitivity, based on the number of detectors on and off the line. The narrow-band filter is combined with two filters that provide out-of-band spectral blocking.
The wide-field camera is a refractive design with six lenses developed and manufactured by the Genesia Corporation, Japan333http://www.genesia.co.jp/ based on the cryogenic refraction measurements discussed in Yamamuro et al. (2006). The lenses are manufactured from fused silica and are spherical except for the back surface of the entrance lens and the front surface of the last lens, which are order aspheres. The lenses are anti-reflection coated for reflectance per surface at nm.
A PICNIC HgCdTe detector array manufactured by Teledyne Scientific & Imaging444http://www.teledyne-si.com/ is placed at the focus of the camera, yielding a pixel scale and an field of view on the sky. A mechanical shutter and calibration lamp are also installed in the NBS instrument (see Zemcov et al. (2011) for detailed specifications of these subsystems). The cryogenic shutter is placed between the optics and the detector array in order to monitor array dark current. A calibration lamp assembly feeds light from a light emitting diode into the optical chain with an optical fiber between the third and fourth lenses. The lamp is used as a transfer standard to track any changes in response in flight compared with the laboratory calibration.
| Optics | wide field refractive camera with 6 lenses |
|---|---|
| Filters | 2 blocking filters and 1 tipped narrow-band filter. |
| Detector | MBE HgCdTe PICNIC |
| Aperture | mm |
| 0.92 | |
| Pixel size | arcmin |
| Field of view | |
| Filter central wavelength at 295 K | nm |
| Filter central wavelength at 77 K | nm |
| Free spectral range at 77 K | nm |
| Filter resolution | |
| Filter tip angle | |
| Lens efficiency | |
| ED 541b narrow-band filter efficiency | |
| ED 536 blocking filter efficiency | |
| ED 686 blocking filter efficiency | |
| Detector QEc | |
| Total QE | |
| Correlated double sample noise | e- |
| Calculated off-line responsivityd | nW m-2 sr-1 / e- s-1 |
| a is the integral width . | |
| b ED NNN is a manufacturer’s part number. | |
| c Measured at m. | |
| d Responsivity given by in Eq. 3. | |
2.3 Filter Design
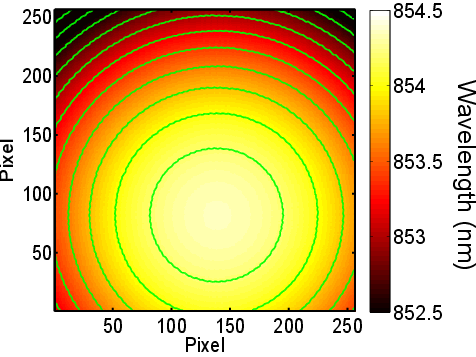
The spectrometer disperses radiation by shifting the effective filter bandpass by the change in incident angle over the field of view (FOV) according to
| (9) |
where is the response at normal incidence and the internal angle is related to the incident external angle by Snell’s law . Figure 2 shows the calculated peak wavelength response of pixels across the array using the parameters listed in Table 1, and exhibits the characteristic shift given by Equation 9. The field of view combined with the filter tip modulates the wavelength response from at normal filter incidence to at the extreme corners. The divergence-limited resolution (e.g. Bock et al. 1994) varies from at the array center to , at the minimum wavelength at the array corner. The spectral range of is sufficient to sample the ZL spectrum both on and off the Ca II nm Fraunhofer line, which itself has a width of .
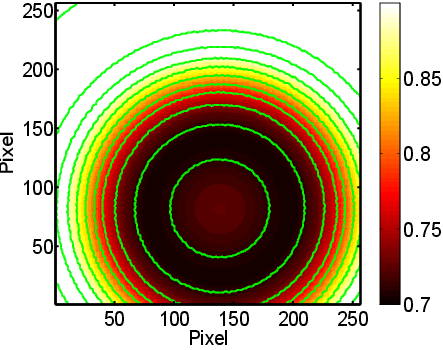
The instrument is insensitive to the choice of spectral resolution to first order (see Equation 7). However, the resolution does vary the number of pixels on and off the line. Higher resolution makes , slowly reducing sensitivity but also providing for a larger spectral contrast to ZL according to
| (10) |
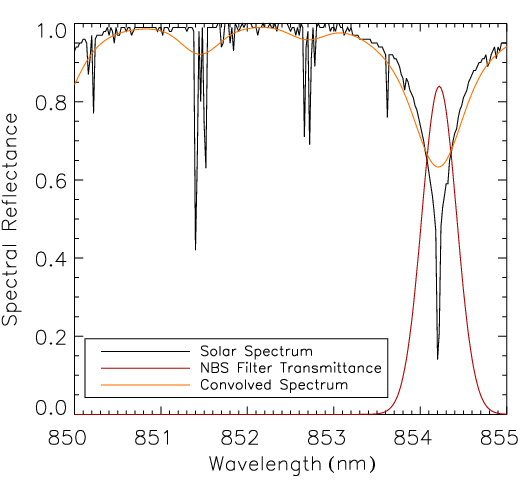
The actual response to ZL over the FOV, given the finite resolution and the finite width of the Fraunhofer line, is the convolution of the instrument response with the Solar spectrum (see Equation 1). The spectral contrast on and off the Ca II line is %, giving the characteristic pattern shown in the noiseless instrument simulation in Figure 3. Using a simulator we investigated a range of resolution and filter tips, balancing sensitivity and contrast, and determined that was a good choice. Since the wavelength response of the pixels varies with radius from the maximum wavelength, data from the NBS measures the convolved image shown in Figure 3, from which the absolute ZL brightness can be determined. The spectral response convolved with the Solar spectrum is shown in Figure 4.
2.4 Detectors and Electronics
The NBS uses a HgCdTe detector array employing a PICNIC read out integrated circuit (ROIC). A molecular beam epitaxy (MBE) process is used to provide short wavelength response compared with HgCdTe arrays fabricated on sapphire substrates (M. Farris, private communication). The detectors have a m pixel pitch, giving a large area optimal surface brightness sensitivity. A custom electronics chain is used to address pixels on the multiplexer and read out and digitize the detector signals, described in detail in Zemcov et al. (2011). The detector bias and reset voltages are trimmed as in Lee et al. (2010). We do not use the built-in buffer amplifier circuitry on the ROIC, which emits photons and increases the detector dark current, in favor of external junction field-effect transistor (JFET) source followers (Hodapp et al., 1996). Since the same detectors are used in the both the NBS and LRS, we refer the reader to Tsumura et al. (2011) for a detailed discussion of the electrical and responsivity properties of the CIBER PICNIC arrays.
3 Instrument Assembly and Laboratory Testing
We tested the instrument performance in the laboratory prior to flight. The payload section is designed to accommodate several test configurations (Zemcov et al., 2011):
-
1.
Using a vacuum lid with fused quartz windows the NBS can view external sources to measure focus, wavelength response, and absolute calibration using the SIRCUS (Spectral Irradiance and radiance Responsivity Calibrations using Uniform Sources) facility (Brown et al., 2006).
-
2.
Using a vacuum box the NBS views an integrating sphere without intervening windows to measure the flat field.
-
3.
Using the flight shutter door equipped with a radiatively cooled inner shield we can measure the noise properties and dark current under dark conditions.
3.1 Focus testing
We measure the optical focus with the CIBER cryostat outfitted with two sets of windows: warm vacuum windows installed at the bulkhead, and cold windows operating at K to intercept thermal radiation from the warm window and bulkhead. The NBS vacuum window is anti-reflection (AR) coated to eliminate reflections between the window and the NBS filters, though the cold window was not. The transmittance of the warm and cold windows at nm are and , respectively.
We introduced a collimated beam using a mm diameter Newtonian telescope with white light shining through a m diameter pinhole located at the telescope focus. The best focus of the Newtonian telescope was first determined using an auto-collimation technique with a flat mirror. We then illuminated the NBS entrance aperture with the collimated telescope beam, and the pinhole was stepped in mm increments over a mm range about the telescope focus. The best focus of the NBS was measured and the displacement from the array position, , was calculated using
| (11) |
where and are the focal lengths and and are the displacement from best focus of the collimating telescope and the NBS, respectively. The range of measurement allows a m through focus to be probed in increments of m from NBS focus. We measured focus near the center of the array, at each of the four corners of the array, and then repeated the focus test at the array center for redundancy.
Once a focus test is completed, the position of the focal plane was determined by plotting the full-width half-max spot size as a function of pinhole position. A quadratic polynomial was fit to the spot size as a function of focus position, and the minimum of this fit was taken to be the NBS array position relative to ideal focus. This program allowed us to focus the NBS to within m, well within the m depth of focus of the NBS, where is the f/# of the NBS and is the pixel size.
3.2 Wavelength Calibration
We developed a system of filters manufactured by Barr Associates consisting of a narrow-band filter and two blocking filters. Due to the precise tuning requirements, Barr measured the change in response (nm) on cooling to K on a witness filter, and calibrated the shift in response versus incident angle at room temperature. The change in response is well fit to a material index of , as shown in Figure 5. The narrow-band filter gives a peak response of nm with an integral width of nm at room temperature, which changes to nm when cooled to K. Barr measured the transmittance in 7 positions from the center to the edge at room temperature, and found an average peak transmittance of 84% and that the peak wavelength varies by nm, maximum to minimum, at different positions across the filter.

We calibrated the NBS as a function of wavelength using the SIRCUS lasers and an absolutely calibrated reference radiometer. Because the laser SIRCUS Ti-Sapphire line-width is essentially zero, the narrow band pass of the NBS is fully resolved. Etalons placed in the laser cavity provided wavelength stability and fine tuning. We measured wavelength response to an uncertainty of approximately 0.001 nm referenced to a calibrated wavemeter incorporating a stabilized HeNe laser reference. The absolute radiance of the integrating sphere, viewed by the NBS, was inferred using a monitor detector separately calibrated to an absolutely calibrated radiometer. This two-step bootstrapping approach is necessary due to the dynamic range mismatch between the radiometer and the NBS. In order to achieve sufficient signal to noise on the monitor detector, the monitor was located on a smaller fiber-fed sphere injecting light into the larger sphere viewed by the NBS. The relatively spectrally flat ratio of the large sphere radiance to the monitor signal was measured at a few wavelengths and interpolated to the NBS wavelengths. The sphere radiance was stabilized using the monitor signal and a liquid crystal laser intensity modulator. The monitor signal was recorded throughout the NBS calibration measurements.
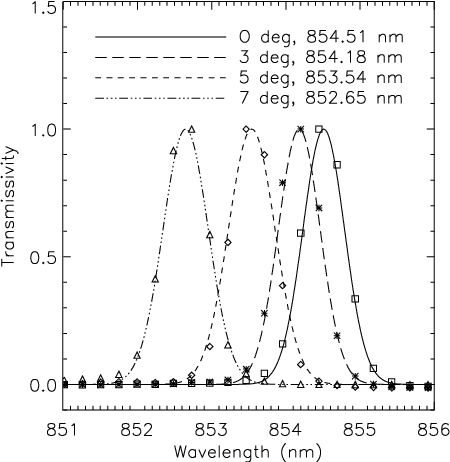
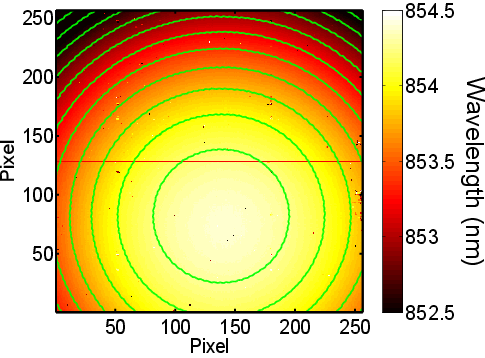
For each pixel in the array, a Gaussian spectral response function was fit to the laser data, yielding measurements of the central wavelength and integral width over the array. These data and the subsequent fits are shown in Figure 6 for a subset of individual pixels across the array. The central wavelength response over the NBS field is shown in Figure 7. The average measured resolution over all pixels is , which averages over any spatial variation in wavelength response over the narrow-band filter. The measured system wavelength response is close to the values listed in Table 1 based on the measured narrow-band filter, with a maximum wavelength of nm.
In addition to the SIRCUS facility, we can verify the reproducibility of the NBS wavelength response using an integrating sphere coupled to either a monochromator, a stabilized nm diode laser and wavemeter, or a Ne lamp with an emission line at nm, close to the NBS bandpass. These were used for quick tests to verify the wavelength calibration did not change over multiple thermal cycles and after payload vibration tests.
3.3 Anomalous Thermal Response
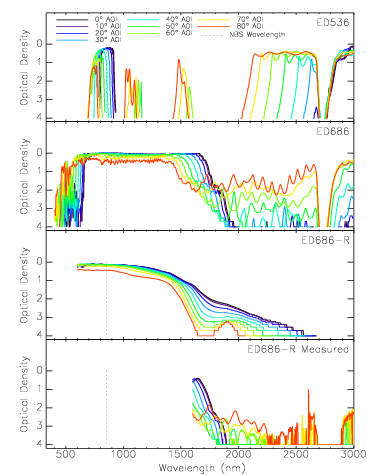
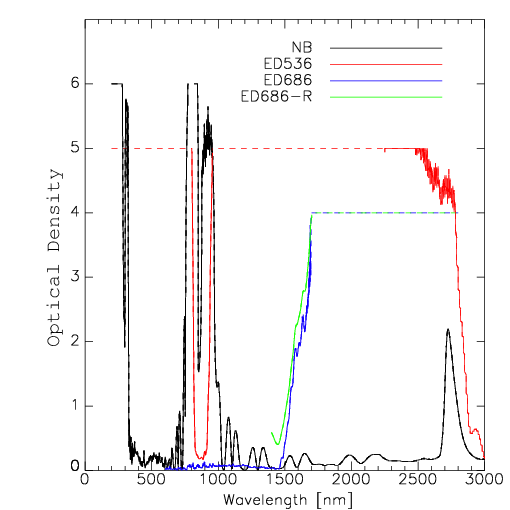
With the original filter set, consisting of the narrow-band filter and a single blocking filter (referred to as ED536), installed in the NBS instrument, we observed a significant background signal of es when looking out into a dark laboratory through the fused quartz vacuum window. By modulating the temperature of the room-temperature window and holder, we determined this radiation was thermal emission incident on the detectors. The signal greatly exceeded the expected level based on the measured on-axis filter blocking, though the source of this emission is off-axis and well outside the field of view. To reduce this radiation we added a second blocking filter, ED686 as shown in Figure 8, to improve the long-wavelength attenuation. However under the same conditions we still observed a large background level of es with the new filter in place, certainly an improvement but not the factor of reduction expected from the additional long-wavelength blocking.
The CIBER instrument was flown in its first flight with the NBS using this filter configuration. During the flight the LRS observed a large long-wavelength signal associated thermal emission from the skin of the sounding rocket, heated by air friction during ascent (Tsumura et al., 2011). The skin section had a direct view of the inside surface of the cold baffle tube and first optical element of all the imagers and spectrometers, and thus thermal radiation could scatter to the detectors. Unfortunately the NBS saw an elevated photo-current of e/s- as well, related to this thermal emission. After discussions with Barr, we determined that the filter blocking degrades at large incident angles, as shown by the model curves in Figure 8. In order to improve the large-angle performance, Barr designed and fabricated an absorbing dielectric coating to the long-wavelength ED686 blocking filter, named ED686-R in Figures 8 and 9.
According to calculations, by adding the absorbing coating, the large-angle blocking should improve by to , over the range of 0∘ to 80∘ incidence, with little loss of in-band transmission, from % to %, as measured at K. As shown in the bottom panel of Figure 8, the measured large angle performance at to angle of incidence in the nm range is better than the calculated performance without the coating, but somewhat worse than the calculated performance with the coating. The re-coated filter was installed in the instrument, and we measured a background level that was significantly reduced looking through the vacuum window, es, consistent with the measured improvement of at to .
In addition to improving the filter design, we added a cold extending/retracting baffle to extend the baffle tube beyond the heated rocket skin, eliminating all lines of sight from the skin to the optics and the inside surface of the baffle, described in detail in Zemcov et al. (2011). In the second flight the measured thermal response in the LRS was at least 100 times smaller than in the first flight, and we did not observe a measurable response in the NBS, indicating that the baffles and large-angle blocking filters performed as expected.
4 Instrumental Systematic Error Control
4.1 Requirements
The instrument design controls systematic instrumental errors by incorporating 1) a cold shutter to measure array dark current; 2) low scatter optics to eliminate stray light from off-axis sources; 3) a filtering scheme with excellent spectral blocking to control out-of-band radiation; 4) a specialized aperture-filling laboratory source to measure array flat field response; and 5) a calibration program based on laboratory measurements.
The laboratory characterization program addresses the systematic error requirements. In addition to the tests described in Section 3, these measurements include sensitivity, filter blocking, dark current, temperature stability, flat field and calibration determination.
4.2 Dark Current
The generation of charge carriers within the depletion region of HgCdTe infrared detectors leads to a small (0.1 es) dark current even in the absence of incident photons. In order to perform absolute measurements of the ZL, this dark current must be understood and removed from flight data. In flight, the dark current is monitored by closing the instrument’s cold shutter prior to launch, during data collection in the middle of the flight, and again following the vacuum shutter door close event during reentry.
To determine dark current behavior before flight, we measure the baseline dark current with the instrument in flight configuration, with the shielded vacuum door, providing a dark environment in the experiment section (Zemcov et al., 2011). The NBS cold shutter is closed during the measurement to ensure the darkest conditions possible at the detector array. To determine the dark current, the array is read out for hour in this configuration. Because resetting the array causes a transient response, the first several frames following a reset are discarded from the analysis. We fit a slope and offset over each integration, obtaining an array median dark current of es, where the uncertainty is estimated from the variance of twelve 50 s integrations. The pattern of the dark current is brightest at the array corners, suggesting residual emission from the ROIC even though we are not using the final buffer stage. In the case of the NBS, the dominant dark current characteristic for systematic control is not the mean level, but the stability of spatial morphology across the array. Gradients or features spuriously aligned with the wavelength response can produce artificial spectral structures which could mimic the Fraunhofer line. We quantified this effect through simulations as described in Section 4.8.
To verify that the dark current is stable over long periods, we periodically obtained a standard calibration set including a dark current measurement over the course of several years. Though typically taken with the light bulkhead in place of the rocket door, these measurements show that the dark current is stable over long periods and many cryogenic cycles. These long-term dark levels are consistent with the images obtained on the launch gantry just prior to flight, and the dark measurements obtained during observations with the shutter closed.
We compared dark current measurements taken with a cold lid placed at 77 K over the optics and the cold shutter open and closed, showing a DC offset of 0.33 . This indicates an additional photocurrent is present, induced by emission from the ROIC reflecting off the NBS optics. While the amplitude of this signal is large compared to the mean dark current, it has a distinctive stable spatial morphology along the array. This consists of a spatially flat component and a compact region of excess photocurrent. The reflected light can be subtracted, or the pixels in the compact region can be simply discarded in the analysis of flight data. A ZL spectrum was fit to this spatial array response to quantify the systematic contribution of this effect, if no further corrections are applied. The best fit spectrum had an amplitude of -1.88 nW m-2 sr-1, corresponding to a effect for nominal ZL intensities, assuming the calibration factor determined in Section 4.7.
4.3 Temperature stability
Because the output voltage of the ROIC varies with temperature, typically e/K, we have implemented a multi-stage temperature control system. As described in Zemcov et al. (2011), the pressure of the cryogenic bath is regulated in flight by an absolute pressure valve. In addition, the focal plane temperature is controlled in 2 thermal stages. An intermediate stage is actively regulated. The focal plane is thermally staged from the controlled stage to passively filter high-frequency temperature variations. The temperature of both stages are precisely monitored using a high-precision temperature bridge.
To verify that the regulation system works as designed, we cooled the NBS focal plane to its quiescent temperature (typically K) at which point we activated the temperature control unit. Thermometry data are collected during the time the focal plane unit takes to reach a steady operating temperature, which is set in the firmware of the thermal control unit. Though the thermal set point is adjustable, it must be set to a value larger than the highest base temperature so that it can be controlled in all instrument flight and testing configurations. At our chosen set point of K, it typically takes h for the heaters to raise the temperature of the focal plane to its set point K above the base. When stabilized, the active control proportional-integral-derivative (PID) loop controls the intermediate stage about the set point.
To quantify the systematic error on ZL intensity measurement induced by thermal instabilities, dark current was measured periodically during the stabilization process. Images were produced from dark data with thermal drifts ranging up to mK/s. This drift produces a response over the array of typically e/s. Because this response is largely spatially uniform, the effect of a thermal drift on ZL signals is minimal. After subtracting a template of dark current produced by averaging many integrations taken previously with the temperature fully controlled, a Fraunhofer line was fit to the thermally unstable data. The inferred ZL brightness was observed to depend very steeply on thermal instability, with the amplitude of the induced ZL signal falling below the statistical uncertainty (described in Section 4.8) at a drift level of mK/s, equivalent to nW m-2 sr-1in Table 2. When fully controlling, the average drift of the focal plane temperature is K/s over a 50 s integration, making the effect of thermally varying dark current a negligible systematic.
The NBS control system is powered on several hours before flight to ensure that the focal plane temperature has stabilized at launch. During flight, the temperature of both thermal bridges are telemetered to the ground. The flight data show no significant deviation from the ground behavior during astronomical observations in flight. Figure 10 of Zemcov et al. (2011) shows that the thermal drift of the NBS focal plane, at its worst during the first hundred seconds of flight, is K/s in the first s of astronomical data acquisition, which exceeds the specification. However, after this period of time the drift is K/s and thermally-induced drift is negligible.
4.4 Out of Band Blocking
For precise measurements of the Fraunhofer line brightness, we require a high degree of out-of-band blocking of the ZL continuum. The HgCdTe detectors are only responsive over a 2100 nm range spanning nm, which defines the outer wavelength limit for potential contamination. The fact that the ZL continuum peaks at optical wavelengths, and that any spectral leak is unlikely to be modulated over the field of view as the Ca II line, further reduces the systematic error from leaks. Barr originally designed a single blocking filter (ED536) to meet the blocking requirement. This filter (ED536) provides an in-band transmittance of 66 %. The blocking performance in Fig. 9 is excellent, though limited by measurement accuracy to OD.
The on-axis blocking performance of the NBS was characterized using the tunable long wavelength laser system coupled to the integrating sphere as described in Zemcov et al. (2011). The laser wavelength was changed to discrete values separated by nm over the range nm. At each wavelength step, we determined the response of the NBS by summing the photocurrent over the array. To remove the photocurrent arising from background light in the apparatus, we recorded ambient frames when the laser was shuttered. We differenced the laser on and shuttered data to measure the photocurrent arising from out-of-band light.
We simultaneously monitored the radiance incident on the NBS using a calibrated detector viewing the integrating sphere. Because the laser is capable of producing a large radiance in a narrow band, the signal to noise ratios of the measurements are large, even though the absolute response to out of band light is not. The average photocurrent arising from light is es / nW m-2 sr-1, which is consistent with the OD limit derived from direct filter testing. We produce an out-of-band spectral response function by interpolating the measurements over the range nm.
To determine if the measured out of band blocking is sufficient, we estimate the photocurrent expected in flight from ZL by assuming a Solar ZL spectrum for . The expected signal at the NBS detector is then calculated by numerically integrating the product of the ZL spectrum and our out-of-band response function which yields mes at the ecliptic pole. This results in a calculated level of and is therefore is deemed negligible.
4.5 Flat Field Determination
To measure the Fraunhofer line intensity we must first normalize the relative responsivity of the individual detector array pixels to a common value, typically termed the “flat field” correction. Because the flat field of the NBS detector array cannot be determined independently of the astrophysical signal in flight, we must measure the flat field response in the laboratory. The internal instrument calibration lamp serves as a transfer standard to verify that the responsivity has not changed between the laboratory testing and flight.
The flat field measurement consists of a quartz halogen lamp which is fiber coupled into an integrating sphere inside a vacuum chamber. We measured the output spectrum of the integrating sphere and added a filter at the lamp to synthesize a Solar spectrum over the wavelength range of interest, nm nm. The CIBER instrument shares a common vacuum space with the test chamber so there are no optical surfaces between the integrating sphere port and the NBS aperture. Since the illumination pattern of the output of the sphere has been measured to be uniform to 0.3% at angles of incidence the illumination measured at the NBS focal plane is a good tracer of the array flat field.
The flat field response is measured by turning on the quartz halogen lamp, recording an image, and then subtracting images before and after the lamp is off to remove any background signal. Finally these measurements are bracketed by dark frames to ensure that the array baseline behavior is stable. The flat field is measured at a variety of input flux levels from 1000 to 10 es to ensure the flat field measurement does not vary significantly with source brightness due to detector non-linearity.
To quantify the stability of the flat field and its effect on the instrument’s ability to accurately measure the depth of the Fraunhofer line, the measurement was repeated three independent times. Each measurement was conducted in a separate cooldown of the cryostat. To quantify stability, the amplitude of the Fraunhofer line was fit in a direct measurement of the Solar spectrum (described in detail in Section 5) using each of the three independent flat field measurements. The measured amplitude was shown to vary at the 1.4 level between each of the three measurements.
4.6 Stray Light Performance
The NBS optics must also reject sources of off-axis emission. In the case of CIBER, this is dominated by stray light from the Earth. The response to extended off-axis emission is given by Bock et al. (1995) to be
| (12) |
where is the stray light signal observed surface brightness on the sky, is the surface brightness of the emitting off-axis source, and is the telescope gain function, where is the telescope response to an off-axis point source normalized to unity on axis, and is the telescope field of view.
To measure in the laboratory, we followed the procedure described in Tsumura et al. (2011). This consisted of replacing the PICNIC array with a warm silicon photo-diode555S10043 manufactured by Hamamatsu photonics (http://www.hamamatsu.com) and mounting the NBS to a custom optical bench capable of rotation to 90∘ from on-axis. A collimated halogen source was chopped at 20 Hz as the angle to the NBS boresight was varied. The amplitude of the modulated signal was measured with a lock-in amplifier referenced to the signal from the chopper. The dynamic range of this measurement was limited due to the small bandwidth of the NBS such that the largest angle with sufficient signal to noise was 25∘ from center. At this angle, and the function displayed a sharp slope, suggesting it continues to fall at higher angles.
The night-side brightness of the earth in the NBS band is dominated by airglow emission and is approximately nW m-2 sr-1 (Leinert et al., 1998) at 854 nm. As the earth limb is off-axis during observations, the maximum projected solid angle is sr. Even in the overly conservative case in which is assumed to remain flat at to higher angles than were measured in the lab, the integral in Equation 12 results in a signal nW m-2 sr-1. We therefore conclude that off-axis emission from the earth contributes a negligible systematic error to the measurement.
4.7 Calibration
The NBS must be accurately calibrated in order to compare our ZL measurements with ZL models based on DIRBE observations. Specifically, we need to translate the NBS ZL measurements to the DIRBE m band with an accuracy of % to distinguish between models. To perform this comparison, we must absolutely calibrate the NBS, then translate the ZL brightness measured at nm to m using the CIBER-LRS ZL spectral color. To reduce the contribution of the uncertainty in the NBS calibration to the overall uncertainty in this chain, the NBS must be accurately calibrated relative to DIRBE. For comparison, the absolute calibration uncertainty in standard calibration stars like Vega is typically and the m DIRBE channel absolute calibration uncertainty is 3% (Burdick & Murdock, 1997) obtained on Sirius. In addition to the laboratory calibration we describe below, the NBS observes Vega in every flight for an independent calibration check.
A schematic representation of the NBS calibration set up is shown in Figure 15 of Zemcov et al. (2011), where light from a stable source is coupled into an integrating sphere which is viewed by the NBS and a reference detector absolutely calibrated by NIST. The radiance of the light source is varied and the response of the NBS is referenced to the detector.
Our primary photometric calibration measurements are derived from the monochromatic data described in detail in Section 3.2 which use the SIRCUS laser facility as the stabilized light source (Brown et al., 2006). The reference detectors which measure absolute radiance are constructed of single element large area Si photodiodes and baffles that limit the angular extent light reaching the detector. A smaller sphere feeding the larger sphere, which is viewed by the NBS, is constantly monitored with Si photodiodes to ensure the light levels remain known during the NBS calibration given the ratio of large sphere radiance to monitor signal previously determined with the reference detectors. Uncertainties in the deduced narrow band radiance are approximately 0.3%, dominated by contributions from the sphere uniformity and the effects of out-of-field light.
Photocurrent measurements using the laser source determine the NBS absolute responsivity, at a discrete set of wavelengths. We calculate an array-wide map of the calibration factor () for a spectrally flat source from the ratio of the measured NBS photocurrent and absolute radiance. The integral is evaluated from scans of the SIRCUS laser across a 100 nm wide range. After applying the flat field correction, described in Section 4.5, the array wide mean response factor is (nW m-2 sr-1) / (e- s-1) after correcting for the transmittance of the additional window used in the laboratory. The uncertainty in the quoted absolute calibration factor is determined by the variance across all pixels in the array, added in quadrature with the systematic uncertainty from the absolute calibration quoted by NIST.
This calibration factor was checked by coupling a supercontiuum laser source to the integrating sphere referenced to a detector system capable of spectral measurements, calibrated to measure radiance traceable to fixed-point blackbodies. The supercontinuum laser produces a relatively flat featureless spectrum across the NBS band. Measurements of the photocurrent induced by the broad band source were taken at four light levels ranging from 500 to 2000 e while simultaneously monitoring the absolute radiance of the sphere. Dark signals were referenced to the ambient light background of the laboratory. Each exposure is corrected using the flat field template described in Section 4.5. The absolute calibration factor is taken to be the slope of the linear correlation between the NIST measured absolute radiance and the mean photocurrent of each exposure. The resulting value is (nW m-2 sr-1) / (e- s-1), after correcting for the transmittance of the additional window used in the laboratory, in excellent agreement with the measurement from the narrow band source. The quoted uncertainty is dominated by instrument noise in the NIST spectrographs and linearity during the boot-strapping measurements which pushes the dynamic range of the reference spectrographs.
The SIRCUS data set provides absolute calibration and a full spectral response measurement for every pixel. This allows for a more sophisticated treatment of flight data. The response over the array may be calculated for any source spectrum using Equation 1. Thus we can make template response maps over the array to ZL and EBL that fully include flat field gain and variation in the spectral response over the array.
4.8 Sensitivity
We estimate the complete instrument sensitivity by simulating a series of s observations using measured dark data as input noise. The data used in this calculation were taken in full flight configuration on the launch gantry one day before the second CIBER flight with the cold shutter closed. There were 30 independent s integrations obtained. The variance between instances contains fluctuations in both dark current spatial morphology and correlated read noise. We added a model ZL spectrum convolved with the instrument response (e.g. Figure 7) to each independent integration. The amplitude of the Fraunhofer line in the simulated observation was then fit and compared to the input value. The measured 50 s integration sensitivity is taken to be the standard deviation of the distribution of residuals (input sky brightness - measured sky brightness), which includes all sources of correlated and uncorrelated noise over the array. The sensitivity is determined to be nW m-2 sr-1, shown in Table 2, converted to ZL units assuming the calibration factor from Section 4.7. Since the flight photocurrent varies between and es, the contribution of photon noise is small. Given the typical brightness of nW m-2 sr-1 for high ecliptic latitude ZL brightness (Tsumura et al., 2010), this leads to a % accuracy on the ZL brightness in a 50 s observation.
| Parameter | Measured Value |
|---|---|
| Mean Dark Current Stability | es |
| Focal Plane Temperature Stability | K/s |
| Spectral Resolution | 1004 12 |
| Line Contrast | % |
| Lab Responsivity | (nW m-2 sr-1) / (e- s-1) |
| Out of band spectral response | for m |
| Flat field response | gives % |
| ZL sensitivity in s () | nW m-2 sr-1 |
5 Laboratory Measurement of the Solar Spectrum
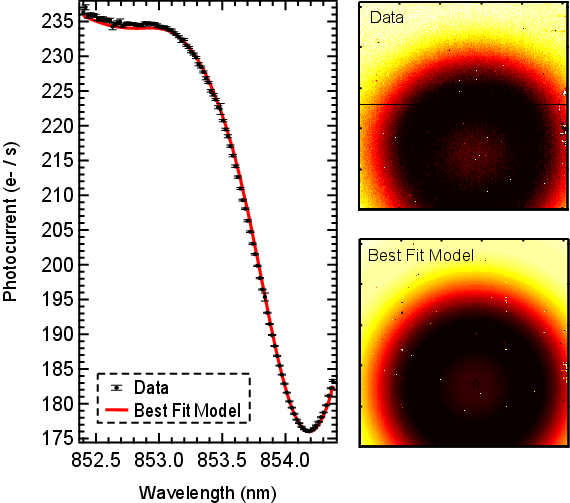
As the NBS is designed to measure absorption in Solar light scattered off the interplanetary dust cloud, a high signal to noise measurement of sunlight is a useful tool for testing end to end system functionality. To obtain these data, we pointed a long optical fiber at the Sun and coupled the other end to the integrating sphere to uniformly illuminate the NBS aperture. The coupling efficiency to the sphere was optimized to produce an array photocurrent near 200 e/s, where the signal to noise is very high in each pixel without nearing saturation. We measured the Solar spectrum presented from a 200 s exposure and the flat-field correction described in Section 4.5.
For comparison, we calculated a predicted model spectrum by convolving the high resolution Solar measurements of Delbouille et al. (1990) with the instrument spectral response function obtained from discrete-wavelength SIRCUS laser data. The model was fit to the data with a simple minimization using two free parameters: a normalization factor and an additive offset to account for stray light from the laboratory. The measured Solar spectrum is shown in Figure 10 in both one and two dimensions alongside the best fit model. With only two free parameters, the maximum deviation of the residual of data from model is 0.24.
6 Second Flight Performance
The CIBER instrument was flown on 11 July 2010 from White Sands Missile Range. During this flight the NBS performed well, with the shutter, calibration lamp, extendable/retractable baffle and array all operating normally. All flight events occurred according to the planned sequence, and the attitude control system gave stable pointing on all of the astronomical fields. The NBS obtained images of the sky in flight consistent with focus data from laboratory measurements. The CIBER instrument was recovered for post-flight testing and future flights.
The NBS photocurrents in the second flight range between es at an ecliptic latitude of to es at an ecliptic latitude of . Based on the laboratory calibration, these levels correspond to a ZL brightness ranging from 500 to 1000 nW m-2 sr-1, which matches a simple extrapolation of the DIRBE sky brightness to NBS wavelengths. There is no measurable thermal response in the NBS second flight data. The in-flight dark level obtained with the shutter closed was 0.43 e-/s, consistent with the pre-flight dark images obtained on the launch gantry. The array temperature was stable in flight, giving a maximum drift of 5.3 K / s over a 50 s integration during astronomical observations.
7 Astrophysical Systematics
In addition to instrumental effects, estimating the ZL intensity from a Fraunhofer line is subject to several astrophysical systematic errors.
7.1 Dynamical Effects
The Fraunhofer line profile can be altered by dynamical effects within the interplanetary dust cloud. Reynolds et al. (2004) have done an extensive study of these effects using the Mg I Fraunhofer line at 581.4 nm along various lines of sight. The Doppler inferred velocity of the line was found to depend strongly on the Solar elongation angle, , with peak magnitudes of 15 km/s around . At the spectral resolution of the NBS (shown in Table 2), this effect is barely detectable ( smaller than the instrument FWHM). To quantify uncertainty caused by velocity variation, we simulated shifting the ZL Fraunhofer line across a conservative range spanning 20 km/s from rest and fitting the resulting spectrum assuming zero. The best fit ZL amplitude was altered by at most 0.3%.
Reynolds et al. (2004) also find a kinematic broadening of the Fraunhofer line corresponding to a velocity dispersion of km/s. The Ca II line has an intrinsic width of 70 km/s and the FWHM of the NBS bandpass is 245 km/s. Since the line is not fully resolved by the NBS and the effects of broadening are small compared to the intrinsic width, the dynamical effects have negligible impact on total ZL brightness measurements.
7.2 Galactic Fraunhofer Line Foregrounds
NIR EBL measurements are subject to Galactic foregrounds consisting of Integrated Stellar Light (ISL) from unmasked stars and Diffuse Galactic Light (DGL), caused by starlight scattered by interstellar dust. Both of these signals will contain Fraunhofer lines at some level. Detected stars are masked and removed from analysis, but the aggregate signal from fainter stars is present and must be modeled.
Bernstein et al. (2002b) have generated ISL spectral templates at nm resolution in the optical which contain the Ca II H (396.85 nm) and K (393.37 nm) lines. Both lines appear shallower in the ISL than in the solar spectrum, but by different amounts. For this reason, a generalized conclusion about the depth of Fraunhofer lines in the ISL relative to Solar would be inaccurate. Unfortunately, these high resolution spectra do not cover the Ca II triplet and are therefore not directly applicable to this study. Instead, for this estimate we apply the lower resolution ISL template of Mattila (1980a, b), which spans the UV to NIR at nm resolution. This resolution is insufficient to individually resolve all of the Ca II triplets in the band. By comparing high-resolution measurements of the Solar spectrum (Delbouille et al., 1990) convolved with a nm Gaussian response function, we estimate that the Ca II triplet appears at near Solar EW in the ISL.
Fraunhofer lines in DGL have also been detected in the optical (Mattila et al., 2011). As DGL arises from stellar light scattered by diffuse dust clouds, we assume the EW of the Fraunhofer line in the DGL is the same as it is in the ISL. The total contribution from DGL can be modeled by scaling the measured DGL to 100 m dust emission (Matsuoka et al., 2011) as well as neutral hydrogen column density (Mattila et al., 2011).
To estimate the expected level of the Galactic Fraunhofer signal, we take the example of a field in the direction of Bootes observed by CIBER (ecliptic longitude of 200.57∘ and latitude of 46.633∘) and assume that both DGL and ISL contribute Ca II absorption features with Solar EW. The level of the ISL is determined from the star counts predicted by the Trilegal model code (Vanhollebeke et al., 2009) below a cutoff magnitude of 14, comparable to the expected completeness in an NBS image. The DGL intensity is estimated using the correlation with neutral hydrogen column density () proposed by Mattila et al. (2011), with cm-2 (Dickey & Lockman, 1990). The ZL intensity is taken from Kelsall et al. (1998), scaled to NBS wavelengths assuming the spectral template generated from the CIBER-LRS (Tsumura et al., 2010). With the aforementioned assumptions, we estimate a contribution at nm of 15 nW m-2 sr-1from ISL, 10 nW m-2 sr-1from DGL and 386 nW m-2 sr-1from ZL, or a 6.5% contribution from the Galactic Fraunhofer line signal to the total sky brightness. This Galactic contribution can be assessed and removed with an improved ISL model spectrum.
7.3 Raman Scattering
If significant Raman scattering effects are present in the ZL, Fraunhofer lines will be filled, causing the relationship between line depth and continuum brightness to be systematically biased. Dube et al. (1979) compare this ratio for a Fraunhofer line in sunlight reflected off the moon to the ZL, and find them to agree within 1.5%, limited by instrumental error. This suggests that if present at all, Raman scattering is a small effect, consistent with the notion that interplanetary dust particles have large dielectric constants with few free electrons.
8 Summary
We describe the design and performance of a specialized wide-field, narrow-band spectrometer for measuring the absolute ZL brightness using the EW of the 854.2 nm Ca II Fraunhofer line, viewed in sunlight scattered by interplanetary dust. The systematics limiting the uncertainty, both instrumental and astrophysical, are discussed and quantified through an extensive suite of laboratory characterization and simulation. The aggregate instrumental uncertainty is dominated by read noise fluctuations and flat field error.
The instrument was flown on a second sounding rocket flight in July 2010 and demonstrated expected performance, with nominal photo currents, temperature stability, calibration lamp response, and dark currents. Preliminary reductions of the flight data show clear significant detections of the Fraunhofer line. A third flight was carried out successfully in March 2012. In-depth analysis of the science data is currently underway and results will be released in the near future.
Acknowledgements
This work was supported by NASA APRA research grants NNX07AI54G, NNG05WC18G, NNX07AG43G, NNX07AJ24G, and NNX10AE12G. Initial support was provided by an award to J.B. from the Jet Propulsion Laboratory’s Director’s Research and Development Fund. Japanese participation in CIBER was supported by KAKENHI (2034, 18204018, 19540250, 21340047 and 21111004) from Japan Society for the Promotion of Science (JSPS) and the Ministry of Education, Culture, Sports, Science and Technology (MEXT). Korean participation in CIBER was supported by the Pioneer Project from Korea Astronomy and Space science Institute (KASI).
Certain commercial equipment, instruments, or materials are identified in this paper to foster understanding. Such identification does not imply recommendation or endorsement by the National Institute of Standards and Technology, nor does it imply that the materials or equipment identified are necessarily the best available for the purpose.
This work utilizes SOLIS data obtained by the NSO Integrated Synoptic Program (NISP), managed by the National Solar Observatory, which is operated by the Association of Universities for Research in Astronomy (AURA), Inc. under a cooperative agreement with the National Science Foundation.
We would like to acknowledge the dedicated efforts of the sounding rocket staff at the NASA Wallops Flight Facility and the White Sands Missile Range. We also acknowledge the work of the Genesia Corporation for technical support of the CIBER optics. A.C. acknowledges support from an NSF CAREER award, B.K. acknowledges support from a UCSD Hellman Faculty Fellowship, K.T. acknowledges support from the JSPS Research Fellowship for Young Scientists, and M.Z. and P.M.K acknowledge support from NASA Postdoctoral Fellowship.
References
- Aharonian et al. (2006) Aharonian, F., et al. 2006, Nature, 440, 1018
- Allen (1976) Allen, C. W. 1976, Astrophysical Quantities, ed. Allen, C. W.
- Beggs et al. (1964) Beggs, D. W., Blackwell, D. E., Dewhirst, D. W., & Wolstencroft, R. D. 1964, MNRAS, 127, 329
- Bernstein et al. (2002a) Bernstein, R. A., Freedman, W. L., & Madore, B. F. 2002a, ApJ, 571, 85
- Bernstein et al. (2002b) —. 2002b, ApJ, 571, 85
- Bernstein et al. (2002c) —. 2002c, ApJ, 571, 107
- Bernstein et al. (2005) —. 2005, ApJ, 632, 713
- Berta et al. (2010) Berta, S., et al. 2010, A&A, 518, L30+
- Bock et al. (2012) Bock, J., et al. 2012, ArXiv e-prints
- Bock et al. (1994) Bock, J. J., Lange, A. E., Matsumoto, T., Eisenhardt, P. B., Hacking, P. B., & Schember, H. R. 1994, Experimental Astronomy, 3, 119
- Bock et al. (1995) Bock, J. J., Lange, A. E., Onaka, T., Matsuhara, H., Matsumoto, T., & Sato, S. 1995, Appl. Opt., 34, 2268
- Brown et al. (2006) Brown, S. W., Eppeldauer, G. P., & Lykke, K. R. 2006, Appl. Opt., 45, 8218
- Burdick & Murdock (1997) Burdick, S. V., & Murdock, T. L. 1997, COBE Final Report: DIRBE Celestial Calibration, Tech. rep.
- Cambrésy et al. (2001) Cambrésy, L., Reach, W. T., Beichman, C. A., & Jarrett, T. H. 2001, ApJ, 555, 563
- Delbouille et al. (1990) Delbouille, L., Roland, G., & Neven, L. 1990, Atlas photometrique DU spectre solaire de [lambda] 3000 a [lambda] 10000, ed. Delbouille, L., Roland, G., & Neven, L.
- Dickey & Lockman (1990) Dickey, J. M., & Lockman, F. J. 1990, ARA&A, 28, 215
- Dube et al. (1977) Dube, R. R., Wickes, W. C., & Wilkinson, D. T. 1977, ApJ, 215, L51
- Dube et al. (1979) —. 1979, ApJ, 232, 333
- Dwek & Arendt (1998) Dwek, E., & Arendt, R. G. 1998, ApJ, 508, L9
- Dwek et al. (2005) Dwek, E., Arendt, R. G., & Krennrich, F. 2005, ApJ, 635, 784
- Eather & Reasoner (1969) Eather, R. H., & Reasoner, D. L. 1969, Appl. Opt., 8, 227
- Fixsen et al. (1998) Fixsen, D. J., Dwek, E., Mather, J. C., Bennett, C. L., & Shafer, R. A. 1998, ApJ, 508, 123
- Hauser et al. (1998) Hauser, M. G., et al. 1998, ApJ, 508, 25
- Hodapp et al. (1996) Hodapp, K., et al. 1996, New Astronomy, 1, 177
- Jacquinot (1954) Jacquinot, P. 1954, Journal of the Optical Society of America (1917-1983), 44, 761
- Juvela et al. (2009) Juvela, M., Mattila, K., Lemke, D., Klaas, U., Leinert, C., & Kiss, C. 2009, A&A, 500, 763
- Keenan et al. (2010) Keenan, R. C., Barger, A. J., Cowie, L. L., & Wang, W.-H. 2010, ApJ, 723, 40
- Kelsall et al. (1998) Kelsall, T., et al. 1998, ApJ, 508, 44
- Kutyrev et al. (2008) Kutyrev, A. S., Arendt, R., Dwek, E., Moseley, S. H., Rapchun, D., & Silverberg, R. F. 2008, in Presented at the Society of Photo-Optical Instrumentation Engineers (SPIE) Conference, Vol. 7014, Society of Photo-Optical Instrumentation Engineers (SPIE) Conference Series
- Lee et al. (2010) Lee, D. H., et al. 2010, Journal of Astronomy and Space Sciences, 27, 401
- Leinert et al. (1998) Leinert, C., et al. 1998, A&AS, 127, 1
- Levenson et al. (2007) Levenson, L. R., Wright, E. L., & Johnson, B. D. 2007, ApJ, 666, 34
- Madau & Silk (2005) Madau, P., & Silk, J. 2005, MNRAS, 359, L37
- Marsden et al. (2009) Marsden, G., et al. 2009, ApJ, 707, 1729
- Martin (1988) Martin, P. G. 1988, ApJS, 66, 125
- Matsumoto et al. (2005) Matsumoto, T., et al. 2005, ApJ, 626, 31
- Matsuoka et al. (2011) Matsuoka, Y., Ienaka, N., Kawara, K., & Oyabu, S. 2011, ApJ, 736, 119
- Matsuura et al. (2011) Matsuura, S., et al. 2011, ApJ, 737, 2
- Mattila (1980a) Mattila, K. 1980a, A&AS, 39, 53
- Mattila (1980b) —. 1980b, A&A, 82, 373
- Mattila (1980c) —. 1980c, A&A, 82, 373
- Mattila (2003) —. 2003, ApJ, 591, 119
- Mattila et al. (2011) Mattila, K., Lehtinen, K., Vaisanen, P., von Appen-Schnur, G., & Leinert, C. 2011, ArXiv e-prints
- Misconi (1976) Misconi, N. Y. 1976, A&A, 51, 357
- Pénin et al. (2011) Pénin, A., et al. 2011, ArXiv e-prints
- Reynolds et al. (2004) Reynolds, R. J., Madsen, G. J., & Moseley, S. H. 2004, ApJ, 612, 1206
- Schroedter et al. (2005) Schroedter, M., et al. 2005, ApJ, 634, 947
- Tsumura et al. (2010) Tsumura, K., et al. 2010, ApJ, 719, 394
- Tsumura et al. (2011) —. 2011, ApJS (Submitted)
- Vanhollebeke et al. (2009) Vanhollebeke, E., Groenewegen, M. A. T., & Girardi, L. 2009, A&A, 498, 95
- Wright (1998) Wright, E. L. 1998, ApJ, 496, 1
- Wright (2001) —. 2001, ApJ, 553, 538
- Yamamuro et al. (2006) Yamamuro, T., Sato, S., Zenno, T., Takeyama, N., Matsuhara, H., Maeda, I., & Matsueda, Y. 2006, Optical Engineering, 45, 083401
- Zemcov et al. (2011) Zemcov, M., et al. 2011, ArXiv e-prints 1112.1424
- Zemcov et al. (2010) Zemcov, M., Blain, A., Halpern, M., & Levenson, L. 2010, ApJ, 721, 424