Hi Shells and Supershells in the I-GALFA Hi 21-cm Line Survey: I. Fast-Expanding Hi Shells Associated with Supernova Remnants
Abstract
We search for fast-expanding Hi shells associated with Galactic supernova remnants (SNRs) in the longitude range 32° to 77° using 21-cm line data from the Inner-Galaxy Arecibo L-band Feed Array (I-GALFA) Hi survey. Among the 39 known Galactic SNRs in this region, we find such Hi shells in four SNRs: W44, G, W51C, and CTB 80. All four were previously identified in low-resolution surveys, and three of those (excluding G) were previously studied with the Arecibo telescope. A remarkable new result, however, is the detection of Hi emission at both very high positive and negative velocities in W44 from the receding and approaching parts of the Hi expanding shell, respectively. This is the first detection of both sides of an expanding shell associated with an SNR in Hi 21-cm emission. The high-resolution I-GALFA survey data also reveal a prominent expanding Hi shell with high circular symmetry associated with G. We explore the physical characteristics of four SNRs and discuss what differentiates them from other SNRs in the survey area. We conclude that these four SNRs are likely the remnants of core-collapse supernovae interacting with a relatively dense ( cm-3) ambient medium, and we discuss the visibility of SNRs in the Hi 21-cm line.
1 Introduction
The interstellar medium (ISM) is pervaded by small and large expanding neutral atomic shells (e.g., Heiles, 1979, 1984; McClure-Griffiths et al., 2002; Ehlerová & Palouš, 2005; McClure-Griffiths, 2012). These Hi shells are the interstellar material swept up by supersonic shock waves produced by mechanical energy sources, including Hii regions, stellar winds, supernova (SN) explosions, and infalling high-velocity clouds. The dominant and most violent sources are supernovae (SNe), which dump huge amounts of kinetic energy into the Galactic ISM every 20–70 yrs. But it is not clear how this kinetic energy is conveyed to the diffuse ISM, because this depends on the types and the physical environments of SNe. Most supernovae are core-collapse SNe (CCSNe) that have massive ( M⊙) progenitors, and most CCSNe are produced in clusters (e.g., Higdon & Lingenfelter, 2005). Most SN explosions, therefore, are correlated in both space and time, with such groupings frequently producing supershells and superbubbles with radii of more than a few hundred parsecs. Only Type Ia SNe and a small fraction of CCSNe are likely to occur in isolation. Single CCSNe probably explode inside a wind bubble created by their progenitor stars during the main-sequence phase. For stars of spectral type later than B0, this bubble size is small ( pc), and the SNRs can interact with dense molecular clouds in their early evolution (Chevalier, 1999). Type Ia’s, on the other hand, probably explode in either warm diffuse environments of density cm−3 or in hot, rarefied gas with cm−3. The amount and characteristics of the kinetic energy imparted to the ISM by SNe, therefore, should be diverse, and their role in shaping the kinematics of the atomic phase of the ISM is not clear. Consequently, Hi observations of shells and supershells are useful not only to understand the nature and origin of individual structures but also, with reasonably large statistical samples, to explore the overall effects of SNe on the ISM.
There have been a number of systematic searches for Hi shells associated with individual Galactic SNRs. Koo & Heiles (1991, hereafter KH91) carried out a survey of Galactic SNRs in Hi 21-cm line using the Hat-Creek 25 m telescope (FWHM). They observed 103 northern Galactic SNRs and detected high-velocity (HV) gas toward 15 SNRs including three SNRs known prior to the survey. Koo et al. (2004) searched for similar Hi features toward 97 southern SNRs using the Parkes data from the Southern Galactic Plane Survey (FWHM; McClure-Griffiths, 2001) and identified another 10 SNRs. Since the SNRs are usually less than 1° in diameter, high-resolution observations are essential to confirm the association of HV Hi features with the radio continuum SNR. Such confirmations have been made in several cases, e.g., CTB 80 (Koo et al., 1990), W44 (Koo & Heiles, 1995), W51C (Koo & Moon, 1997a), and IC 443 (Giovanelli & Haynes, 1979; Braun & Strom, 1986; Lee et al., 2008). There have also been studies of almost stationary Hi shells or Hi bubbles associated with SNRs, but it is generally difficult to derive the parameters of such low-velocity Hi shells due to Hi background confusion (e.g., Kothes et al. 2005; Cazzolato & Pineault 2005; see also references in Koo et al. 2004).
Recently, the 7-beam Arecibo L-band Feed Array (ALFA) receiver on the Arecibo 305m telescope has enabled Galactic Hi surveys of unprecedented breadth and sensitivity with a fully-sampled 4′ beam (Peek et al., 2010, 2011). The Inner Galaxy ALFA (I-GALFA) survey (Koo et al., 2010; Gibson et al., 2012) covers the portion of the first Galactic quadrant visible to Arecibo, an area of more than 1650 square degrees at longitudes of 32° to 77° in the Galactic plane and extending to 10° or more off the plane. I-GALFA uses 0.184 km s-1 velocity channels over an LSR velocity range of to km s-1. Its brightness temperature RMS noise is 0.2 K in single empty channels. This combination of high sensitivity, high spatial and spectral resolution, and large area and velocity coverage are well suited for a systematic study of Hi shells and supershells in the diffuse interstellar medium. In this first paper, we search for fast-expanding Hi shells associated with known SNRs and consider the implications of our results on their nature. A forthcoming paper will discuss known Hi shells and supershells as well as newly identified shells in the I-GALFA survey data. It is worth noting that the VLA Galactic Plane Survey (VGPS; Stil et al., 2006) and Canadian Galactic Plane Survey (CGPS; Taylor et al., 2003) cover most of the SNRs in the first quadrant in HI at higher spatial resolution ( 1′–2′). Their velocity coverage and sensitivity ( 100–150 km s-1 and 1–3 K per 0.8 km s-1 channel) are not ideal to study faint, fast-expanding HI shells, but they can be useful to study shell fine structure at relatively low velocities.
In Section 2, we explain how we identify fast-expanding Hi shells associated with SNRs and present the resulting list. In Section 3, we summarize the results on four SNRs that have associated fast-expanding Hi shells. The two SNRs with new results, W44 and G, are discussed in some detail. In Section 4, we explore the physical characteristics of the four SNRs and compare their properties to the other 35 SNRs in the survey area. Section 5 summarizes the paper.
2 Identification of SNR Hi shells
There are 275 Galactic SNRs in Green’s catalog (Green, 2009a, b). Among them, 39 SNRs are included in the I-GALFA area (Table 1). The SNR name, size, and type parameters in Table 1 are from Green (2009a). (See the table note for more parameter details.) Note that the 21-cm spectra of sources with high continuum brightness are noisy, so faint high-velocity emission could not be seen in those objects. In Table 1, the ranks determined by KH91 are also listed. KH91 observed each SNR with the Hat Creek 85-foot telescope (FWHM=36′) at 9 points in a cross pattern centered on its catalog position and searched for SNRs with broad ( km s-1) excess emission over the background. They divided SNRs into four ranks: 0, 1, 2, and 3, where rank 3 has the highest probability for an associated fast-expanding Hi shell. In rank 1, the central excess emission is brighter than the four outermost positions; in rank 2, the central excess emission is brighter than all outer positions; in rank 3, there is also excess emission at the highest positive or negative velocities; and in rank 0, none of these criteria are met. Among 39 sources in Table 1, 26 were studied by KH91, who classified 9 of these as rank 3 SNRs. KH91 mapped the excess HV emission in these 9 SNRs and concluded that the Hi emission is not physically associated in 4 cases (marked as ‘(3)’ in Table 1). Four SNRs are in rank 2. The other 13 (ranks 1 and 0) did not show any significant excess Hi emission.
In order to identify fast-expanding shells associated with SNRs, we examined whether enhanced emission is present at the SNR position at high positive/negative velocities in several ways. We first inspected average, background-subtracted Hi spectra toward individual SNRs as KH91 did. The average spectrum was obtained from a circular area with 1.1 times the SNR radius, while the background spectrum was obtained from an annular ring of 3′ thickness surrounding the SNR. The radial interval between the SNR circle and the background ring was either 9′ or 0.5 times the SNR radius, whichever was smaller. If another bright radio continuum source was located near the SNR, we left an appropriate space between the SNR circle and the background ring. We confirmed that all SNRs classified as rank 3 by KH91 show excess emission at high positive/negative velocities in their background-subtracted spectra, but we could not find additional SNRs with such features.
The above approach could have missed associated Hi emission limited to small areas. We therefore inspected individual channel maps as well as and maps to search for HV Hi emission features spatially correlated with the SNRs in radio continuum maps. These are mostly from the VGPS or CGPS 21-cm continuum data with 1′ resolution. For SNRs outside these two survey areas, we used either the lower-resolution () Effelsberg 11-cm continuum data (Reich et al., 1990) or referred to previous works. Surprisingly, this detailed inspection yielded no additional detections. Instead, we confirmed the conclusion of KH91 that the HV emission in four rank 3 SNRs extended beyond the spatial extent of SNRs, so that it was probably not associated with the SNRs (marked as ‘(3)’ in Table 1). In one of them (G), we found that the HV Hi emission is part of a much larger and prominent expanding shell. This result will be discussed in a forthcoming paper.
We are therefore left with the five rank 3 SNRs of KH91, but we suspect the HV Hi emission in W50 (G) is probably not associated with the SNR. W50 is a large, elongated shell-like SNR with SS 433 at the center, and KH91 reported the presence of very weak, extended Hi emission at high positive velocities along the northern edge of the SNR where the continuum emission is enhanced (cf. Lockman et al., 2007). The high-resolution I-GALFA data confirm the presence of weak, filamentary Hi emission along the SNR edge that appears connected to other Hi structures well outside the SNR. We therefore regard the spatial correlation between the Hi emission and the SNR as a coincidence. Our results are summarized in the last column of Table 1, where we comment only on the HV emission features. We do see some low-velocity Hi features that may be associated with SNRs, but many of these are confusing, and the scope of the present paper is limited to fast-expanding Hi shells in SNRs.
3 Supernova Remnants with Fast-Expanding Hi Shells
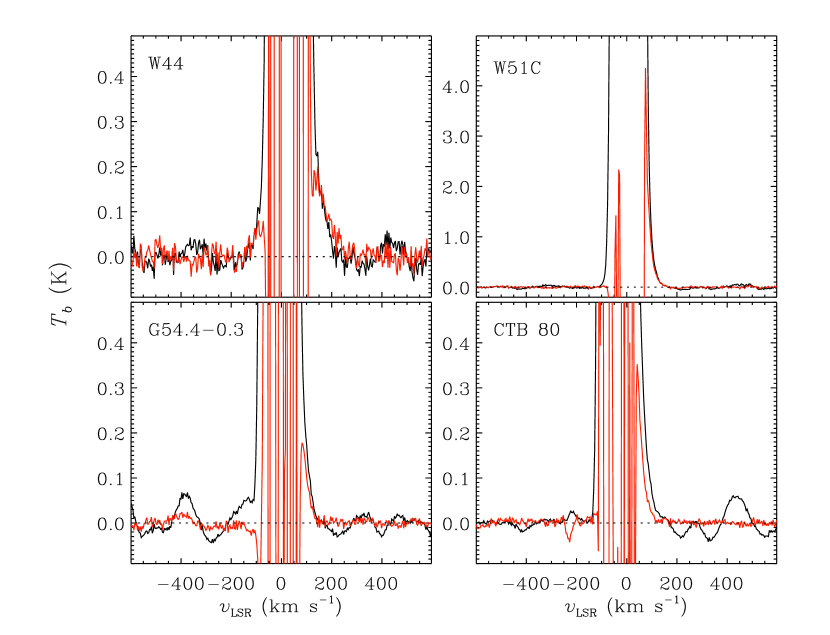
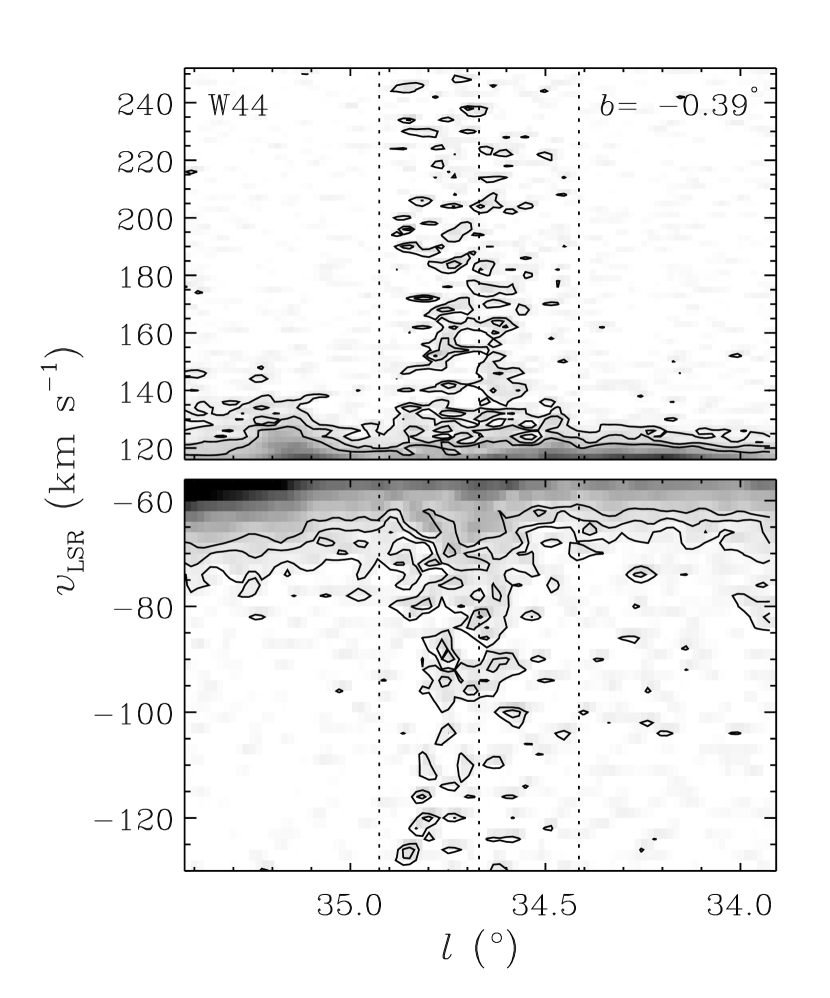
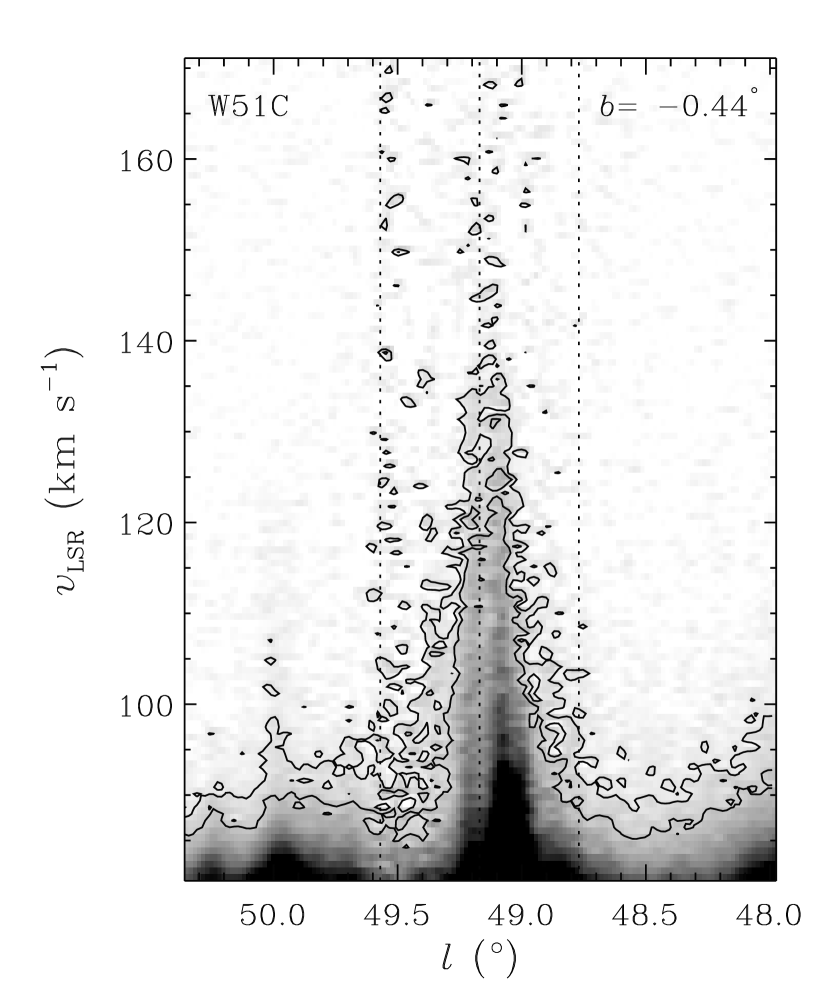
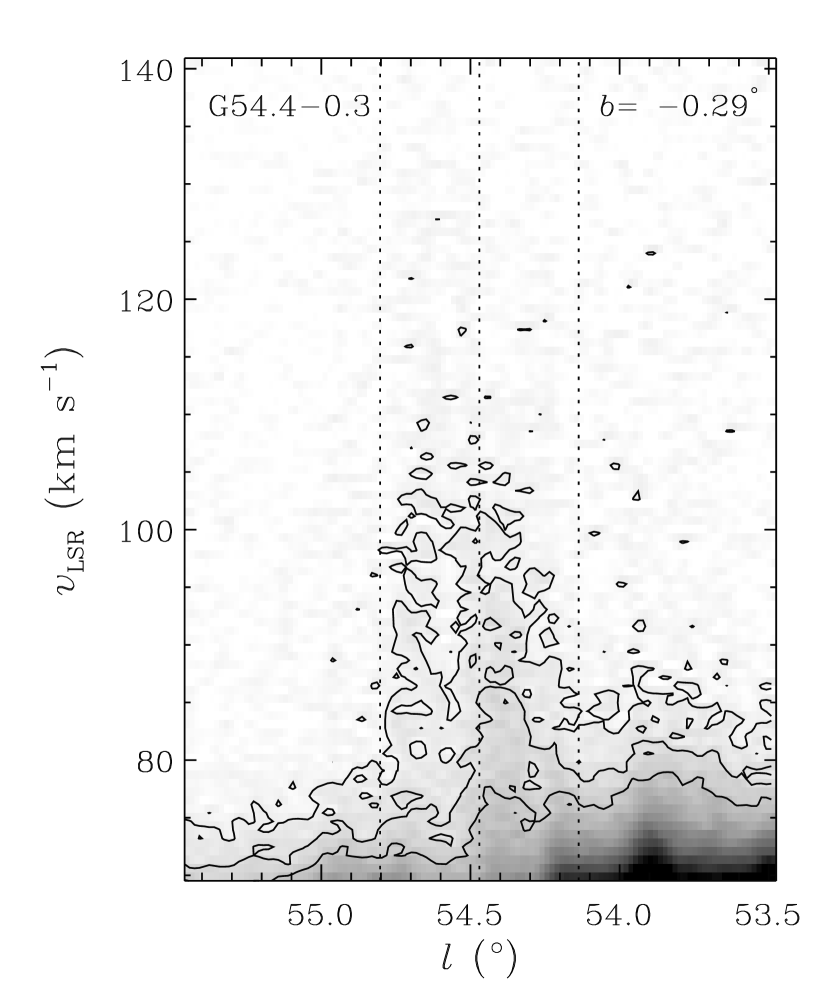
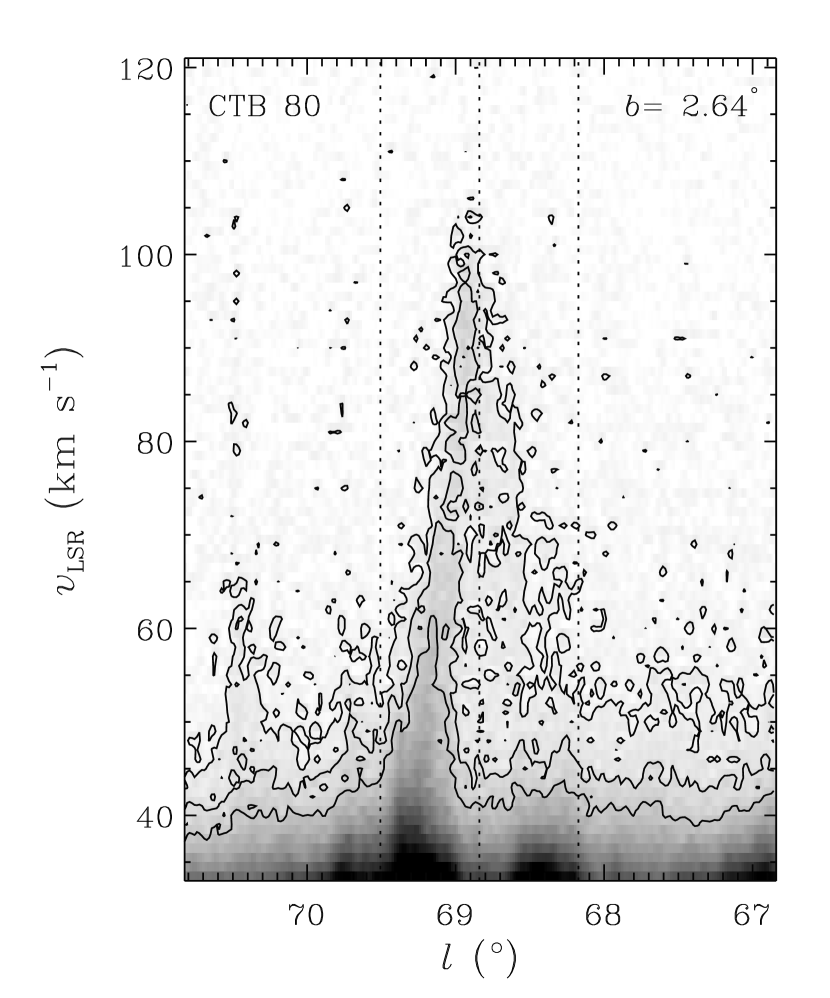
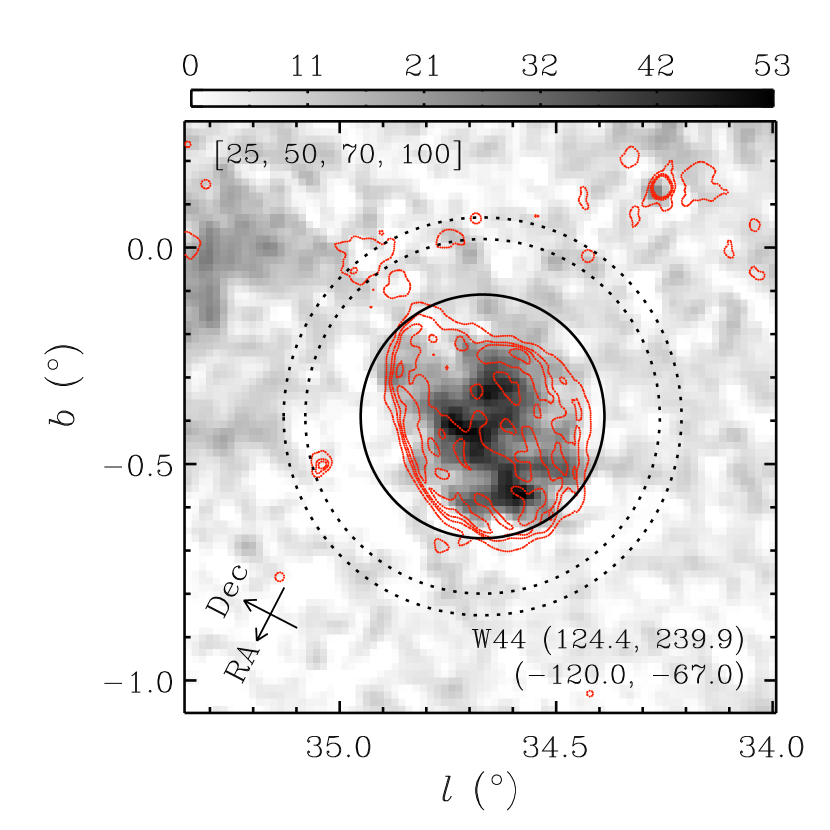
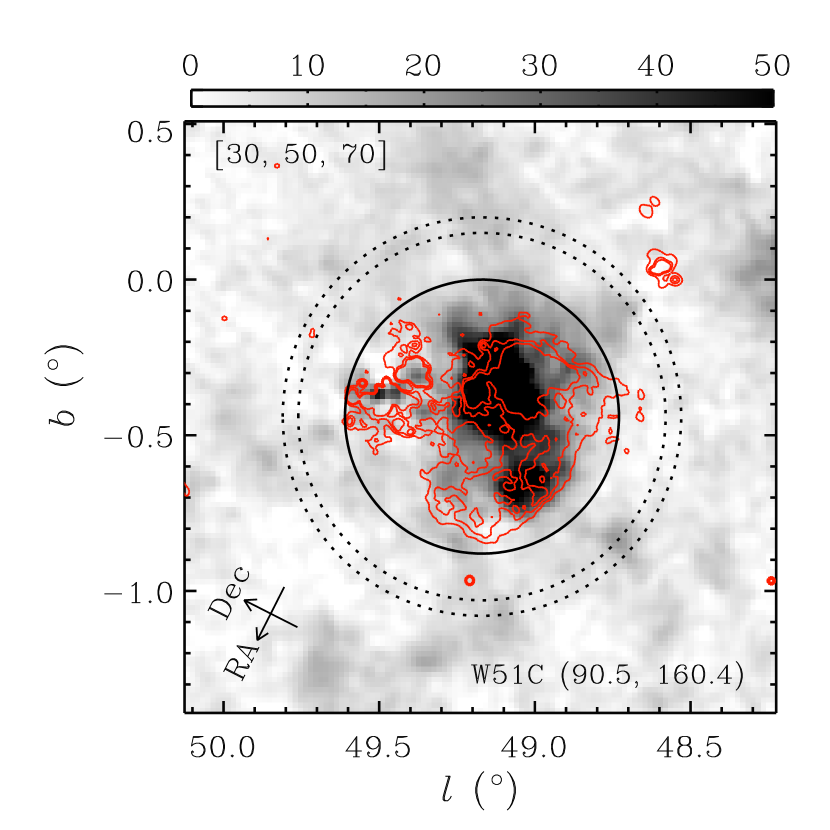
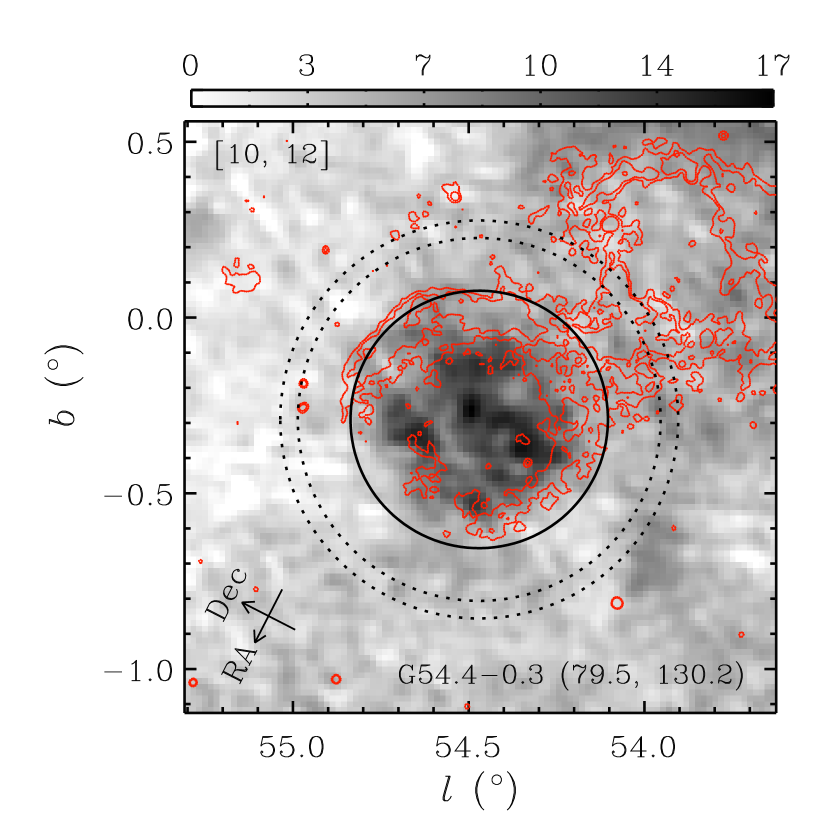
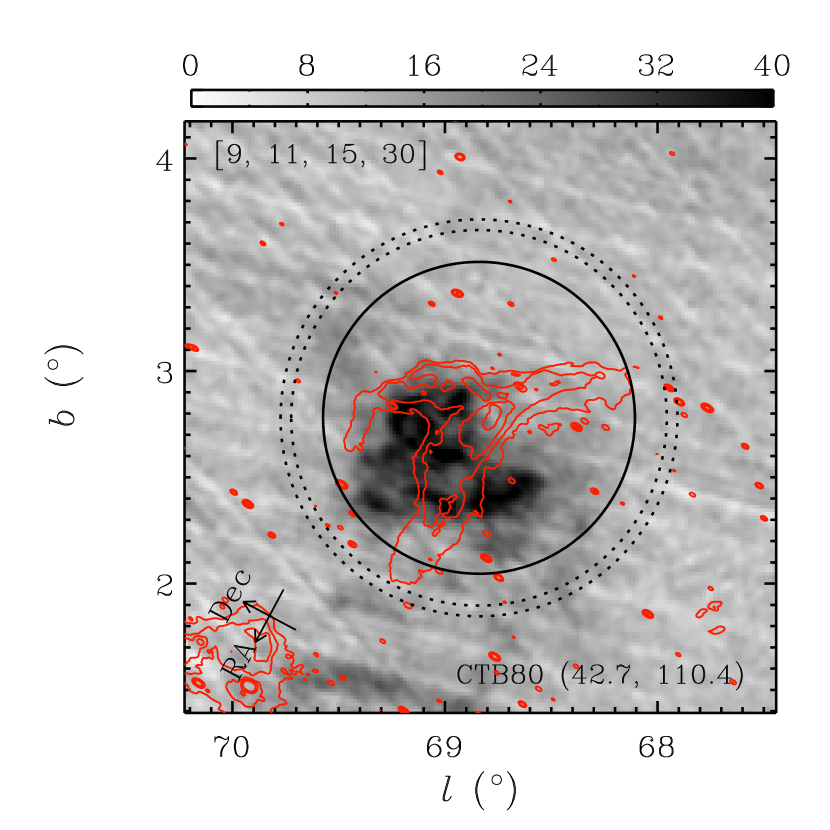
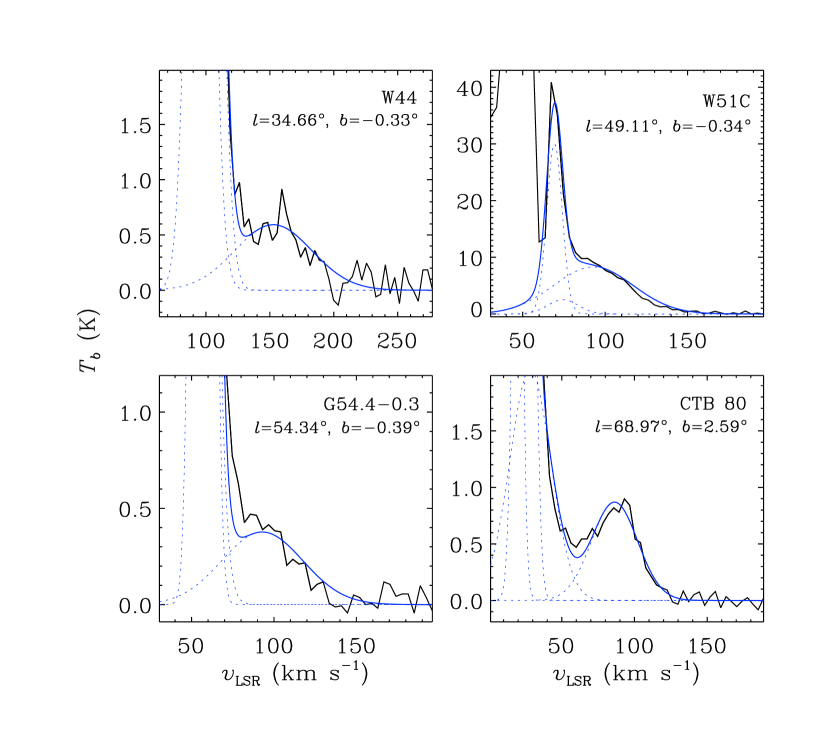
We have identified four SNRs that have associated HV Hi gas: G (W44), G (W51C), G (HC40), and G (CTB 80). All four were ranked 3 by KH91, and follow-up high resolution observations have been made for SNRs W44, W51C, and CTB 80 (Koo & Heiles, 1995; Koo & Moon, 1997a; Koo et al., 1993). Figure 1 shows their average Hi line profiles while Figure 2 shows () maps across the centers of these four SNRs. (See Figure 3 for the areas used to derive these profiles.) The average profiles show some fluctuations in baseline, but they are removed in background-subtracted profiles. Figures 1 and 2 show that these four SNRs have excess Hi emission at highest positive velocities. In W44, a faint, but clear, excess emission at highest negative velocities is also visible. Integrated (, b) maps in Figure 3 show the spatial distribution of HV Hi emissions. The overlaid radio contours of SNRs clearly show that the HV Hi gas is confined inside the SNR boundaries of W44 and G. We discuss W44 and G in some detail below, where new results are obtained. We also briefly comment on the other two SNRs, W51C and CTB 80, where the I-GALFA results agree with previous findings.
3.1 W44 (G)
3.1.1 Previous studies
W44 is a middle-aged SNR ( yr) of mixed morphology, being shell-type in radio continuum but centre-filled in X-rays (Rho & Petre, 1998). The radio continuum shell is somewhat elongated (), and the southeastern111Directions in this paper are all in reference to Galactic coordinates, not J2000 Equatorial coordinates. portion of the SNR shows enhanced radio emission (Figure 3; see also Castelletti et al., 2007). The pulsar PSR 1853+01 with a spin-down age of yr lies 9′ southwest of the center of W44, embedded in an X-ray emitting pulsar wind nebula (Petre et al., 2002; Wolszczan et al., 1991). Hi gas at very high positive velocities ( km s-1) accelerated by the SNR shock has been detected inside the remnant and studied using the Arecibo telescope (Koo & Heiles, 1995). Ample evidence indicates the SNR is interacting with a molecular cloud in the southeast at km s-1 (Seta et al., 1998; Reach et al., 2005, and references therein). An extensive, organized system of thin and knotty H2 filaments filling the SNR may indicate that the SN exploded inside a molecular cloud (Reach et al., 2005; Froebrich et al., 2011). Gamma-ray emission from the SNR has been detected by Fermi/LAT and AGILE/GRID at 50 MeV—10 GeV (Abdo et al., 2010; Giuliani et al., 2011). The emission is confined to an incomplete ring structure that matches well with the SNR but with a slight offset. The gamma-ray spectrum is well modeled with emission from cosmic-ray protons interacting with the nuclei in the ambient medium. Distance estimates to the SNR range from 2.6 to 3.2 kpc.
3.1.2 New Results
The I-GALFA images reveal several new Hi features not seen in previous studies. First, we detect fast-moving Hi gas associated with the SNR at both the highest positive and highest negative velocities. The negative-velocity emission is relatively faint, but clearly real (see below). The Hi gas at positive and negative velocities must be from the receding and approaching hemispheres of the SNR, respectively. This is the first detection of both sides of an expanding SNR shell in the Hi 21-cm emission line. We will discuss the visibility of fast-expanding Hi shells in § 4.2.
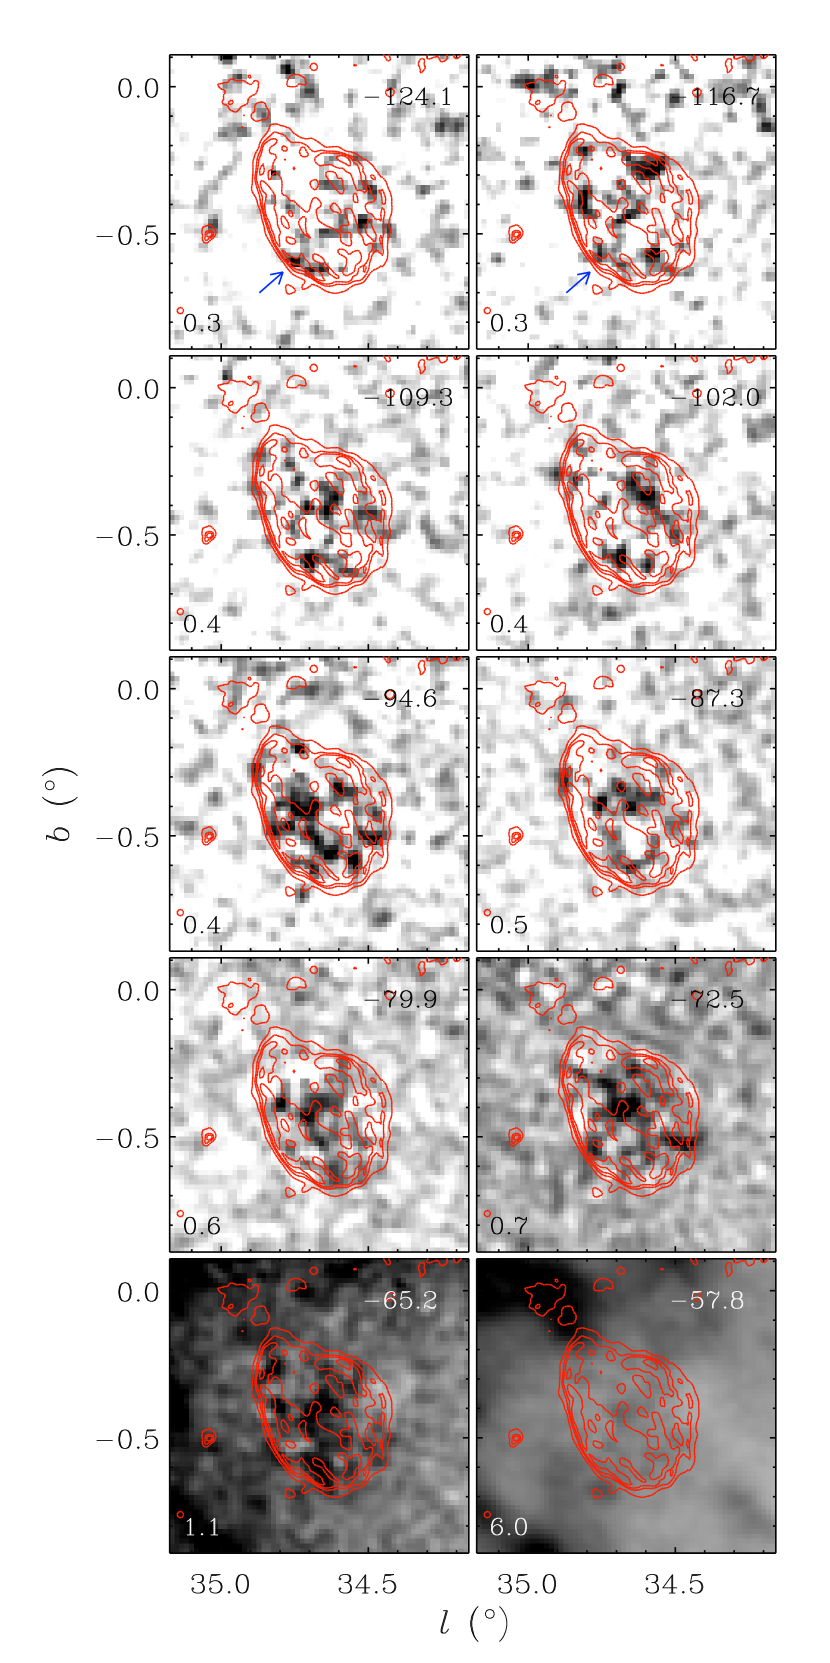
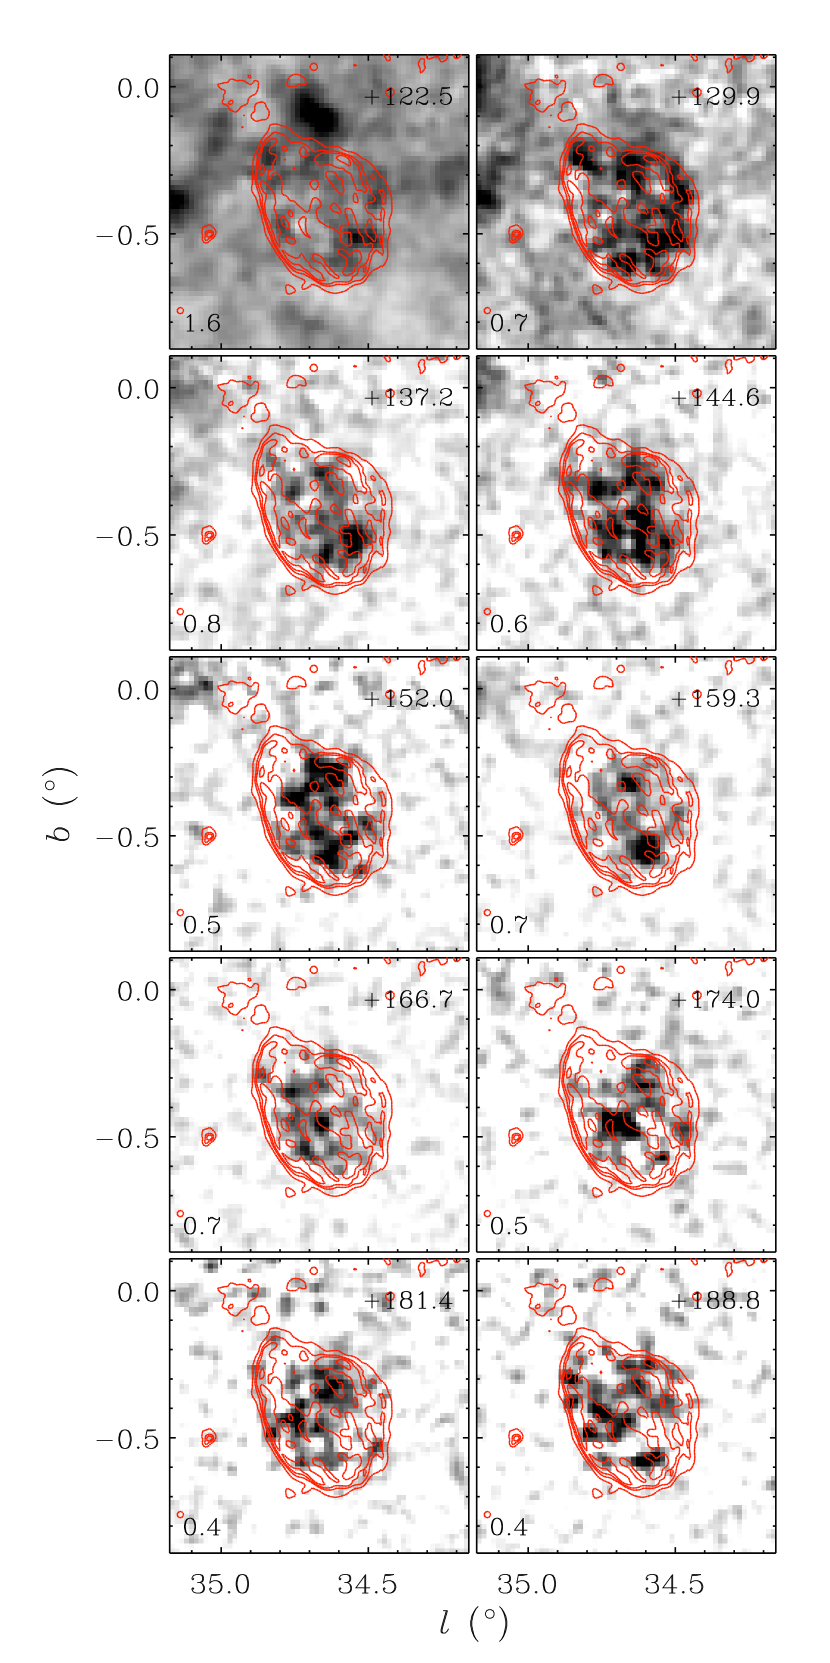
Figure 4 shows channel maps at both negative and positive velocities where we see Hi emission confined inside the SNR boundary. At the highest negative velocities ( to km s-1), a knotty, elongated emission feature is seen along the southeastern boundary of the SNR (blue arrow in first two panels). It is worth noting that this is where the SNR is currently interacting with the molecular cloud (see references in the previous paragraph). At velocities less negative than this, the emission in the central area has a ring-like shape. At positive velocities, the Hi emission is more prominent. At the highest positive velocities, the Hi gas is confined to the central area of the remnant with the ring-like morphology noted by Koo & Heiles (1995). And at km s-1, the Hi gas forms a ring structure along the inner boundary of the SNR. This indicates that the Hi gas is part of an expanding shell, and that the size of the Hi shell is comparable to the radio continuum shell. This is in contrast to Koo & Heiles (1995), who concluded that the Hi shell was smaller than the continuum shell from the extrapolation of the Hi gas distribution at the highest velocities. Figure 4 indeed shows that the Hi ring structure rather abruptly shifts from the central region to the SNR boundary as the velocity changes from to km s-1. We speculate that the total extent of the expanding Hi shell is probably comparable to the radio continuum shell, but the shell is not complete.
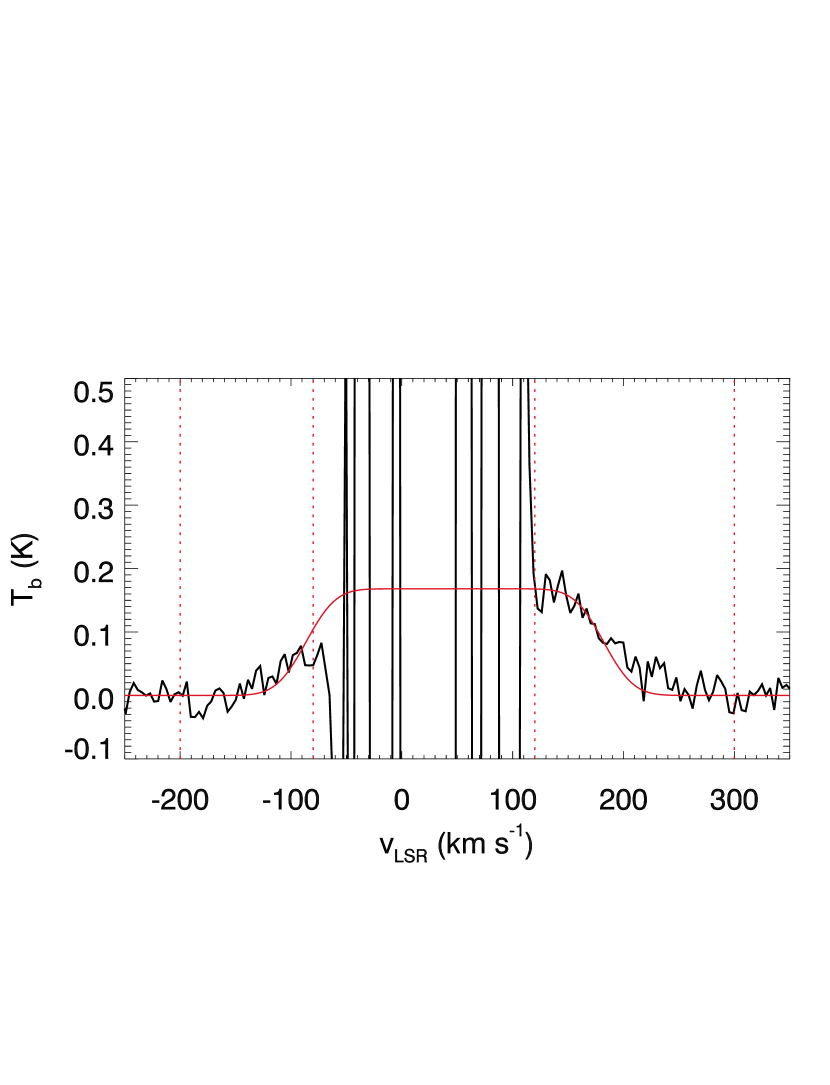
Figure 5 shows the average Hi profile of W44. If the Hi shell is symmetric, we can in principle derive an accurate systemic velocity by measuring the velocity at which the line profile becomes symmetric. For example, if we naively fit a Gaussian to the line profile, we obtain a central velocity of km s-1, which is considerably higher than the systemic velocity ( km s-1) of the associated molecular cloud. We attribute the discrepancy to the asymmetric mass distribution of the Hi shell. The implied asymmetry also makes it difficult to derive an accurate mass. But the uncertainty in the mass estimation is mainly due to the unobservable mass at low velocities, and, by fixing the central velocity, we can derive a reasonably accurate mass. The average line profile becomes flattened at velocities below +160 km s-1, i.e., it does not rise steeply as one might expect when the high-velocity part ( km s-1) is the tail of a Gaussian profile, which is consistent with Koo & Heiles (1995). If the Hi shell is uniform and expanding at a constant speed , then the average Hi 21-cm line profile would appear as a square profile that extends from to centered at the systemic velocity (e.g., see Koo & Heiles, 1991), i.e.,
| (1) |
where is the maximum brightness temperature, which is proportional to the total mass in the shell (see below). But the shell probably does not coast at a constant speed, given non-uniformity/inhomogeneity of the ambient medium, turbulent motions produced by hydrodynamic instabilities, etc. We assume that the observed profile is composed of a flat profile convolved by a Gaussian profile, i.e.,
| (2) |
where is the dispersion of random velocities related to the velocity at Full-Width at Half Maximum (FWHM) by .
The fast-moving gas is clumpy and has broad lines. In the SNR W51C, for example, Koo & Moon (1997a) resolved individual clumps using the VLA and found that their line profiles have FWHM of km s-1. In the I-GALFA survey, we could not completely resolve out clumps from the background emission in velocity space. But we see many clumps that appear as prominent protrusions. Figure 6 shows some examples of HV bumps in the tails of strong background emission. We fit the HV parts of these spectra with several Gaussian components. Our purpose is only to obtain the widths of the HV bumps, so the fit parameters of the low-velocity components are unimportant. We obtain suitable results using four components for CTB 80 and three for the others (Figure 6), and we find km s-1 for the HV components in all four SNRs. We adopt km s-1 as the characteristic value for the fit. The large velocity dispersion within the shell implies that the shell is dispersing, but its thickness will remain small compared to the radius of the shell until the very late stage of SNR evolution.
With the systemic velocity fixed at km s-1, we vary and . The fit was done using the IDL routine MPFIT (Markwardt, 2009). The best fit profile is shown in Figure 5. Its parameters are km s-1 and K. The Hi mass is derived from the average column density obtained from the fit, i.e., cm-2 considering both approaching and receding sides of the shell, by multiplying the area of W44. (Since the peak brightness temperature is only K, we may assume that the Hi emission is optically thin.) The derived Hi mass is M⊙, which implies a kinetic energy of erg. These numbers agree with those of Koo & Heiles (1995) within 10–20%. The resulting dynamical age of the shell is yr (Cioffi et al., 1988), where we used a geometrical mean radius (12.5 pc at 2.8 kpc; See Tables 2 and 3 for the adopted distances to the SNRs) as the radius of the SNR, . This dynamical age is somewhat larger than the characteristic spin-down age of the pulsar. Assuming that this mass was initially inside the volume of the SNR, i.e., inside a sphere of geometrical radius of pc, the mean density of hydrogen nuclei in the ambient medium would be cm-3. The initial explosion energy, , can be estimated from
| (3) |
where is the ambient density of hydrogen nuclei in cm-3, is in pc, and is in km s-1 (Cioffi et al., 1988). We assume solar metallicity. Substituting the derived values, i.e., cm-3, pc, and km s-1, we have erg. This is the energy required to heat and accelerate more or less uniformly distributed atomic gas. Since there is also fast-expanding ( km s-1), dense molecular gas accelerated by SN blast wave (Reach et al., 2005; Froebrich et al., 2011), some fraction of the total SN energy should have been used up for heating and accelerating the molecular gas. It would be interesting to derive the kinetic energy of shocked H2 filaments and compare it to that of the Hi shell.
3.2 G (HC 40)
3.2.1 Previous studies
G is a shell-type SNR of circular shape with a diameter of 40′. The shell is not complete, and its radio continuum brightness is not uniform (see the contour map in Figure 3; Junkes et al., 1992a). In the southeastern part of the remnant, the circular portion of the shell is missing, and instead faint continuum structures are visible connected to the tips of the bright ends. This probably indicates that the SNR blew out in this direction, presumably on encountering a rarefied medium there, and the shell was disrupted in the process. Junkes et al. (1992a) carried out CO observations and suggested an association with a molecular cloud at to km s-1. They proposed a distance of 3 kpc using the rotation curve of Burton (1988). Case & Bhattacharya (1998) adjusted this distance by adopting a revised rotation curve with kpc and km s-1 and obtained 3.3 kpc. If we use the rotation curves of Brand & Blitz (1993) or Levine et al. (2008), the near-side kinematic distance corresponding to the systemic velocity of +40 km s-1 in this direction is 3.9 and 3.1 kpc, respectively. We adopt the 3.3 kpc distance of Case & Bhattacharya (1998) in this paper. There are several Hii regions in this area at about the same distance, including the compact Hii region just outside the northwestern boundary of the remnant (Junkes et al., 1992b). Junkes (1996) observed the remnant with ROSAT and derived an absorbing hydrogen column density of 1 cm-2 and a plasma temperature of 2 K. Boumis et al. (2005) detected optical emission lines in the northwestern edge of the shell and derived an absorbing hydrogen-nuclei column density of 2.9–4.0 cm-2. KH91 detected fast-moving Hi gas at velocities — km s-1.
3.2.2 New Results
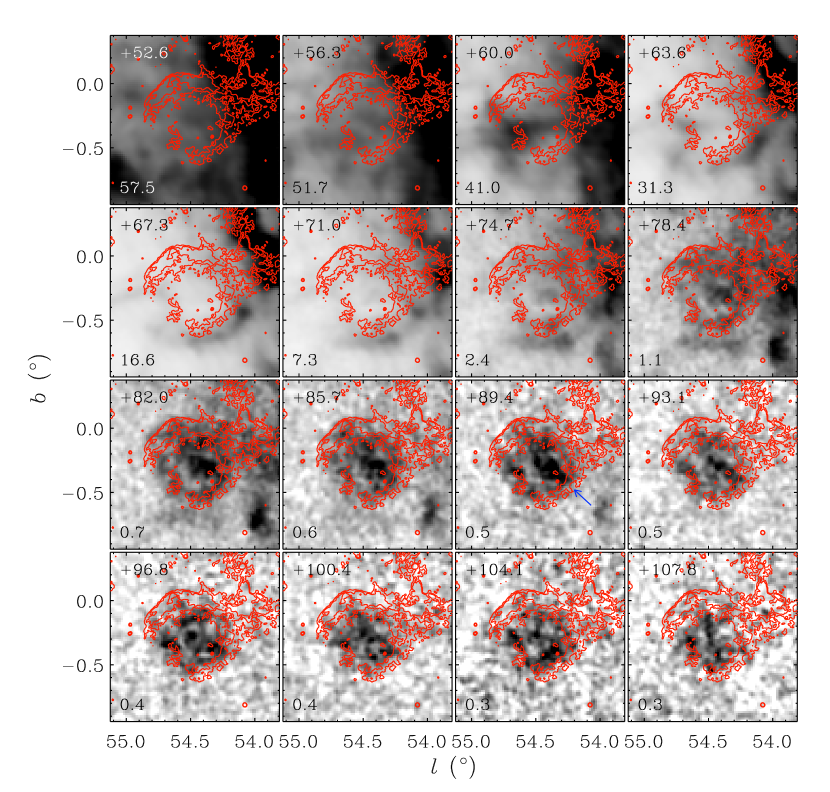
This SNR has some of the most prominent Hi shell structure in our sample. Figure 7 shows Hi channel images of G at to km s-1. At the highest positive velocities, e.g., km s-1, the Hi gas is confined to the central area of the remnant, whereas at lower velocities, we see a well-defined ring structure as well as some emission filling the central area. This velocity structure indicates that the HV gas is the receding portion of an expanding shell. The shell has non-uniform brightness. A prominent feature is the bar-like structure extending from the center to the southwestern at to km s-1 (blue arrow in a panel at km s-1). Its northeastern tip appears as a bright spot at at — km s-1. At low velocities, e.g., at — km s-1, we see some correspondence between Hi and radio continuum structures. First, the same southeastern portion of the Hi shell is also weak and missing as in the continuum shell. Second, there is faint but enhanced Hi emission coincident with the continuum shell at km s-1. Third, along the southwestern SNR shell, there is a larger filamentary Hi structure just outside it at to km s-1. This external Hi feature has the same curvature as the SNR shell, so it might be associated with the SNR too. Perhaps this is the boundary of the stellar wind bubble produced by the progenitor star, although it is not obvious how we can see the SNR shell inside a wind bubble.
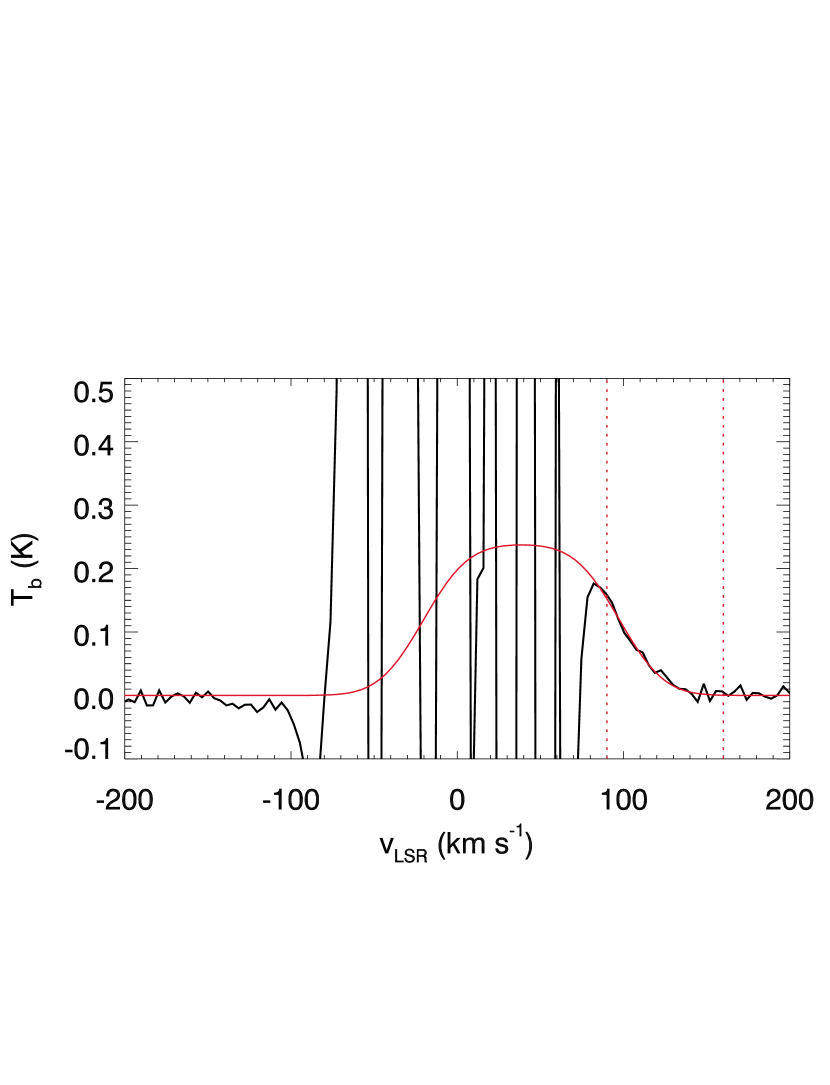
We derive the mass of the G Hi shell in a similar fashion to W44, but using only positive velocities. We adopt km s-1 and assume a systemic velocity of km s-1. The best-fit profile, shown in Figure 8, uses km s-1 and an Hi mass of M⊙ at kpc. The corresponding kinetic energy is erg. The resulting dynamical age of the shell is yr, where we used pc (20′). Again assuming that this mass was initially inside the volume of the SNR, the mean density of hydrogen nuclei in the ambient medium would be cm-3. With the above parameters, we obtain erg. This is considerably smaller than the canonical value of 1 erg but not unreasonable.
3.2.3 Others
G (W51C) is a middle-aged, shell-type SNR interacting with a molecular cloud. Koo & Moon (1997a, b) obtained high-resolution Hi and CO observations and developed a model in which the fast-moving Hi gas is produced by the SNR shock propagating into a molecular cloud. The SNR is one of the most luminous -ray sources in the Galaxy (Abdo et al., 2009). The I-GALFA results for the HV Hi gas in Figures 1–3 agree with previous results.
G (CTB 80) is one of the first infrared SNRs detected by IRAS (Fesen et al., 1988). It appears as a large (°), spherical shell-type SNR in IR while, in radio continuum, only the northern portion of the shell is bright due to the interaction with the pulsar. Koo et al. (1990, 1993) carried out Hi studies using the Arecibo telescope and the VLA and confirmed the large size of the SNR shell and its old age ( yr). Again, the I-GALFA HV Hi results in Figures 1–3 agree with previous results.
4 Discussion
4.1 Properties of Hi SNRs
We have detected 4 SNRs with fast expanding Hi shells in the I-GALFA survey area. Table 2 summarizes their parameters: distance , radius , systemic velocity , expansion speed , dynamical age, Hi mass, kinetic energy, ambient density , and initial explosion energy . The table also lists whether the remnant has an associated pulsar and whether it is interacting with a molecular cloud. The parameters of W44 and G are those derived in this work, whereas those of W51C and CTB 80 are from previous studies.
There are several points to make. First, all 4 SNRs are middle-aged (1.8–9.5 yr). Second, the ambient densities are cm-3, considerably larger than the densities of either the warm or hot diffuse ISM filling most of the interstellar volume. In particular, three SNRs are interacting with molecular clouds. Third, two SNRs are the remnants of core-collapse SNe with associated pulsar wind nebulae (PWNe). The other two remnants, G and W51C, do not have associated PWNe, but their interactions with molecular clouds suggests they also likely have massive progenitors. In summary, the SNRs with Hi shells (hereafter Hi SNRs) that are detected are middle-aged SNRs of probable CCSN origin interacting with a relatively dense medium.
The dynamical evolution of middle-aged SNRs in a uniform medium was studied in detail by Cioffi et al. (1988), who derived analytic expressions for radius and expansion velocity that describe the results of their one-dimensional numerical simulations. Koo & Kang (2004) proposed somewhat simpler but still accurate forms of the equations of Cioffi et al. (1988).222 There was a typo in equation (8) of Koo & Kang (2004): the index “-1/14” should be read as “1/14”. We find it useful to introduce a parameter where is the density of hydrogen nuclei in the ambient medium divided by 1 cm-3, and is the SN energy released to the ISM in units of erg. Note that is dimensionless. The advantage of introducing is that the radius and velocity of middle-aged SNRs are now related by
| (4) |
where . This equation is obtained by combining equations (5)–(8) of Koo & Kang (2004). (Note that this is just another expression of equation (3) except that their numerical coefficients differ by 2%.) In the plane, Hi SNRs evolve along a line satisfying the above equation. In terms of , the expansion velocity of Hi SNRs is given by (Eq. 6 of Koo & Kang, 2004)
| (5) |
where the “shell formation time” representing the onset of the formation of Hi shell is defined by (Cioffi et al., 1988)
| (6) |
As pointed out by Koo & Kang (2004), the maximum disagreement between the equations (4)–(5) and the original equations (3.22)–(3.23) of Cioffi et al. is less than 0.1% during . The radius and velocity are now functions of , , and instead of and . And since the dependence of on is weak, a single grid can be drawn in the ( plane to describe the evolution of Hi SNRs in different physical environments.
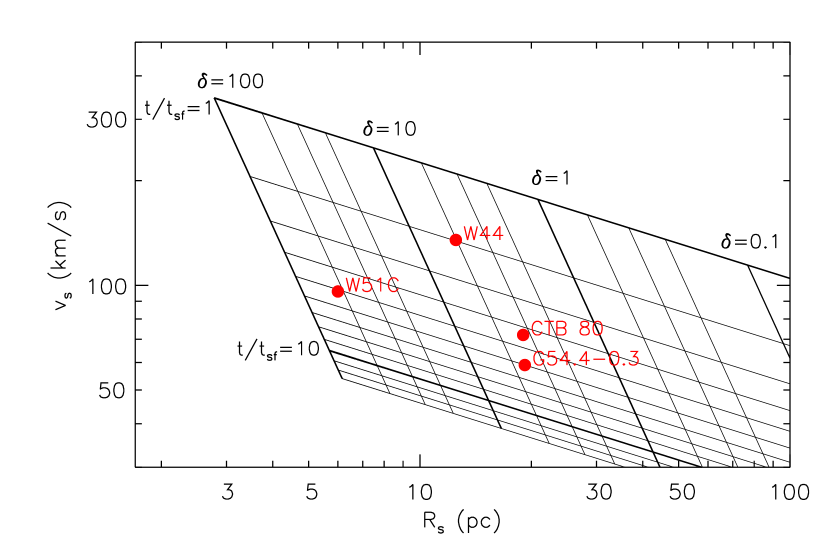
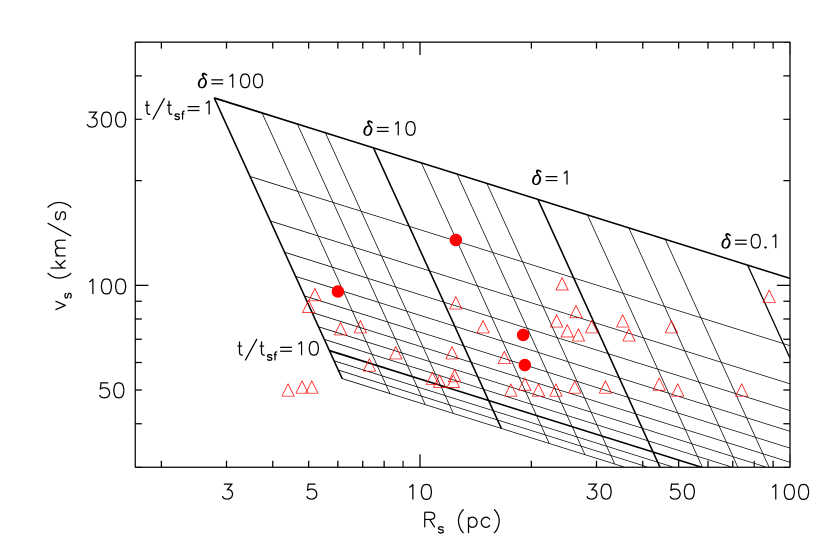
Figure 9 shows how the radius and velocity of Hi SNRs evolve in time () for a given . The SNR develops a fast-expanding Hi shell at , which expands and slows down along a line of constant as it evolves. For example, suppose an SNR has in a uniform medium with , so that . Then the SNR has an Hi shell of = (20 pc, km s-1) at and = (40 pc, km s-1) at , where yr. The Hi SNRs identified in the I-GALFA survey have radii of 6–19 pc and expansion velocities — km s-1, or –50 and –9. The expansion velocities of the detected Hi shells are all greater than km s-1, which is necessary to be clearly discernible from the Galactic background emission (see next section). It is also worth noting that no large HI SNRs expected in the diffuse ISM have been detected, i.e., there are no Hi SNRs where in Figure 9. This may be either because such SNRs are rare or because such SNRs are faint in radio continuum and “missed” in the current catalog of SNRs. We will discuss this further in next section.
4.2 Visibility and Statistics of Hi SNRs
The visibility or detectability of SNRs in the Hi 21-cm line was investigated by Koo & Kang (2004). An important constraint on the visibility of Hi SNRs is that they should be in the “right” positions in the Galaxy where the line-of-sight velocities of expanding Hi shells can easily exceed the maximum or minimum LSR velocities of the Galactic background Hi emission, e.g., along the loci of tangential points in the inner Galaxy. For example, W51C is in a high-visibility location, because its systemic velocity ( km s-1) is close to the maximum velocity ( km s-1; see Figure 2) of the background emission in this direction (). In contrast, W44 is in a low-visibility location: its systemic velocity ( km s-1) is much less than the maximum velocity ( km s-1) in this direction (). Apparently, W44 is relatively young and has the largest expansion velocity, so that both its approaching and receding parts can be seen.
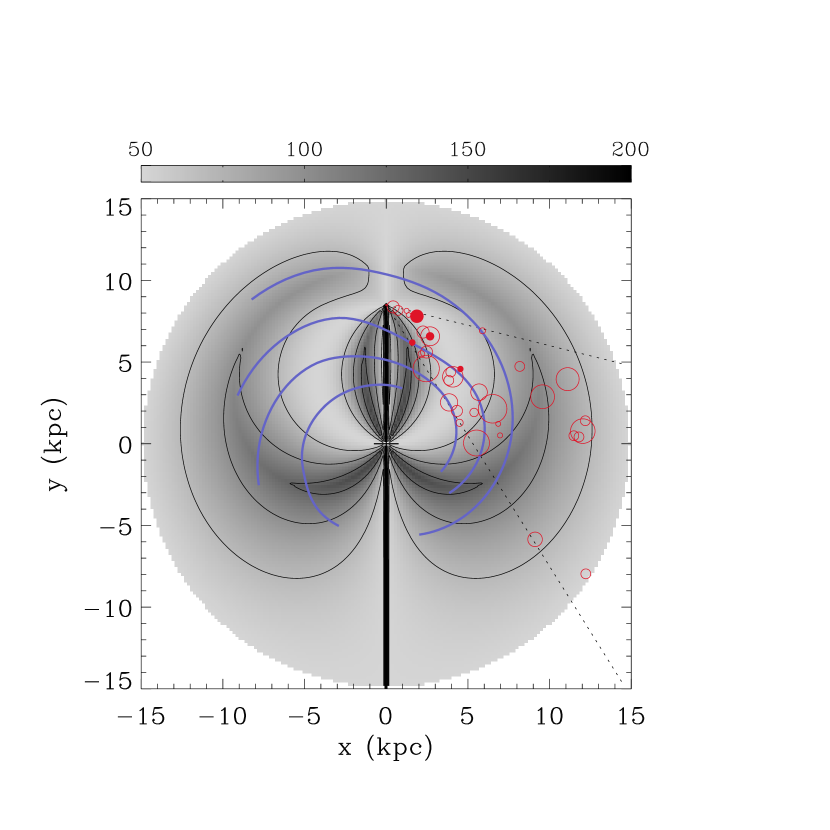
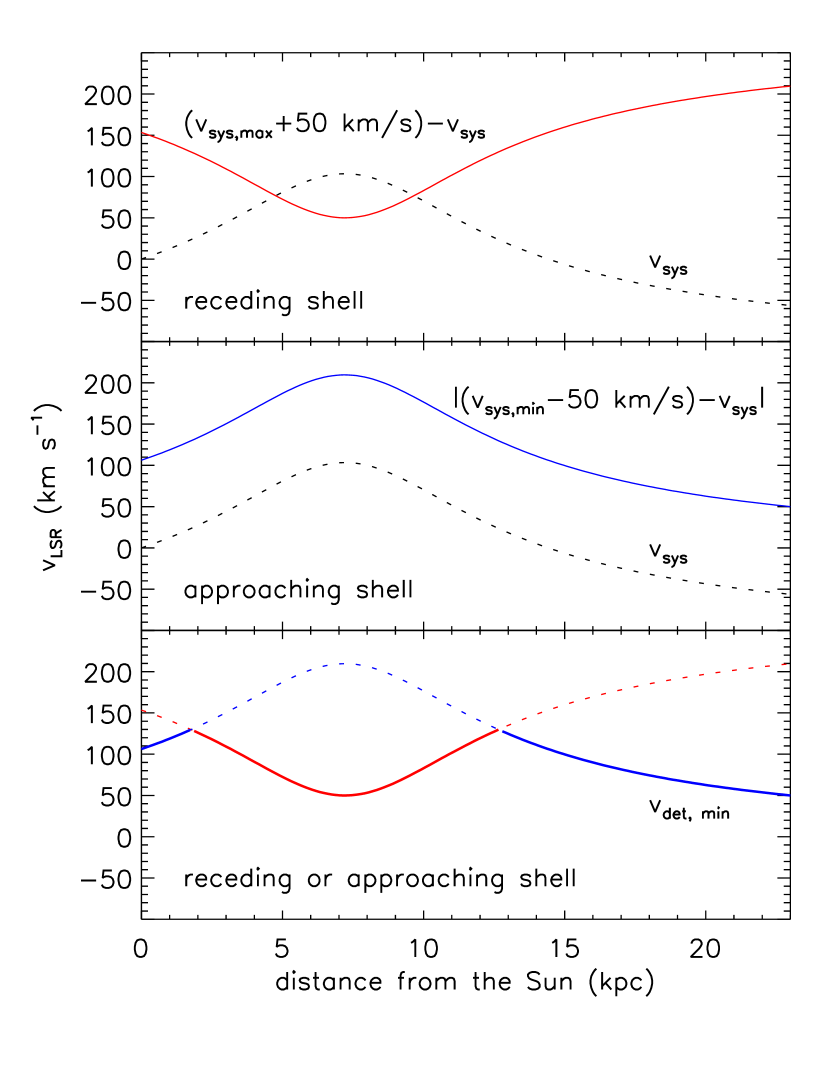
The locations of the SNRs in the I-GALFA area are marked in Figure 10 (left), with filled circles for the 4 Hi SNRs. Table 3 lists our adopted distances, where the fifth column gives the distances that are considered to be reliable. Twenty-eight SNRs have reliable distances, half of which are from the compilation by Green (2009a). The other half are from our own literature search, with references listed in the last column. The sixth column gives distances estimated using the surface brightness – diameter () relation (e.g., Case & Bhattacharya, 1998; Arbutina et al., 2004; Guseinov et al., 2003). For this work, we adopt the Case & Bhattacharya (1998) version. The relation has considerable dispersion, and its applicability has been criticized (e.g., Green, 2004). But without any other estimates, it still provides a useful reference. We use reliable distances wherever possible and distances for other SNRs.
The background grey-scale map in Figure 10 (left) shows the minimum shell expansion velocity for detection, . The Galactic disk is assumed to be axi-symmetric with radius 15 kpc and a flat rotation curve with kpc and km s-1. An expanding Hi shell is considered to be visible if the LSR velocity of its receding endcap, which is the sum of the systemic LSR velocity and the expansion velocity, is greater than the maximum LSR velocities allowed by circular rotation in that direction by more than 50 km s-1 or vice versa. This appears to be conservative considering that the turbulent velocity dispersion of the warm neutral medium is 27 km s-1 (Heiles & Troland, 2003) and that the non-circular velocities due to spiral shocks are typically 20 km s-1 (e.g., Roberts, 1969). But note that the Hi emission from fast-expanding SNR shells appears as very weak broad wings superposed on the Gaussian tails of background emission; in Figure 6, for example, the maximum LSR velocities in the directions of the four SNRs according to the flat rotation curve are, in the order of increasing Galactic longitude, +94, +54, +42, and +15 km s-1, respectively. Hi shells along the tangent points in the inner Galaxy have small ( km s-1) because their positive-velocity wings can be easily detected. The Hi shells near the outer boundary of the disk in the survey area also have small , but, in this case, it is because their negative velocity wings can be easily detected. In order to help the understanding, Figure 10 (right) shows the variation of for SNRs in the direction at . In the top and middle frames, the dotted line shows how the systemic LSR velocity () varies with distance from the Sun due to Galactic rotation. Note that the maximum and minimum systemic LSR velocities in this direction are 103 and 56 km s-1, respectively. This gives an approximate velocity range of the background Hi emission. Therefore, for the receding portion of an expanding SNR shell to be detectable, its expansion velocity should be larger than km s-1, where is the systemic velocity of the shell (red line in the top frame). On the other hand, for the approaching portion to be detectable, which will appear as a negative-velocity wing, the expansion velocity should be larger than km s-1 (blue line in the middle frame). For just one part of the shell detectable, the required expansion velocity will be the smaller of the two (thick line in the bottom frame). Figure 10 shows that three SNRs (W51C, G, CTB 80) are located where the is relatively small, i.e., 50 km s-1, whereas W44 is located in a region where km s-1. Table 3 lists at the position of each SNR.
In Figure 10, there are many SNRs that are not detected in Hi 21-cm line in spite of their favorable locations in areas where is small. They could be either too young or too old to have an associated fast-expanding Hi shell. Their nature can be inferred in Figure 11, which is same as Figure 9, but we now also mark the SNRs without detected Hi shells using their minimum velocities for detection. In Figure 11, an SNR without detected Hi can be either an old SNR with a velocity less than or a young SNR above the grid, i.e., with velocity greater than that at . Note that if an SNR is above the grid, it means that the remnant is in adiabatic phase and does not have an Hi shell. It is “too young”, i.e., younger than in equation (6). Note that is large when the ambient density is low. For small SNRs, e.g., those with pc, the latter possibility is more likely unless they are in a dense environment, such as a molecular cloud. For larger SNRs, both possibilities are likely. Further observational studies will be helpful to address the nature of such SNRs individually.
As a final comment, our study in this paper has targeted known SNRs, but there could be many missing SNRs. The estimated SN rate in our Galaxy ranges from 1.4 to 5.8 yr-1 (Li et al., 2011). If we adopt the recent estimate from the Lick Observatory Supernova Search, yr-1 (Li et al., 2011), the total number of radio SNRs in the Galaxy would be , assuming yrs of visible radio continuum emission. Then, simply using the geometrical fraction of the survey area, which is 18% for a Galactic disk radius of 15 kpc, the expected number of radio SNRs in the survey area is . Therefore, the number of known SNRs (39) is only 8% of the expected population. This small fraction could be due to several factors: faintness of old SNRs in radio continuum, confusion due to Galactic background emission, collective explosions of CCSNe that produce supershells instead of SNRs, etc. (see Koo & Kang, 2004; Higdon & Lingenfelter, 2005; Brogan et al., 2006). So in principle, there could be many old SNRs or supershells not visible in radio continuum but visible in the Hi 21-cm line, and it may be worthwhile to search for such Hi features.
5 Summary
The I-GALFA survey provides fully-sampled Hi data covering the Galactic plane between longitudes 32 to 77 degrees and latitudes to degrees. The high resolution (4′) and high sensitivity (0.2 K) of the data provide an opportunity to investigate small-scale, faint Hi emission in the diffuse ISM. In this paper, we have explored the I-GALFA data toward the all known 39 SNRs in order to search for associated fast-expanding Hi shells. Our main results are as follows:
1. Among the 39 SNRs in the survey area, four SNRs show associated high-velocity (HV) Hi emission. These four SNRs were classified by KH91 as rank 3 SNRs with excess emission at the highest positive velocities in their low-resolution (30′) Hi study. KH91 listed another SNR (W50) as a candidate with associated HV Hi emission out of 26 SNRs known in the survey area at that time. But the high-resolution I-GALFA data show that the emission extends well beyond the SNR boundary, so we consider it not associated with the SNR. Surprisingly, we have not detected associated HV Hi emission in any of the ten SNRs discovered since the work of KH91.
2. The four SNRs where we have detected physically associated HV Hi gas are G (W44), G (W51C), G (HC40), and G (CTB 80). Their velocity structures indicate that the HV Hi gas is in portions of expanding shells. In the SNR W44, we see Hi emission from both receding and approaching portions of the shell, which is the first ever such detection. In the other SNRs, we could see only the receding portions of the shells. The SNR G shows highly circularly symmetric Hi emission that matches very well with its radio continuum morphology. There is a ring structure lying just outside the SNR boundary, which could be a pre-existing structure formed by the progenitor. We discuss the properties of the expanding Hi shells in these two SNRs and derive their physical parameters. The other two SNRs have been studied previously in detail. The I-GALFA results are consistent with those previous studies.
3. The four SNRs with associated fast-expanding Hi shells are all middle-aged SNRs with yr (Table 2). The expansion velocities of the shells range from 59 to 135 km s-1. Notably, their estimated ambient densities are all cm-3, significantly higher than that of the warm or hot ISM filling most of interstellar space. Two of them have associated PWN indicating that they are the remnants of CCSNe. The other two do not have PWN but are interacting with molecular clouds, so they are also likely the remnants of CCSNe. Therefore, the SNRs with Hi shells (Hi SNRs) that are detected are middle-aged SNRs of probable CCSN origin interacting with a relatively dense medium. Large Hi SNRs in the diffuse ISM could be detected in principle, but they have not found.
4. The visibility of Hi SNRs depends on their location in the Galaxy. Three of the four detected Hi SNRs (excluding W44) are located where the visibility is favorable. On the other hand, many SNRs are not detected in the Hi 21-cm line despite having favorable locations. They could be either too young or too old to have an associated fast-expanding Hi shell. We present a diagram (Figure 11) that can be used to infer the nature of these SNRs.
References
- Abdo et al. (2010) Abdo, A. A., Ackermann, M., Ajello, M., et al. 2010, Science, 327, 1103
- Abdo et al. (2009) Abdo, A. A., Ackermann, M., Ajello, M., et al. 2009, ApJ, 706, L1
- Arbutina et al. (2004) Arbutina, B., Urošević, D., Stanković, M., & Tešić, Lj. 2004, MNRAS, 350, 346
- Boumis et al. (2009) Boumis, P., Xilouris, E. M., Alikakos, J., Christopoulou, P. E., Mavromatakis, F., Katsiyannis, A. C., & Goudis, C. D. 2009, A&A, 499, 789
- Boumis et al. (2005) Boumis, P., Mavromatakis, F., Xilouris, E. M., Alikakos, J., Redman, M. P., & Goudis, C. D. 2005, A&A, 443, 175
- Boumis et al. (2004) Boumis, P, Meaburn, J., Lpez, J. A., Mavromatakis, F., Redman, M. P., Harman, D. J., & Goudis, C. D. 2004, A&A, 424, 583
- Brand & Blitz (1993) Brand, J. & Blitz, L. 1993, A&A, 275, 67
- Braun & Strom (1986) Braun, R., & Strom, R. G. 1986, A&AS, 63, 345
- Brogan et al. (2006) Brogan, C. L., Gelfand, J. D., Gaensler, B. M., Kassim, N. E., & Lazio, T. J. W. 2006, ApJ, 639, L25
- Burton (1988) Burton, W. B. 1988, in: Galactic and Extragalactic Radio Astronomy, 2nd ed., Eds. G. L. Verschuur, K. I. Kellermann (Springer, Berlin) 154
- Case & Bhattacharya (1998) Case, G. L., & Bhattacharya, D. 1998, ApJ, 504, 761
- Castelletti et al. (2007) Castelletti, G., Dubner, G., Brogan, C., & Kassim, N. E. 2007, A&A, 471, 537
- Caswell et al. (1975) Caswell, J. L., Murray, J. D., Roger, R. S., Cole, D. J., & Cooke, D. J. 1975, A&A, 45, 239
- Cazzolato & Pineault (2005) Cazzolato, F., & Pineault, S. 2005, AJ, 129, 2731
- Chevalier (1999) Chevalier, R. A. 1999, ApJ, 511, 798
- Cioffi et al. (1988) Cioffi, D. F., McKee, C. F., & Bertschinger, E. 1988, ApJ, 334, 252
- Ehlerová & Palouš (2005) Ehlerová, S., & Palouš, J. 2005, A&A, 437, 101
- Fesen et al. (1988) Fesen, R. A., Saken, J. M., & Shull, J. M. 1988, Nature, 334, 229
- Folgheraiter et al. (1997) Folgheraiter, E. L., Warwick, R. S., Watson, M. G., & Koyama, K. 1997, MNRAS, 292, 365
- Frail & Clifton (1989) Frail, D. A., & Clifton, T. R. 1989, ApJ, 336, 854
- Froebrich et al. (2011) Froebrich, D., Davis, C. J., Ioannidis, G., et al. 2011, MNRAS, 413, 480
- Giacani et al. (1998) Giacani, E. B., Dubner, G., Cappa, C., & Testori, J. 1998, A&AS, 133, 61
- Gibson et al. (2012) Gibson, S. J., Koo, B., Douglas, K. A., et al. 2012, American Astronomical Society Meeting Abstracts, 219, #349.29
- Giovanelli & Haynes (1979) Giovanelli, R., & Haynes, M. P. 1979, ApJ, 230, 404
- Giuliani et al. (2011) Giuliani, A., Cardillo, M., Tavani, M., et al. 2011, ApJ, 742, L30
- Green (2004) Green, D. A. 2004, Bulletin of the Astronomical Society of India, 32, 335
- Green (2009a) Green, D. A. 2009a, Bulletin of the Astronomical Society of India, 37, 45
- Green (2009b) Green, D. A. 2009b, MNRAS, 399, 177
- Guseinov et al. (2003) Guseinov, O. H., Ankay, A., Sezer, A., & Tagieva, S. O. 2003, A&AT, 22, 273
- Heiles (1979) Heiles, C. 1979, ApJ, 229, 533
- Heiles (1984) Heiles, C. 1984, ApJS, 55, 585
- Heiles & Troland (2003) Heiles, C., & Troland, T. H. 2003, ApJ, 586, 1067
- Higdon & Lingenfelter (2005) Higdon, J. C., & Lingenfelter, R. E. 2005, ApJ, 628, 738
- Jiang et al. (2010) Jiang, B., Chen, Y., Wang, J., Su, Y., Zhou, X., Safi-Harb, S., & DeLaney, T. 2010, ApJ, 712, 1147
- Junkes (1996) Junkes, N. 1996, Unsolved Problems of the Milky Way, 169, 627
- Junkes et al. (1992a) Junkes, N., Fuerst, E., & Reich, W. 1992a, A&AS, 96, 1
- Junkes et al. (1992b) Junkes, N., Fuerst, E., & Reich, W. 1992b, A&A, 261, 289
- Kim et al. (2013) Kim, H.-J., Koo, B.-C., & Moon, D.-S. 2013, in preparation
- Koo et al. (2010) Koo, B.-C., Gibson, S. J., Kang, J.-h., et al. 2010, Highlights of Astronomy, 15, 788
- Koo & Kang (2004) Koo, B.-C., & Kang, J.-h. 2004, MNRAS, 349, 983
- Koo et al. (2004) Koo, B.-C., Kang, J.-h., & McClure-Griffiths, N. M. 2004, Journal of Korean Astronomical Society, 37, 61
- Koo & Moon (1997a) Koo, B.-C., & Moon, D.-S. 1997a, ApJ, 475, 194
- Koo & Moon (1997b) Koo, B.-C., & Moon, D.-S. 1997b, ApJ, 485, 263
- Koo & Heiles (1995) Koo, B.-C., & Heiles, C. 1995, ApJ, 442, 679
- Koo et al. (1995) Koo, B.-C., Kim, K.-T., Seward, F. D. 1995, ApJ, 447, 211
- Koo et al. (1993) Koo, B.-C., Yun, M.-S., Ho, P. T. P., & Lee, Y. 1993, ApJ, 417, 196
- Koo & Heiles (1991) Koo, B.-C., & Heiles, C. 1991, ApJ, 382, 204 (KH91)
- Koo et al. (1990) Koo, B.-C., Reach, W. T., Heiles, C., Fesen, R. A., & Shull, J. M. 1990, ApJ, 364, 178
- Koralesky et al. (1998) Koralesky, B., Frail, D. A., Goss, W. M., Claussen, M. J., & Green, A. J. 1998, ApJ, 116, 1323
- Kothes et al. (2005) Kothes, R., Uyanıker, B., & Reid, R. I. 2005, A&A, 444, 871
- Kothes et al. (2004) Kothes, R., Landecker, T. L., & Wolleben, M. 2004, ApJ, 607, 855
- Kothes et al. (2003) Kothes, R., Reich, W., Foster, T., & Byun, D.-Y. 2003, ApJ, 588, 852
- Kulkarni et al. (1988) Kulkarni, S. R., Clifton, T. C., Backer, D. C., Foster, R. S., & Fruchter, A. S. 1988, Nature, 331, 50
- Lang et al. (2010) Lang, C. C., Wang, Q. D., Lu, F., & Clubb, K. I. 2010, ApJ, 709, 1125
- Lee et al. (2008) Lee, J.-J., Koo, B.-C., Yun, M. S., Stanimirović, S., Heiles, C., & Heyer, M. 2008, AJ, 135, 796
- Levine et al. (2008) Levine, E. S., Heiles, C., & Blitz, L. 2008, ApJ, 679, 1288
- Li et al. (2011) Li, W., Chornock, R., Leaman, J., Filippenko, A. V., Poznanski, D., Wang, X., Ganeshalingam, M., & Mannucci, F. 2011, MNRAS, 412, 1473
- Lockman et al. (2007) Lockman, F. J., Blundell, K. M., & Goss, W. M. 2007, MNRAS, 381, 881
- Lee et al. (2009) Lee, H.-G., Moon, D.-S., Koo, B.-C., Lee, J.-J., & Matthews, K. 2009, ApJ, 691, 1042
- Lozinskaya et al. (1993) Lozinskaya, T. A., Sitnik, T. G., & Pravdikova, V. V. 1993, ARep, 37, 240
- Marsden et al. (2001) Marsden, D., Lingenfelter, R. E., Rothschild, R. E., & Higdon, J. C. 2001, ApJ, 550, 397
- Markwardt (2009) Markwardt, C. B. 2009, Astronomical Society of the Pacific Conference Series, 411, 251 (http://purl.com/net/mpfit)
- Matthews et al. (1998) Matthews, B. C., Wallace, B. J., & Taylor, A. R. 1998, ApJ, 493, 312
- Mavromatakis et al. (2001) Mavromatakis, F., Papamastorakis, J., Ventura, J., Becker, W., Paleologou, E. V, & Schaudel, D. 2001, A&A, 370, 265
- McClure-Griffiths (2012) McClure-Griffiths, N. M. 2012, AN, 333, 497
- McClure-Griffiths et al. (2002) McClure-Griffiths, N. M., Dickey, J. M., Gaensler, B. M., & Green, A. J. 2002, ApJ, 578, 176
- McClure-Griffiths (2001) McClure-Griffiths N. 2001, PhD thsis, Univ. Minnesota
- Peek et al. (2011) Peek, J. E. G., Heiles, C., Douglas, K. A., et al. 2011, ApJS, 194, 20
- Peek et al. (2010) Peek, J. E. G., Begum, A., Douglas, K. A., et al. 2010, Astronomical Society of the Pacific Conference Series, 438, 393
- Petre et al. (2002) Petre, R., Kuntz, K. D., & Shelton, R. L. 2002, ApJ, 579, 404
- Reach et al. (2005) Reach, W. T., Rho, J., & Jarrett, T. H. 2005, ApJ, 618, 297
- Reich et al. (1990) Reich, W., Furest, E., Reich, P., & Reif, K. 1990, A&AS, 85, 633
- Rho & Petre (1998) Rho, J., & Petre, R. 1998, ApJ, 503, L167
- Roberts (1969) Roberts, W. W. 1969, ApJ, 158, 123
- Seta et al. (1998) Seta, M., Hasegawa, T., Dame, T. M., Sakamoto, S., Oka, T., Handa, T., Hayashi, M., Morino, J.-I., Sorai, K., & Usuda, K. S. 1998, ApJ, 505, 286
- Stil et al. (2006) Stil, J. M., Taylor, A. R., Dickey, J. M., Kavars, D. W., Martin, P. G., Rothwell, T. A., Boothroyd, A. I., Lockman, F. J., & McClure-Griffiths, N. M. 2006, AJ, 132, 1158
- Taylor & Cordes (1993) Taylor, J. H., & Cordes, J. M. 1993, ApJ, 411, 674
- Taylor et al. (2003) Taylor, A. R., Gibson, S. J., Peracaula, M., et al. 2003, AJ, 125, 3145
- Wolszczan et al. (1991) Wolszczan, A., Cordes, J. M., & Dewey, R. J. 1991, ApJ, 372, L99
- Wootten (1977) Wootten, H. A. 1977, ApJ, 216, 440
- Yamaguchi et al. (2004) Yamaguchi, H., Ueno, M., Koyama, K., Bamba, A., & Yamauchi, S. 2004, PASJ, 56, 1059
- Yang et al. (2006) Yang, J., Zhang, J.-L., Cai, Z.-Y., Lu, D.-R., & Tan, Y.-H. 2006, Chinese J. Astron. Astrophys., 6, 210
- Yoshita et al. (2000) Yoshita, K., Miyata, E., & Tsunemi, H. 2000, PASJ, 52, 867
| G-Name | Other Name | Size | Type | KH91 | Note on the High-Velocity Hi Gas from This Work | |
|---|---|---|---|---|---|---|
| (arcmin) | (K) | Rank11Rank ‘(3)’ SNRs were classified as ‘3’ but regarded to be not-associated with the SNRs by KH91. | ||||
| G | 3C391 | 75 | S | 140 | 1 | |
| G | 40? | C? | ||||
| G | 6 | S | 1.7? | |||
| G | Kes 78 | 17 | S? | 8.6? | 2 | |
| G | 18 | S | 2.2 | 0 | ||
| G | Kes 79 | 10 | S | 45 | 2 | |
| G | W44 | 3527 | C | 52 | 3 | associated HV Hi gas at – and – km s-1 |
| G | 1511 | S | 9.7 | |||
| G | 25? | S? | 0 | |||
| G | 1713? | S | 0.6? | |||
| G | 3C396 | 8x6 | C | 74 | 2 | |
| G | W50 | 12060 | ? | 2.2? | 3 | HV Hi gas at – km s-1, but extends beyond the SNR |
| G | 22 | S | 4.6 | (3) | HV Hi gas at – km s-1, but portion of a larger structure | |
| G | 3C397 | 4.52.5 | S | 401 | (3) | HV Hi gas at – km s-1, but probably background emission |
| G | 24 | S | 1.1? | (3) | HV Hi gas at – km s-1, but probably background emission | |
| G | W49B | 43 | S | 649 | 1 | |
| G | 60? | S? | 0.5? | |||
| G | 22 | S | 1.8? | 0 | ||
| G | (HC30) | 1713 | S | 13 | 1 | |
| G | W51C | 30 | S? | 39? | 3 | associated HV Hi gas at – km s-1 |
| G | 3C400.2 | 33x28 | S | 1.6 | 0 | |
| G22This SNR is classified as type ‘C’ since a larger radio shell at 1.4 GHz is detected by Lang et al. (2010). Its size and surface brightness, which is 100-200 mJy beam-1 with a beam of , are used to calculate . | 12.4 | C | 1 | |||
| G | (HC40) | 40 | S | 3.6 | 3 | associated HV Hi gas at – km s-1 |
| G | 2015? | S | 0.3? | |||
| G | 23 | S | 0.5 | 0 | ||
| G | (4C21.53) | 12? | S? | 2.5? | 0 | |
| G | 15 | S | 2.7? | |||
| G | 2016? | ? | 1.0 | |||
| G | 8 | F | 6.1 | |||
| G | 9050 | S | 0.2 | |||
| G | 310240 | S? | 0.1? | (3) | HV Hi gas at – km s-1, but no morphological relation | |
| G | DA 495 | 22 | F | 2.1 | 2 | |
| G | 1512 | S | 1.1 | |||
| G | 23 | ? | 0.3? | |||
| G | CTB 80 | 80? | ? | 3.8? | 3 | associated HV Hi gas at – km s-1 |
| G | 1614 | S | 1.7 | |||
| G | 27 | S? | 2.7 | 0 | ||
| G | Cygnus Loop | 230160 | S | 1.2 | 0 | |
| G | CTB 87 | 86 | F | 38 | 0 |
Note. — (1) The size is the angular diameter in radio continuum; a single value is quoted for nearly circular remnants, and the product of two values, the major and minor axes, is quoted for elongated remnants. (2) The type codes ‘S’, ‘F’, or ‘C’ represent SNRs with a ‘shell’, ‘filled-centre’, or ‘composite’ radio structure. Uncertain parameters are listed with a question mark. (3) The mean brightness temperature at 21 cm is calculated from the 1 GHz flux () and spectral index () in Green’s catalog, i.e., where is 21.1 cm and is the solid angle of the source in steradians. For sources without spectral indexes, we adopt . We use the area of a circle (or ellipse) corresponding to the sizes in Table 1 as the solid angle.
| Name | Age | Hi Mass | K.E. | P?11Detection (y) of associated pulsars. References are Wolszczan et al. (1991) and Kulkarni et al. (1988) for W44 and CTB 80, respectively. | M?22Detection (y) of associated molecular clouds. References are Wootten (1977), Koo & Moon (1997b), and Junkes et al. (1992a) for W44, W51C, and G, respectively. | ||||||
|---|---|---|---|---|---|---|---|---|---|---|---|
| (kpc) | (pc) | (km s-1) | (km s-1) | ( yr) | (M⊙) | ( erg) | (cm-3) | ( erg) | |||
| W44 | 2.8 | 12.5 | 47 | 135(2) | 2.73(0.04) | 393(13) | 9.9(0.4) | 1.9(0.1) | 3.2(0.1) | y | y |
| W51C33The Hi shell parameters are from Koo & Moon (1997a). W51C is interacting with a molecular cloud, and only a lower limit to the Hi mass has been obtained. We adopt 100 cm-3 as a characteristic density of the cloud. | 6 | 6 | 62 | 96(6) | 1.8(0.1) | 1200 | 17 | y | |||
| G | 3.3 | 19.2 | 40 | 59(6) | 9.5(1.0) | 580(150) | 2.8(0.9) | 0.79(0.20) | 1.5(0.5) | y | |
| CTB 8044The Hi shell parameters are from Koo et al. (1990). Koo et al. (1990) obtained an Hi mass of 1200 M⊙ by fitting a Gaussian profile to the observed Hi mass distribution. But an independent estimate of the mass of the shell is available from infrared studies (900 M⊙; see Koo et al. 1990). We adopt the mean of the two as the mass of the expanding shell. | 2 | 18.6 | 13 | 72(3) | 7.7(0.3) | 1050(210) | 7.6(1.5) | 1.5(0.3) | 3.8(0.9) | y |
Note. — The distance (), radius (), and systemic velocity () are adopted values, so that they do not have errors. The errors in W44 and G are formal errors from the fit.
| Coordinates | Distance | |||||||||||
|---|---|---|---|---|---|---|---|---|---|---|---|---|
| G-Name | b | Type | Quoted | Radius | 11Minimum expansion velocity for detection. | Reference(s) | ||||||
| (°) | (°) | (kpc) | (kpc) | (pc) | (km s-1) | |||||||
| G | 31.89 | 0.03 | S | 8.5 | 5.4 | 7.3 | 59 | Green (2009a) | ||||
| G | 32.12 | 0.90 | C? | 4.6 | 26.8 | 72 | Folgheraiter et al. (1997) | |||||
| G | 32.41 | 0.11 | S | 17 | 33.9 | 14.8 | 76 | Yamaguchi et al. (2004) | ||||
| G | 32.81 | 0.06 | S? | 7.1 | 6.3 | 17.6 | 50 | Koralesky et al. (1998); Boumis et al. (2009) | ||||
| G | 33.18 | 0.55 | S | 10.1 | 26.4 | 84 | ||||||
| G | 33.70 | 0.01 | S | 7.822Recalculated by Green (2004) assuming a flat rotation curve with kpc and km s-1. | 5.1 | 11.3 | 53 | Frail & Clifton (1989); Green (2004, 2009a) | ||||
| G | 34.67 | 0.39 | C | 2.822Recalculated by Green (2004) assuming a flat rotation curve with kpc and km s-1. | 12.5 | 89 | Caswell et al. (1975); Green (2004, 2009a) | |||||
| G | 35.59 | 0.50 | S | 3.7 | 7.6 | 6.9 | 76 | Green (2009b) | ||||
| G | 36.59 | 0.69 | S? | 53 | ||||||||
| G | 36.58 | 2.60 | S | 20.5 | 44.3 | 52 | ||||||
| G | 39.24 | 0.32 | C | 8.5 | 8.6 | 64 | Lee et al. (2009) | |||||
| G | 39.69 | 2.39 | ? | 6.0 | 74.0 | 50 | Green (2009a) | |||||
| G | 40.52 | 0.51 | S | 3.833Recalculated by this work using the Galactic rotation curve of Brand & Blitz (1993) with kpc and km s-1. | 6.1 | 12.2 | 64 | Yang et al. (2006) | ||||
| G | 41.11 | 0.31 | S | 10.633Recalculated by this work using the Galactic rotation curve of Brand & Blitz (1993) with kpc and km s-1. | 6.1 | 5.2 | 94 | Jiang et al. (2010) | ||||
| G | 42.82 | 0.64 | S | 6 | 10.3 | 20.9 | 50 | Marsden et al. (2001) | ||||
| G | 43.27 | 0.19 | S | 10 | 4.8 | 5.0 | 87 | Green (2009a) | ||||
| G | 43.91 | 1.61 | S? | 5.7 | 49.7 | 50 | ||||||
| G | 45.69 | 0.39 | S | 9.1 | 29.1 | 76 | ||||||
| G | 46.77 | 0.30 | S | 7.8 | 5.8 | 16.9 | 62 | Green (2009a) | ||||
| G | 49.14 | 0.60 | S? | 6 | 1.9 | 26.2 | 51 | Koo et al. (1995) | ||||
| G | 53.63 | 2.26 | S | 2.8 | 6.6 | 12.4 | 55 | Giacani et al. (1998); Green (2009a) | ||||
| G | 54.09 | 0.26 | C | 6 | 10.8 | 54 | Kim et al. (2013) | |||||
| G | 54.47 | 0.29 | S | 3.344Recalculated by Case & Bhattacharya (1998) assuming a flat rotation curve with kpc and km s-1. | 3.7 | 19.2 | 52 | Junkes et al. (1992a); Case & Bhattacharya (1998) | ||||
| G | 55.11 | 0.42 | S | 14 | 23.1 | 35.3 | 79 | Matthews et al. (1998); Green (2009a) | ||||
| G | 55.60 | 3.51 | S | 14.3 | 47.8 | 76 | ||||||
| G | 57.30 | 0.83 | S? | 14.3 | 25.0 | 74 | ||||||
| G | 59.58 | 0.12 | S | 11.1 | 24.2 | 101 | ||||||
| G | 59.81 | 1.20 | ? | 14.1 | 36.7 | 72 | ||||||
| G | 63.79 | 1.17 | F | |||||||||
| G | 65.27 | 0.30 | S | 9 | 6.8 | 87.8 | 93 | Green (2009a) | ||||
| G | 65.18 | 5.66 | S? | 0.8 | 2.1 | 31.7 | 51 | Boumis et al. (2004); Green (2009a) | ||||
| G | 65.72 | 1.21 | F | 1.5 | 4.8 | 51 | Kothes et al. (2004); Green (2009a) | |||||
| G | 67.74 | 1.82 | S | 12 | 18.0 | 23.4 | 79 | Mavromatakis et al. (2001) | ||||
| G | 68.60 | 1.20 | ? | 19.2 | 64.2 | 5055This remnant is outside the assumed disk radius of 15 kpc, so we simply adopt 50 km s-1 as the minimum velocity. | ||||||
| G | 68.84 | 2.78 | ? | 2 | 1.8 | 23.3 | 50 | Koo et al. (1990) | ||||
| G | 69.69 | 1.00 | S | 266Yoshita et al. (2000) suggested that G will be at a similar distance as CTB 80, since the column density of the ISM between us and G is analogous with that of CTB 80. In this paper, we adopt 2 kpc for both CTB 80 and G. | 13.2 | 4.4 | 50 | Yoshita et al. (2000) | ||||
| G | 73.91 | 0.88 | S? | 1.3 | 6.4 | 5.1 | 51 | Lozinskaya et al. (1993) | ||||
| G | 73.98 | 8.56 | S | 0.44 | 1.2 | 12.3 | 53 | Green (2009a) | ||||
| G | 74.94 | 1.14 | F | 6.1 | 6.1 | 75 | Kothes et al. (2003); Green (2009a) | |||||
Note. — Distance with a symbol of ‘’ denotes that we adopt the average of possible distances given by reference(s).