Changes in the self-energy and -wave pairing strength with doping in overdoped La2-xSrxCuO4
Abstract
Angle resolved photoemission spectroscopy (ARPES) studies of the overdoped cuprate superconductor La2-xSrxCuO4 find only small changes in the near nodal electron self energy over a spectral range of several hundred meV as the doping increases from to and the superconducting transition temperature decreases from 32K to 0K. These measurements put constraints on the structure of the electron-electron interaction. Here we show that a spin-fluctuation interaction leads to behavior which is consistent with these experimental results.
pacs:
74.72.-h, 74.25.Jb, 79.60.-i, 74.20.MnA possible way to identify the pairing interaction responsible for superconductivity in a given material is to investigate the structure in the effective self-energy extracted from angle resolved photoemission spectroscopy (ARPES) measurements. Valla ; Lanzara ; Kaminski ; Johnson ; Zhou ; Zhou2 ; Borisenko ; Meevasana ; Kordyuk ; Yoshida ; Peng ; Yun ; Park Here the basic premise is that the interaction that determines the normal self-energy must also play a central role in the anomalous (pairing) self-energy. However, in the cuprates, the interaction is strongly anisotropic leading to a -wave pairing state. Then, the normal self-energy involves a projection of the electron-electron interaction which is determined by the one-electron Green’s function itself while the strength of the -wave pairing interaction depends upon a -wave projection of the singlet part of the electron-electron interaction. Thus, the information about the pairing interaction provided by ARPES in the normal state is indirect. Yun Nevertheless, as the superconducting transition temperature in the cuprates strongly changes with doping, the doping dependence of the ARPES data provides additional information and can put different scenarios for the pairing interaction under test. Recently Park et al. Park have reported ARPES measurements on overdoped La2-xSrxCuO4 (LSCO) with different doping levels that raise questions regarding the origin of the pairing interaction. In the present work we provide theoretical calculations within a spin-fluctuation scenario and study the doping dependence of the nodal electronic structure and the strength of the -wave pairing interaction.
In the work by Park et al. Park , the momentum distribution curve (MDC) dispersion for nodal momentum cuts, as well as several nearby cuts, were measured for dopings of ( K) and ( K). Then taking a linear bare band dispersion connecting the MDC peak positions between eV and 0.0 eV, the real part of an effective self energy Re was determined for each doping. The idea was to see whether the changes in Re over this 200 meV spectral region correlated with the disappearance of superconductivity. For both dopings a kink appeared in the disperson of the MDC peak near 70 meV giving rise to a broad peak in Re as a function of energy . The amplitude of the peak in Re was observed to decrease by only about 30% between the superconducting (K) and non-superconducting material. The authors noted that the broad nature of the peak indicated coupling to a spectrum of modes but concluded that the observed change in Re between the and 0.3 samples was insufficient to account for the decrease in if the pairing interaction arose from modes in this spectral range.
Here we re-examine this conclusion based on a fluctuation exchange (FLEX) Bickers ; DT calculation of the single particle spectral function for a Hubbard model of overdoped LSCO. Although FLEX is inherently a weak coupling approximation, we believe that it can provide a useful approximation for the overdoped regime. Since we are interested in determining the spectral function and self energy as functions of frequency, we will work on the real frequency axis as described in Ref. DT, . This avoids the need of analytic continuation from imaginary Matsubara frequencies to the real axis, which can be numerically unstable.
Within FLEX the imaginary part of the self-energy is obtained from
| (1) | |||||
Here, and are the usual Fermi and Bose functions, respectively, and is the number of lattice sites. The vertex function includes the interactions due to spin and charge fluctuations and is given by
| (2) |
where the last term removes a double counting. is calculated selfconsistently from
| (3) | |||||
with the single particle spectral weight in the normal state given by
| (4) |
The real parts of Eqs. (1) and (3) are calculated from Kramers-Kronig transformations. In the FLEX approximation, Equations (1) to (4) comprise a set of coupled integral equations that are iterated until a selfconsistent solution is obtained.
For overdoped La2-xSrxCuO4, information on the renormalized bandstructure has been obtained from tight-binding fits to ARPES data by Yoshida et al. Yoshida Their tight-binding fit is of the form
| (5) | |||||
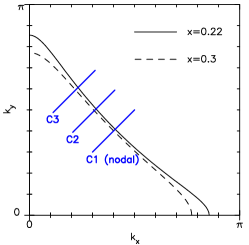
and for and 0.3 gives the Fermi surfaces shown in Fig. 1.
In the FLEX calculation, we adjust the bandstructure in such a way that the renormalized Fermi surface at each doping is fixed to the ARPES determined Fermi surface for that doping. This is done by requiring that at each iteration of the FLEX calculation the quantity remains equal to and amounts to setting Ikeda ; suppinf
| (6) | |||||
In this way we ensure that the selfconsistent Fermi surface of the FLEX calculation is identical to the experimental one. In the following we will concentrate on the doping levels and , because tight-binding fits are available for these doping levels from Yoshida et al. For the fit parameters are , , and . For the fit parameters are , , and .Yoshida Our calculations are done in energy units of . The parameter is then determined at the end of the calculation in such a way that the nodal MDC peak position of our FLEX calculation agrees with the experimental one from Park et al. Park at meV. In this way our value of represents an unrenormalized hopping in contrast to the renormalized value of meV found by Yoshida et al.Yoshida For our numerical calculations we have chosen a moderate value of to stay in a weak coupling regime where FLEX can be assumed to give reliable results. QMC We will show results for the self-energy and spectral functions along the same momentum cuts C1-C3 as Park et al. Park , shown in Fig. 1.
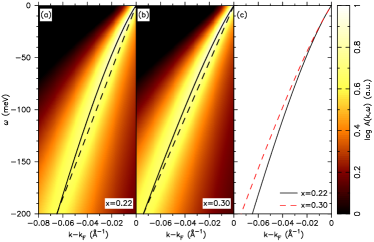
Results - The single particle spectral weights obtained from the FLEX calculation for and along the nodal C1 cut are shown in Figs. 2a and b, respectively. Here the -axis denotes energy in units of meV and the -axis the wavevector in units of inverse Angstroms. A lattice constant Å was used to set the wavevector scale. The solid curves in Figs. 2a and b show the MDC peak and the dashed line is a linear dispersion connecting the peaks at eV and eV. For , we find the bare meV while for , meV. The dispersions of the MDC peak for the two dopings are compared in Fig. 2c.
In Fig. 2 one sees that there is a kink in the dispersion of the MDC peak at approximately meV for both and 0.3. The appearance of a nodal kink in the normal state of spin-fluctuation models has been discussed by several authors before. Manske ; Chubukov ; Dahm For the FLEX approximation this feature was pointed out by Manske et al.Manske The renormalized nodal Fermi velocity obtained from the slope of the dispersion in the low energy region is 1.94 eVÅ for and 1.98 eVÅ for , consistent with the behavior of the Fermi velocity reported by Zhou et al.Zhou and also seen in Ref. Park, . This is clearly seen in Fig. 2c which shows the MDC peak dispersion for both dopings. Following Park et al. Park , we define the real part of an effective self energy Re by the -deviation of the MDC peak from the dashed line in Fig. 2. Note, that this effective low energy quantity is different from the full FLEX self energy in Eq. (1).
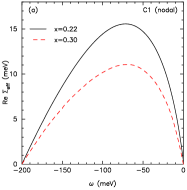
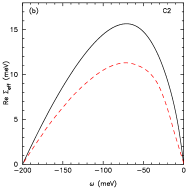
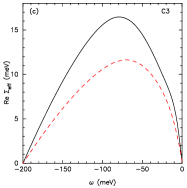
The result of this procedure is shown in Fig. 3a for the nodal C1 cut and in 3b and 3c for the C2 and C3 cuts. In each case, the solid curve shows Re for and the dashed curve for . These results can be compared with Fig. 3b-d by Park et al. The fact that Re goes to zero at -200 meV is an artifact of the analysis and reflects the choice of the empirical bare band which we took to be the same as Park et al. The effective self energy Re shows a broad peak near meV for all three cuts reflecting the kink seen in the MDC peak of , Fig. 2. The height of this peak is about half the height of the peak reported in Ref. Park, . Increasing the interaction strength will increase the peak height but takes the system into a stronger coupling regime where the FLEX calculation is less reliable. The C2 and C3 cuts (Figs. 3b and c) show a similar behavior. Overall, the results for Re shown in Fig. 3 appear similar to what is seen experimentally. In particular, the peak in Re for is reduced by about 30% from that for . Thus just as seen experimentally for the nodal momentum cut and the nearby C2 and C3 cuts, there is only a modest weakening of the peak in Re when the doping is increased from 0.22 to 0.3.
Next we examine the change in the -wave pairing strength when the doping is increased from 0.22 to 0.3. While the value of depends upon as well as the impurity scattering Kee associated with the Sr doping, the change in the -wave pairing strength
| (7) |
provides a useful measure of the effect of doping on the pairing. Here is the pairing interaction vertex
| (8) |
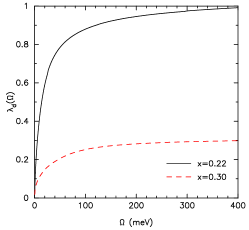
and the gap function . The averages in Eq. (7) are taken over the Fermi surface. Although the charge fluctuation contribution to the self-energy interaction changes sign in the singlet pairing vertex , the dominant term in both vertices is the spin-fluctuation interaction given by the first term in Eqs. (2) and (8). For we find that while for it is reduced to 0.35. This decrease reflects a redistribution of the spectral weight from the antiferromagnetic region of the Brillouin zone to other parts of the Brillouin zone which contribute less or even negatively to the “-wave” average in Eq. (7). Thus as the doping increases, the strength of the interaction in the anomalous self-energy -wave pairing channel can significantly decrease while the change in its contribution to the normal self-energy in the nodal region is relatively modest. In Fig. 4 we have plotted obtained by cutting off the frequency integration in Eq. (7) at . This plot shows that the contributions to come from modes with energies in a spectral range of several hundred meV.
Conclusions - A variety of ARPES studies Zhou ; Zhou2 ; Kordyuk ; Yoshida ; Park of hole doped LSCO observe a 50-80 meV kink in the near nodal MDC dispersion which is reflected as a broad peak in an effective self energy Re over an energy range of several hundred meV. However, there remains disagreement regarding the origin of this structure and its relationship to the pairing interaction. Here we have focused on recent results for overdoped LSCO, a system which is expected to be more amiable to a weak coupling analysis. In addition, this is a single layer cuprate whose Fermi surface at the dopings we have studied has been determined by ARPES. Within a FLEX approximation we have calculated the single particle spectral weight for overdoped LSCO and extracted Re in the same manner as done in the ARPES experiment. An important ingredient in this calculation was the adjustment of the bare band parameters such that the renormalized Fermi surface at a given doping was fixed to the ARPES determined Fermi surface for that doping. The results showed that the renormalized nodal Fermi velocity remained the same and the maximum value of Re decreased by 30% as the doping changed from 0.22 to 0.3, similar to what was seen experimentally. Using the same parameters, the pairing strength in the -wave channel was found to decrease from () to (). Thus we conclude that a spin-fluctuation interaction can give rise to the observed structure in Re and also exhibit a significant decrease in the -wave pairing strength as the doping increases from to 0.3. The point is that the self-energy is determined by the convolution of the interaction with the spectral weight , while the pairing strength depends on the -wave projection of the interaction. This -wave projection is more sensitive to the changes in the momentum dependence of the spin-fluctuation interaction and the Fermi surface with doping than is the self-energy. Thus we conclude that the experimental results reported by Park et al. for overdoped LSCO are consistent with a spin-fluctuation pairing mechanism operating in a spectral range of several hundred meV.
Acknowledgements.
The authors thank D. Dessau for sending them supplementary information for Ref. Park, . DJS acknowledges the support of the Center for Nanophase Materials Science at ORNL, which is sponsored by the Division of Scientific User Facilities, U.S. DOE.References
- (1) T. Valla, A. V. Fedorov, P. D. Johnson, B. O. Wells, S. L. Hulbert, Q. Li, G. D. Gu, and N. Koshizuka. Science 285, 2110 (1999).
- (2) A. Lanzara et al., Nature 412, 510 (2001).
- (3) A. Kaminski, M. Randeria, J. C. Campuzano, M. R. Norman, H. Fretwell, J. Mesot, T. Sato, T. Takahashi, and K. Kadowaki, Phys. Rev. Lett. 86, 1070 (2001).
- (4) P. D. Johnson et al., Phys. Rev. Lett. 87, 177007 (2001).
- (5) X. J. Zhou et al., Nature 423, 398 (2003).
- (6) X. J. Zhou et al., Phys. Rev. Lett. 95, 117001 (2005).
- (7) S. V. Borisenko et al., Phys. Rev. Lett. 96, 117004 (2006).
- (8) W. Meevasana et al., Phys. Rev. Lett. 96, 157003 (2006).
- (9) A. A. Kordyuk et al., Phys. Rev. Lett. 97, 017002 (2006).
- (10) T. Yoshida, X. J. Zhou, D. H. Lu, S. Komiya, Y. Ando, H. Eisaki, T. Kakehashi, S. Uchida, Z. Hussain, Z.-X. Shen, and A. Fujimori, J. Phys.: Condens. Matter 19, 125209 (2007).
- (11) Y. Peng, J. Meng, L. Zhao, Y. Liu, J. He, G. Liu, X. Dong, S. He, J. Zhang, C. Chen, Z. Xu, and X. J. Zhou, arXiv:1305.6194.
- (12) Recent progress in extracting both the normal and pairing self-energies have been reported by J.H. Yun, J. M. Bok, H.Y. Choi, W. Zhang, X. J. Zhou, C. M. Varma, Phys.Rev.B 84, 104521 (2011) and W. Zhang et al., Phys.Rev.B 85, 064514 (2012).
- (13) S R. Park, Y. Cao, Q. Wang, M. Fujita, K. Yamada, S.-K. Mo, D. S. Dessau, and D. Reznik, arXiv:1304.0505v1.
- (14) N. E. Bickers, D. J. Scalapino, and S. R. White, Phys. Rev. Lett. 62, 961 (1989).
- (15) T. Dahm and L. Tewordt, Phys. Rev. Lett. 74, 793 (1995); Phys. Rev. B 52, 1297 (1995).
- (16) H. Ikeda, R. Arita, and J. Kunes, Phys. Rev. B 81, 054502 (2010).
- (17) See also the supplementary information of Ref. Dahm, .
- (18) For a comparison of FLEX with Quantum Monte Carlo simulations see N. E. Bickers and S. R. White, Phys. Rev. B 43, 8044 (1991) and N. Bulut, Adv. Phys. 51, 1587 (2002).
- (19) D. Manske, I. Eremin and K. H. Bennemann, Phys. Rev. Lett. 87, 177005 (2001).
- (20) A. V. Chubukov and M. R. Norman, Phys. Rev. B 70, 174505 (2004).
- (21) T. Dahm, V. Hinkov, S. V. Borisenko, A. A. Kordyuk, V. B. Zabolotnyy, J. Fink, B. Büchner, W. Hanke, D. J. Scalapino, and B. Keimer, Nature Phys. 5, 217 (2009).
- (22) H.-Y. Kee, Phys. Rev. B 64, 012506 (2001).