Anisotropic dielectronic resonances from ratios of magnetic-dipole lines
Abstract
Signatures of multi-keV dielectronic resonances in highly-charged ions of tungsten were detected in the intensity ratios of extreme-ultraviolet magnetic-dipole lines within ground configurations. The measurements were performed with an electron beam ion trap at beam energies of about 6 keV. Large-scale collisional-radiative modeling incorporating magnetic sublevels of autoionizing levels showed the significance of anisotropy effects due to the monodirectional propagation of the electron beam. The observation method allows simultaneous resolved registration of dielectronic resonances from several ions.
pacs:
32.30.-r,32.80.Zb,34.50.FaI Introduction
Dielectronic recombination (DR) Burgess ; GriemBook ; Kunze is one of the important processes affecting ionization balance and related parameters (e.g., radiative power losses) of plasmas involving highly-charged ions (HCI). DR is a two-step process involving dielectronic capture (DC), that is, excitation of the atomic electron with simultaneous capture of the incident electron, and radiative stabilization of autoionizing states produced during DC. Although a particular resonant state can only be produced with an electron of specific energy, a Maxwellian plasma has electrons of all energies and thus the DR rate is never zero for thermal plasmas. Due to a weak dependence of the DC rates on the ion charge and strong dependence of the radiative rates, radiative stabilization is more probable for highly-ionized atoms. That is why DR is often the most dominant recombination mechanism for HCI plasmas, especially at low densities. In addition to its effect on the ionization distribution, DR frequently results in the appearance of strong satellite lines that may serve as reliable diagnostics of plasma properties.
Dielectronic resonance states have been extensively studied with storage rings Schi11 ; Muller09 ; Orban09 , electron beam ion traps (EBITs) Knapp89 ; Knapp91 ; DeWitt92 ; Ba3d ; Naka06 ; Beilmann2010 , tokamaks Urnov07 ; Bitter03 , and other devices Laser12 . The DR measurements with EBITs are primarily based on two techniques. One method utilizes extraction of ions at different beam energies and analysis of their abundances Ali91 ; DeWitt92 ; Naka06 . It is not unusual, however, that the measured ionization distributions differ from the originally produced abundances inside the trap, and thus additional corrections may be required Zhang2010 . Another method is based on EBIT beam ramping Knapp89 . In this case, a relatively high beam energy, higher than the ionization potential of a specific ion, is used to make the ion under study as abundant as possible. This energy is typically much higher than the energy required to produce outer-shell dielectronic resonances. Then the beam energy is quickly changed to a lower value (or series of values) and data is collected before the ionization balance has time to change substantially. The beam energy is then restored to its initial value and held there for a relatively long time in order to restore the initial charge balance. This process is repeated over many duty cycles in order to integrate the signal acquired during the brief parts of the cycle that the beam is at the low energies.
Elementary energy balance considerations show that the dielectronic resonances due to excitation of the outer-shell electrons cannot be produced with the beam energy larger than the ionization energy of the ion. It is possible, however, to create resonances due to excitation of inner-shell electrons. For instance, in Ref. Ba3d the LMM resonances (i.e., inner L electron excited into the M shell with the free electron captured into the M shell) were identified and analyzed in the x-ray spectra from the Ba ions with an open shell, Ba34+ and Ba35+. Note that the ionization potentials of Ba34+ and Ba35+ are 2142 eV and 2256 eV, respectively ASD , while the beam energies were about 2400 eV. Good agreement was found between theory and experiment for the ratios of DR to radiative recombination cross sections.
In this paper we report in situ measurements and analysis of the dielectronic resonances in about 50-times ionized atoms of tungsten with an open shell. Tungsten is currently a leading candidate for the plasma-facing material in the divertor region of ITER Hawryluk09 , and therefore its spectroscopic properties are being actively studied in many laboratories KramidaW . While theoretical papers on DR of tungsten are numerous (see, e.g., SafW1 ; LiW ; SafW2 ; ShenW ; BeharW and references therein), the experimental data are rather scarce. Over the last decade, dielectronic resonances in tungsten were measured in I-like W19+ Schi11 and in Si-like to N-like ions Bie09 . The latter paper reported only the unresolved overlapping ( = 3 to 10) resonances measured in the x-ray range.
Under typical steady-state EBIT conditions, the balance between the neighbor ion stages is determined by the corresponding ionization and recombination processes:
| (1) |
where and are the total populations of the ions with charges and +1, and ’s are the total rates for radiative recombination (rr), charge exchange (cx) with the neutrals in the trap, dielectronic recombination (dr), and ionization (ion). Equation (1) assumes that multi-electron processes are negligible. For highly-charged high-Z ions the double charge exchange (CX) may actually not be much weaker than the single-electron process; however, the lack of data on double CX in approximately 50-times ionized atoms prevents one from taking it into account.
Since DR is a resonant process, is typically zero for a nearly monoenergetic EBIT beam. However, when the beam energy overlaps with the resonant energies, and the ionization balance may change drastically. Here we propose to measure multi-keV inner-shell dielectronic resonances from low-energy spectroscopic footprints of the changing ionization balance in the EBIT. To demonstrate this, we use the intensity ratios of forbidden magnetic-dipole (M1) lines from the ground configurations of neighbor ions. Several dozen M1 lines from all ions of tungsten were recently identified in the extreme ultraviolet (EUV) range from 10 nm to 20 nm M1 . It was also found that many of those well-resolved lines have a rich diagnostic potential for applications in fusion plasmas. Moreover, we found that the low-lying M1 levels within the ground configurations are primarily populated by the radiative cascades following excitation from the lowest ground level. Since in low-density plasmas (including EBITs) almost all ion population is in its ground state, the M1 line intensities are in effect proportional to the total ion populations. Accordingly, their ratio is expected to be sensitive to modifications of the ionization balance. This new method to detect dielectronic resonances with the M1 line ratios is described below.
II Experiment
The EBIT at the National Institute of Standards and Technology (NIST) Gillaspy_1997 was used to produce and trap highly charged ions of tungsten. The low charge ions were injected into the trap using a metal vapor vacuum arc (MEVVA) MEVVA , and then ionized to the required degree. The beam energies in the present experiment varied between approximately 5500 eV and 6400 eV, and the beam current was 100 mA.
The EUV spectra from tungsten ions were recorded with a flat-field grazing-incidence spectrometer that has been described elsewhere Blagojevic_2005 . A gold-coated concave grating with variable spaced grooves was used in combination with a liquid-nitrogen-cooled back-illuminated charge-coupled device (CCD) array having a matrix of 2048 512 pixels. The tungsten emission was recorded between 10 nm and 20 nm with a resolving power of approximately 350. As in our previous measurements M1 , this resolution was sufficient to identify most of the observed lines. Each spectrum consisted of 10 one-minute exposures, and spurious signals from cosmic rays were removed.
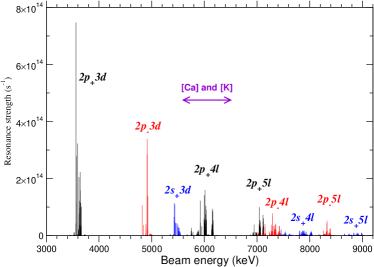
One of the measured spectra between 14 nm and 20 nm at the nominal beam energy = 6057 eV is shown in Fig. 1. The strongest lines of the W ions are the 15.962-nm line in K-like ion, the 14.959-nm and 17.080-nm lines in Ca-like ion, the 17.216-nm and 18.867-nm lines in Sc-like , and the 19.319-nm and 19.445-nm lines in Ti-like ion M1 . Each line in the measured spectra was fit with a Gaussian function and a constant background, and the derived intensities (areas) were used to obtain the line intensity ratios. Since it is the line intensities rather than wavelengths that are of interest in the present work, even an approximate calibration of the measured spectra that provides a one-to-one correspondence with the known wavelengths is sufficient here.

III Modeling
As mentioned above, the dielectronic resonances are produced when the electron (, , or in relativistic notation) is excited into the shell and a free electron is captured into an atomic shell with the principal quantum number . The value of under EBIT conditions can be estimated in the limit of a very high ion charge when atomic structure becomes quasi-hydrogenic. In units of (+1)2Ry (Ry 13.6057 eV is the Rydberg constant), the energy difference between =2 and =3 is 5/36, and the ionization potential for the =3 shell is IP3=1/9. Numerous EBIT studies show that the beam energy required to make a specific ion abundant is on the order or higher than its ionization potential. Therefore, if a free electron has the energy of approximately IP3, then during dielectronic capture for - excitation it plunges 1/36(=5/36-1/9) below the ionization potential, that is, into =6. Certainly, the energy structure for a 50+-times ionized atom of tungsten cannot be well described by the exact hydrogenic formulas and the electron energy is normally larger than the ionization potential but the above estimate of is quite close to reality, as will be seen below.
One of the widely used parameters representing the contribution of a particular dielectronic resonance to DR is the dielectronic resonance strength defined here as
| (2) |
where is the statistical weight of the doubly excited state in the recombined ion , is the statistical weight of the initial state in the recombining ion , is the autoionization rate from to state , and is the radiative rate from to state . The summation indices and enumerate states in the recombined and recombining ions, respectively. Note that the summation index in Eq. (2) extends over both autoionizing and non-autoionizing states. It is customary to exclude the latter from the sum in the numerator, however, for highly-charged high-Z ions the radiative rates become stronger than the autoionization rates. Therefore radiative transitions between autoionizing states would likely result in decays into non-autoionizing states and provide additional contribution to the total dielectronic recombination. Therefore we retain the autoionizing states in the -summation in the numerator. Then, in the general case, more than one state in the recombining ion may contribute to dielectronic capture into a state . However, due to the relatively strong M1 transitions in highly-charged high-Z ions the populations of the lowest excited states of are much smaller than that of the ground level, and therefore we neglect their contribution to in Eq.(2). Finally, it should be mentioned that the resonance strength only approximately shows how much a specific doubly excited state contributes to dielectronic recombination; the accurate answer can only be obtained with a detailed collisional-radiative (CR) modeling PFR which is provided below.
Large-scale CR modeling requires the generation of extensive sets of atomic data, such as energy levels, radiative and autoionization rates, and electron-impact cross sections. The data used in the present work were calculated with the relativistic-model-potential Flexible Atomic Code (FAC) FAC . This code is widely used for highly-charged high-Z ions, and its accuracy has proven to be sufficient for such atomic systems. The calculated (=3–5) resonance strengths (Eq. (2))for dielectronic capture from the K-like ion of tungsten into the Ca-like ion are presented in Fig. 2 as a function of . The resonances corresponding to different excitations from the =2 shell are given in different colors: black for (often denoted as ), red for (), and blue for (). Figure 2 shows that the energy difference between the subshells of =2 is non-negligible, so that 1 keV and 2 keV. This deviation from the quasi-hydrogenic approximation should certainly modify the 6 estimate. Then, in addition to the well-known decrease of resonance strengths with , one can notice that the lowest resonances do not overlap and thus their contribution to DR can be pinpointed with the narrow spread of energies in the EBIT beam. Finally, and most importantly, the range of the beam energies, where both K-like and Ca-like ions are observed to be most abundant M1 (horizontal arrow in Fig. 2), overlaps with the resonances at approximately 6 keV. Hence, one can expect that the measurements of ionization balance between the K-like and Ca-like ions near 6 keV should indicate presence of such dielectronic resonances.
The CR modeling used here differs from the approach implemented in our previous papers on ions M1 ; M1Hf where only singly- and doubly-excited states below the first ionization potential were included. Since L3/2MN dielectronic recombination is the primary subject of this study, all autoionizing states and are added to the model. In the absence of two-electron processes, the ionization balance is determined only by ionization and recombination between two ion states, and therefore the CR model included only Ca-like and K-like ions of tungsten. Even within a two-ion model the total number of fine-structure levels was about 10,500 since in addition to approximately 1300 autoionizing states in the Ca-like ion one has to account for all possible autoionization channels.
The electron-impact collisional data were calculated with FAC and fit using simple formulas with the correct asymptotic behavior, and a database was created for simulations with the non-Maxwellian code NOMAD NOMAD . Unlike the previous studies on M1 lines M1 ; M1Hf , we do not group the atomic levels with high principal quantum number 4 into “superterms”; this is done to provide the most accurate representation of all processes affecting the observed line emission and populations of autoionizing states.
Generally, CR simulations for EBITs may utilize a number of free parameters that can be fixed using the experimental data. Thus, the unknown CX rate was deduced from the spectra measured at non-resonant beam energies (6400 eV) and then used in calculations for all other energies. This fit procedure partially takes into account the higher-order CX processes. The beam electron energy distribution function (EEDF) was taken to be a Gaussian with full width at half-maximum of 50 eV which sets the energy resolution. It is not uncommon in EBIT modeling to use a rectangular EEDF for spectra simulations due to the smooth energy dependence of collisional cross sections. However, for the present analysis a Gaussian beam provides a better agreement with the observed shapes of spectral features. Finally, the effective beam energy that is seen by ions in the trap is known to be smaller than the nominal value due to space charge effects. Accordingly, the beam energies in the following discussion and figures are reduced by 100 eV from their nominal values to match the calculated positions of resonances.
IV Comparisons and discussion
The measured intensity ratio of the 17.080-nm line in Ca-like W54+ and the 15.962-nm line in K-like W55+ is shown in Fig. 3(top). The vertical error bars correspond to the expanded uncertainty at the level of confidence of 95 % and are derived from the uncertainties of Gaussian fits of the measured line profiles using the coverage factor of =2 NISTGuide ; Guide . Simultaneous with our measurements in W, a small amount of argon was continuously introduced into the EBIT through the EUV spectrometer and used to monitor changes in the absolute value of the electron beam energy through the position of the x-ray radiative recombination (RR) line into the ground state of H-like argon. These measurements were performed with a wide-band high-purity Ge solid-state detector. With the exception of a few energies (which may have involved line blends) the position of the RR line varied linearly with the nominal electron beam energy, with a standard deviation of 11 eV, consistent with statistical uncertainties in the fits to the RR line centers. The error bars in the horizontal direction (beam energy) in the plots of the present manuscript are taken to be 22 eV (i.e., =2). Using the data at a nominal beam energy of 5.815 keV, we used the absolute value of the RR line center and the known value of the ionization energy of He-like Argon to infer (11914) eV (at the level of 1) for the space charge correction to the beam energy, in good agreement with the value of 100 eV obtained from the EUV line ratios.
Without dielectronic resonances, the experimental Ca/K line ratio should be monotonically decreasing with . This dependence is confirmed by the CR calculation that excluded autoionizing states (dotted line in Fig. 3(top)). The measured line ratio, however, clearly shows presence of resonant features, with the strongest ones near 6020 eV and 6160 eV. The origin of these peaks is clarified in the bottom panel of Fig. 3 which is the enlarged part of Fig. 2 representing different channels. The strongest measured peaks are seen to correspond to the highest- channels, and . The contribution from near 5880 eV is visibly smaller, and the weakest resonances were missed on the experimental grid.

The non-Maxwellian CR modeling with autoionizing states for the Ca/K line ratios was performed at several levels of complexity. The dot-dashed line in Fig. 3(top) presents the 17.080/15.962 line ratio calculated with the model that included resonant states as J-resolved atomic levels. Here the DC rates were obtained from the corresponding autoionization rates by integration of DC cross sections over the beam EEDF. This approach is equivalent to the assumption of isotropic collisions without any account of the monodirectional nature of the EBIT beam. Whereas the dot-dashed curve in Fig. 3(top) reproduces the relative intensities of the resonances reasonably well, it overestimates their magnitudes. This discrepancy may result from the anisotropic nature of beam propagation and the ensuing effect on the DC rates. Due to the conservation of the angular momentum projection, not all magnetic sublevels of the final recombined state can be populated via dielectronic capture with monodirectional electrons. Accordingly, the net DC/DR rates are expected to become smaller and thus reduce the disagreement between modeling and measurements.
The polarization effects in spectral line emission due to anisotropic excitation and/or dielectronic capture by monodirectional beam electrons are a subject of continuing interest (see, e.g., PhysRevA.54.1342 ; PhysRevA.74.022713 ; Hakel ; GillApJ ; ORourke ; Matula ). To include the anisotropic effects, one can develop an extensive CR model resolved in magnetic sublevels for autoionizing states; this model will be described below. Another approach to this problem can be based on the introduction of effective corrections that account for non-statistical populations of the magnetic sublevels. Such corrections can be developed in several ways; here we use the following multiplicative modification factors for all autoionization rates and DC cross sections:
| (3) |
where is the total autoionization rate for the state with the total angular momentum , is its total radiative rate, is the isotropic DC cross section from the next ground state into (calculated from using the detailed balance principle), is the DC cross section from the next ground state into the sublevel with the magnetic quantum number , and is the total autonization rate from the same sublevel. This correction can be justified as follows. The states that contribute most to DR are those with large radiative transition probabilities . In this case, the population kinetics of the autoionizing states becomes similar to the coronal model where a level is populated only by excitations (dielectronic capture in our case) and depopulated only via radiative decay. The spectral line intensity for coronal condition does not depend on the radiative rate and is determined by the excitation rate only. Reformulating this for the present case, the contribution of a particular strong dielectronic resonance to dielectronic recombination does not depend on the radiative stabilization rate but rather on the dielectronic capture rate only. For such resonances, the correction becomes simply the ratio . This multiplicative factor applied to both autoionization rates and DC rates effectively modifies only the latter ( is too small to compete with ) and is expected to bring the total DR rate closer to the magnetic-sublevel-resolved model results. Note also that correction (3) implies that the population of the recombining ground state is much larger than the populations of other excited states which, as mentioned above, is a good aproximation for the present experiment.
The FAC code allows calculation of DC cross sections into and autoionization rates from the states, and such a calculation was performed here. The result of the “effective” CR calculation with the factors is presented by the dashed curve in Fig. 3(top). The agreement with the measured line ratios is seen to improve, especially for the resonances and the resonances near 5900 eV.
The most extensive CR model implemented in the present work splits all 1314 autoionizing levels and into magnetic sublevels, bringing the total number of such states to 9360, and the total number of all states for a two-ion CR model to more than 18,000. All possible radiative, autoionization and dielectronic capture rates connecting the -states were calculated with FAC and used in NOMAD simulations. The 17.080/15.962 line ratio calculated with this complete model is presented by the thick solid line in Fig. 3(top). The “complete” and “effective” models show a comparable level of agreement for and resonances, but for the strongest resonances near 6020 eV the complete model is closer to the measured data. These simulations give a strong indication that anisotropic effects in EBITs are important for analysis of dielectronic recombination. In particular, this shows that the DR/DC cross sections measured in EBITs cannot be treated as the isotropic cross sections.
A natural question arises whether monodirectional propagation of the beam electrons should affect not only dielectronic resonances but also the M1 lines and their ratios. The important difference between the autoionizing states and the low excited levels is that the former are populated due to direct interaction of beam electrons with an ion while the latter are populated due to radiative cascades from the excited higher states. While excitations from the ground state are generally polarization-sensitive, the radiative cascades smear out polarization signatures for the lowest levels. This was explicitly shown in the recent study of electric-quadrupole and magnetic-octupole lines in Ni-like W46+ PhysRevA.81.012505 .
A significant advantage of the experimental method presented here consists in its ability to provide simultaneous resolved measurements of dielectronic resonances from several ions. Even for the modest resolution spectrometer used here, the magnetic-dipole lines from different ions are normally well separated in an EUV spectrum, as exemplified in Fig. 1 (see also Ref. M1 ; M1Hf ), and therefore line ratios for several ion pairs can be reliably determined from a single EBIT run. Such analysis was performed here as well, and Fig. 4 shows the measured ratios for the three pairs of ions, i.e., Ca-like to K-like (top), Sc-like to Ca-like (middle), and Ti-like to Sc-like (bottom). The 17.080/15.962 ratio (same as in Fig. 3) and 18.867/17.080 ratio in the top and middle panels, respectively, are shifted upward by one and two units, rspectively, for a better visibility. While two other lines, at 17.216 nm in the Sc-like ion and at 19.445 nm in the Ti-like ion, look strong in Fig. 1, we did not use them in this analysis as both are blended by impurity lines that affect their intensities.
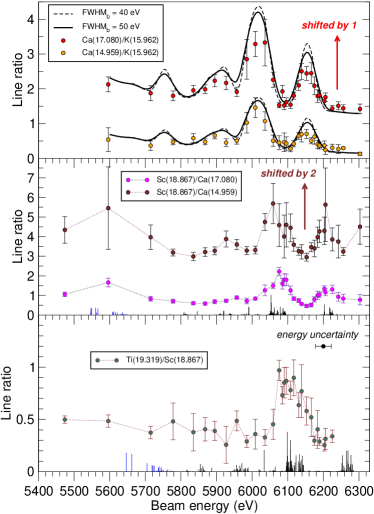
Figure 4(top) shows the experimental 14.959/15.962 Ca/K ratio and the “complete” anisotropic simulation with the beam FWHM of 50 eV (solid line). This calculation does not include any free parameters that have not already been fixed in simulation of the 17.080/15.962 ratio. For the 14.959/15.962 ratio, the agreement between theory and measurements is quite good over the whole range of energies although for both ratios our simulations slightly overestimate the DR contribution for the resonances at 6150 eV. In addition to the 50-eV-FWHM calculation, we present the 40-eV-FWHM results (dashed curve) as well. The difference between the two theoretical simulations is not very significant, however smaller or larger values of the EBIT beam width were found to be in worse agreement with the measurements. Obviously, detailed measurements of DR resonances, especially isolated ones such as the resonance at 5925 eV in Fig. 3, can be used to determine the beam width more accurately.
The available computational facilities did not allow us to perform a full-scale collisional-radiative modeling for the Sc/Ca or Ti/Sc line ratios, similar to the results presented for the Ca/K ratios. The total number of levels in a CR model rapidly increases with the number of electrons in the ground configuration . Therefore, in the middle and bottom panels of Fig. 4 we only present the calculated relative dielectronic resonance strengths which are shown by the blue ( inner electron excitation, resonances) and black ( inner electron excitation, resonances) vertical lines. This comparison shows that for the and ions of tungsten both positions and strengths of the resonances are calculated as accurately as for the Ca-like ion (Figs. 2 and 3).
The measured line ratios indicate that the beam energy required to produce a particular resonance decreases with the increase of the ion charge . As is seen in Fig. 4, the energy of the strongest peak due to resonances is 6020 eV for Ca-like W54+, about 6070 eV for Sc-like W53+, and 6100 eV for Ti-like W52+. Similar dependences on are also visible for the weaker peak. Such behavior would seem to contradict the well-known increase of atomic energies with . The explanation can be derived from a simple analysis of energy balance. The resonant beam energy is equal to the difference between the excitation energy from n= to n= and the ionization energy IP4 of the subshell. Since excitation involves a deeply screened electron, varies with much less than IP4 which approximately increases as . These dependences are confirmed by our FAC calculations along isoelectronic sequences. As a result, the resonant beam energies for the resonances in ions of tungsten weakly decrease with the ion charge.
Among the possible radiative stabilizing channels for the autoionizing states, the strongest ones are due to electric-dipole transitions into the hole, that is, - (referred to below as A) with = or , - (B), and - (C). These transitions result in emission of photons with the energies of about 11 keV, 8.8 keV, and 7.8 keV, respectively. To record these x-rays, we used the high-purity Ge solid state detector. The measured spectrum presented in Fig. 5 unambiguously reveals the three radiative channels A, B, and C for the electron beam energies between 5.7 keV and 6.3 keV. Note that there is a background of radiative recombination with some RR channels visible as weak diagonal bands. Unlike the EUV line ratios that are resolved for individual ions, the stabilizing x-ray photons may simultaneously originate from several ions that are abundant at a specific beam energy. For instance, as can be seen from Fig. 4, dielectronic resonances can be produced for both Ca-like and Ti-like ions at the beam energy of 6140 eV. Since our present CR model is restricted only to two ions, it is not currently possible to accurately analyze the observed x-ray emission. Yet some characteristics of the measured spectrum confirm our identifications. For instance, the B transitions extend to the beam energies higher than 6.1 keV while there are no A transitions in that region. This agrees with the preferential population of the subshell at highest energies as electrons cannot decay into via electric-dipole transitions.
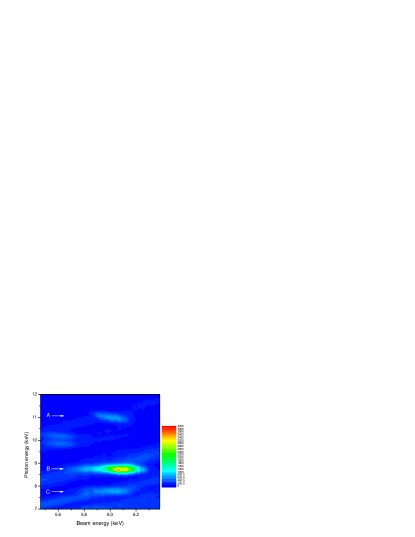
We mentioned above that the energies of the - inner-shell transitions (channels B and C) are almost independent of the ion charge. Indeed, the measured central energies for the B and C features in Fig. 5 do not visibly change with the beam energy although the ion populations vary significantly. The changing central energy of the - spectral group A is, however, clearly discernible as confirmed by the Gaussian fits of this feature. One can see that the lowest-energy - x-ray photons (from lower- ions) appear at higher beam energy and vice versa. This agrees with the above discussed -dependence of the resonant beam energy and the movement of the - peak (see Fig. 4).
V Conclusions
In this work we proposed a new in situ method of measuring the dielectronic resonances in ions of heavy elements through intensity ratios of magnetic-dipole lines within ground configurations. Such resonances were experimentally observed for Ca-, Sc-, and Ti-like ions of tungsten in an electron beam ion trap with beam energies of about 6 keV. In addition to the EUV spectra, x-ray photons due to the radiative stabilization phase of dielectronic recombination were recorded using a high-purity Ge detector. A detailed non-Maxwellian collisional-radiative model was developed to simulate the observed line intensity ratios. It was shown that the isotropic CR simulations overestimate the effect of DR on the measured line ratios. We proposed effective corrections to account for non-statistical populations of magnetic sublevels of autoionizing states and also developed a complete magnetic-sublevel-resolved CR model. Both new models were found to improve agreement with the measured line ratios thereby pointing out the importance of anisotropic effects for dielectronic recombination in EBITs. The remaining difference between the simulations and experiment may stem from imperfection of atomic data, incompleteness of the CR model, or for instance multi-electron processes. These issues should be addressed in future works. It is rather safe to claim, however, that the measured line ratios offer benchmark data for both atomic structure theories and advanced non-Maxwellian models of plasma emission.
Acknowledgements.
Supported in part by the Office of Fusion Energy Sciences of the U.S. Department of Energy. We are grateful to J.J. Curry for assitance during the experimental run and to D. Osin, A. Kramida, Y. Podpaly, J. Reader, and J.N. Tan for valuable discussions.References
- (1) A. Burgess, Ap. J. 136, 776 (1964)
- (2) H. R. Griem, Principles of Plasma Spectroscopy (Cambridge University Press, 1997)
- (3) H.-J. Kunze, Introduction to plasma spectroscopy (Springer-Verlag, 2009)
- (4) S. Schippers, D. Bernhardt, A. Müller, C. Krantz, M. Grieser, R. Repnow, A. Wolf, M. Lestinsky, M. Hahn, O. Novotný, and D. W. Savin, Phys. Rev. A 83, 012711 (2011)
- (5) A. Müller, Eur. Phys. J. ST 169, 35 (2009)
- (6) I. Orban, Z. Altun, A. Kallberg, A. Simonsson, G. Andler, A. Paal, M. Blom, P. Lofgren, S. Trotsenko, S. Bohm, and R. Schuch, Astr. Astrophys. 498, 909 (2009)
- (7) D. A. Knapp, R. E. Marrs, M. A. Levine, C. L. Bennett, M. H. Chen, J. R. Henderson, M. B. Schneider, and J. H. Scofield, Phys. Rev. Lett. 62, 2104 (1989)
- (8) D. A. Knapp, Zeit. für Phys. D 21, S143 (1991)
- (9) D. R. DeWitt, D. Schneider, M. H. Chen, M. W. Clark, J. W. McDonald, and M. B. Schneider, Phys. Rev. Lett. 68, 1694 (1992)
- (10) D. J. McLaughlin, Y. Hahn, E. Takaćs, E. S. Meyer, and J. D. Gillaspy, Phys. Rev. A 54, 2040 (1996)
- (11) N. Nakamura, H. Tobiyama, H. Nohara, D. Kato, H. Watanabe, F. J. Currell, and S. Ohtani, Phys. Rev. A 73, 020705(R) (2006)
- (12) C. Beilmann, J. R. C. Lopez-Urrutia, P. H. Mokler, and J. Ullrich, J. Instr. 5, C09002 (2010)
- (13) A. M. Urnov, F. F. Goryaev, G. Bertschinger, H.-J. Kunze, and O. Marchuk, JETP Lett. 85, 374 (2007)
- (14) M. Bitter, M. F. Gu, L. A. Vainshtein, P. Beiersdorfer, G. Bertschinger, O. Marchuk, R. Bell, B. LeBlanc, K. W. Hill, D. Johnson, and L. Roquemore, Phys. Rev. Lett. 91, 265001 (2003)
- (15) B. Li, T. Higashiguchi, T. Otsuka, W. Jiang, A. Endo, P. Dunne, and G. O’Sullivan, J. Phys. B 45, 245004 (2012)
- (16) R. Ali, C. P. Bhalla, C. L. Cocke, M. Schulz, and M. Stockli, Phys. Rev. A 44, 223 (1991)
- (17) W. Zhang, K. Yao, Y. Yang, C. Chen, R. Hutton, and Y. Zou, Phys. Rev. A 82, 020702 (2010)
- (18) A. E. Kramida, Yu. Ralchenko, J. Reader, and NIST ASD Team, NIST Atomic Spectra Database, v.5.0(2011), http://physics.nist.gov/asd
- (19) R. J. Hawryluk, D. Campbell, G. Janeschitz, P. Thomas, R. Albanese, R. Ambrosino, C. Bachmann, L. Baylor, M. Becoulet, I. Benfatto, J. Bialek, A. Boozer, A. Brooks, R. Budny, T. Casper, M. Cavinato, J.-J. Cordier, V. Chuyanov, E. Doyle, T. Evans, G. Federici, M. Fenstermacher, H. Fujieda, K. G’al, A. Garofalo, L. Garzotti, D. Gates, Y. Gribov, P. Heitzenroeder, T. Hender, N. Holtkamp, D. Humphreys, I. Hutchinson, K. Ioki, J. Johner, G. Johnson, Y. Kamada, A. Kavin, C. Kessel, R. Khayrutdinov, G. Kramer, A. Kukushkin, K. Lackner, I. Landman, P. Lang, Y. Liang, J. Linke, B. Lipschultz, A. Loarte, G. Loesser, C. Lowry, T. Luce, V. Lukash, S. Maruyama, M. Mattei, J. Menard, M. Merola, A. Mineev, N. Mitchell, E. Nardon, R. Nazikian, B. Nelson, C. Neumeyer, J.-K. Park, R. Pearce, R. Pitts, A. Polevoi, A. Portone, M. Okabayashi, P. Rebut, V. Riccardo, J. Roth, S. Sabbagh, G. Saibene, G. Sannazzaro, M. Schaffer, M. Shimada, A. Sen, A. Sips, C. Skinner, P. Snyder, R. Stambaugh, E. Strait, M. Sugihara, E. Tsitrone, J. Urano, M. Valovic, M. Wade, J. Wesley, R. White, D. Whyte, S. Wu, M. Wykes, and L. Zakharov, Nucl. Fusion 49, 065012 (2009)
- (20) A. Kramida, Can. J. Phys. 89, 551 (2011)
- (21) U. I. Safronova, A. S. Safronova, and P. Beiersdorfer, Phys. Rev. A 86, 042510 (2012)
- (22) B. W. Li, G. O’Sullivan, Y. B. Fu, and C. Z. Dong, Phys. Rev. A 85, 052706 (2012)
- (23) U. I. Safronova, A. S. Safronova, and P. Beiersdorfer, J. Phys. B 45, 085001 (2012)
- (24) T. Shen, C. Chen, Y. Wang, Y. Zou, and M. Gu, J. Phys. B 40, 3075 (2007)
- (25) E. Behar, P. Mandelbaum, and J. Schwob, Eur. Phys. J. D 7, 157 (1999)
- (26) C. Biedermann, R. Radtke, R. Seidel, and E. Behar, Journal of Physics: Conference Series 163, 012034 (2009)
- (27) Yu. Ralchenko, I. N. Draganić, D. Osin, J. D. Gillaspy, and J. Reader, Phys. Rev. A 83, 032517 (2011)
- (28) J. D. Gillaspy, Phys. Scr. T71, 99 (1997)
- (29) G. E. Holland, C. N. Boyer, J. F. Seely, J. N. Tan, J. M. Pomeroy, and J. D. Gillaspy, Rev. Sci. Instrum. 76, 073304 (2005)
- (30) B. Blagojevic, E. O. L. Bigot, K. Fahy, A. Aguilar, K. Makonyi, E. Takaćs, J. N. Tan, J. M. Pomeroy, J. H. Burnett, J. D. Gillaspy, and J. R. Roberts, Rev. Sci. Instrum. 76, 083102 (2005)
- (31) Yu. Ralchenko, Plasma and Fusion Research 8, 2503024 (2013)
- (32) M. F. Gu, Can. J. Phys 86, 675 (2007)
- (33) D. Osin, J. D. Gillaspy, J. Reader, and Yu. Ralchenko, Eur. J. Phys. D 66, 286 (2012)
- (34) Yu. Ralchenko and Y. Maron, J. Quant. Spectr. Rad. Transfer 71, 609 (2001)
- (35) B. Taylor and C. Kuyatt, Guidelines for Evaluating and Expressing the Uncertainty of NIST Measurement Results (NIST Technical Note 1297, 1994) http://www.nist.gov/pml/pubs/tn1297/index.cfm
- (36) BIPM IEC IFCC ILAC ISO IUPAC IUPAP OIML, Guide to the Expression of Uncertainty in Measurement (2008) http://www.bipm.org/utils/common/documents/jcgm/JCGM_100_2008_E.pdf
- (37) E. Takács, E. S. Meyer, J. D. Gillaspy, J. R. Roberts, C. T. Chantler, L. T. Hudson, R. D. Deslattes, C. M. Brown, J. M. Laming, J. Dubau, and M. K. Inal, Phys. Rev. A 54, 1342 (1996)
- (38) D. L. Robbins, P. Beiersdorfer, A. Y. Faenov, T. A. Pikuz, D. B. Thorn, H. Chen, K. J. Reed, A. J. Smith, K. R. Boyce, G. V. Brown, R. L. Kelley, C. A. Kilbourne, and F. S. Porter, Phys. Rev. A 74, 022713 (2006)
- (39) P. Hakel, R. C. Mancini, and Y. Sentoku, in Atomic Processes in Plasmas, AIP Conference Proceedings, Vol. 1161, edited by K. Fournier (2009) pp. 179–199, 16th International Conference on Atomic Processes in Plasmas, Monterey, CA, Mar 22-26, 2009
- (40) J. D. Gillaspy, T. Lin, L. Tedesco, J. N. Tan, J. M. Pomeroy, J. M. Laming, N. Brickhouse, G. X. Chen, and E. Silver, Astrophys. J. 728, 132 (2011)
- (41) B. E. O’Rourke, F. J. Currell, H. Kuramoto, S. Ohtani, H. Watanabe, Y. M. Li, T. Tawara, and X. M. Tong, Phys. Rev. A 77, 062709 (2008)
- (42) O. Matula, S. Fritzsche, and A. Surzhykov, J. Phys. B 45, 215004 (2012)
- (43) J. Clementson, P. Beiersdorfer, and M. F. Gu, Phys. Rev. A 81, 012505 (2010)