Evolution of Thermally Pulsing Asymptotic Giant Branch Stars II. Dust production at varying metallicity
Abstract
We present the dust ejecta of the new stellar models for the Thermally Pulsing Asymptotic Giant Branch (TP-AGB) phase computed with the COLIBRI code. We use a formalism of dust growth coupled with a stationary wind for both M and C-stars. In the original version of this formalism, the most efficient destruction process of silicate dust in M-giants is chemisputtering by H2 molecules. For these stars we find that dust grains can only form at relatively large radial distances (), where they cannot be efficiently accelerated, in agreement with other investigations. In the light of recent laboratory results, we also consider the alternative case that the condensation temperature of silicates is determined only by the competition between growth and free evaporation processes (i.e. no chemisputtering). With this latter approach we obtain dust condensation temperatures that are significantly higher (up to 1400 K) than those found when chemisputtering is included (900 K), and in better agreement with condensation experiments. As a consequence, silicate grains can remain stable in inner regions of the circumstellar envelopes (), where they can rapidly grow and can be efficiently accelerated. With this modification, our models nicely reproduce the observed trend between terminal velocities and mass loss rates of Galactic M-giants.
For C-stars the formalism is based on the homogeneous growth scheme where the key role is played by the carbon over oxygen excess. The models reproduce fairly well the terminal velocities of Galactic stars and there is no need to invoke changes in the standard assumptions. At decreasing metallicity the carbon excess becomes more pronounced and the efficiency of dust formation increases. This trend could be in tension with recent observational evidence in favour of a decreasing efficiency, at decreasing metallicity. If confirmed by more observational data, it would indicate that either the amount of the carbon excess, determined by the complex interplay between mass loss, third dredge-up and hot bottom burning, or the homogeneous growth scheme should be revised. Finally, we analyze the differences in the total dust production of M-stars that arise from the use of the two approaches (i.e. with or without chemisputtering). We find that, in spite of the differences in the expected dust stratification, for a given set of TP-AGB models, the ejecta are only weakly sensitive to the specific assumption. This work also shows that the properties of TP-AGB circumstellar envelopes are important diagnostic tools that may be profitably added to the traditional calibrators for setting further constraints on this complex phase of stellar evolution.
keywords:
stars: AGB and post-AGB - stars: mass loss - stars: winds, outflows - circumstellar matter - dust, extinction1 Introduction
During the Asymptotic Giant Branch (AGB) phase, stars with initial masses in the range M⊙ lose their envelopes at typical rates between 10-8 M⊙yr-1 and few 10-5 M⊙yr-1, polluting the Interstellar Medium (ISM) with metals, partially condensed into dust. Direct estimates of the amount of AGB dust and its mineralogy are provided by mid and far-infrared observations, both in our galaxy and in the nearby ones (Knapp, 1985; Matsuura et al., 2009; Matsuura et al., 2012).
Comparing the dust mass loss rates derived from far-infrared observations with the gas mass loss rates obtained from CO observations for Galactic AGB stars, Knapp (1985) have found typical dust-to-gas ratios of 6 10-3 for oxygen-rich (M) stars, mainly in the form of amorphous silicates, and 10-3 for carbon-rich (C) stars, mainly as amorphous carbon. In particular they have estimated that, at solar metallicity, a large fraction of the silicon should condense into dust in the circumstellar envelopes (CSEs) of these stars. AGB stars were soon recognized as the main stellar dust producers, compared to other sources like Supernovae (SNe), Red Supergiant and Wolf-Rayet stars (Gehrz, 1989). This picture becomes more complex considering that, once dust is injected into the ISM, it is subject to many processes that can alter significantly its abundance and composition (Draine, 2003).
Moving beyond the Galactic context, it is now well established that the stellar dust has a far-reaching relevance, being a critical element in the interpretation of extraGalactic observations up to the far Universe. The study of the Spectral Energy Distribution (SED) of galaxies and quasars at high redshifts shows that even very young objects possess large dust reservoirs (Lilly et al., 1999; Eales et al., 2000; Bertoldi et al., 2003; Robson et al., 2004; Beelen et al., 2006; Dwek & Cherchneff, 2011). On the theoretical side, many efforts have been made in order to model dust evolution in local galaxies (Dwek, 1998; Calura et al., 2008; Zhukovska et al., 2008; Piovan et al., 2011a, b; Boyer et al., 2012; Boyer, 2013), and to explain the presence of large amounts of dust at early epochs, when the dust and chemical enrichment time-scale was only a fraction of a Gyr (Dwek et al., 2007; Valiante et al., 2009; Mattsson, 2010; Valiante et al., 2011; Dwek & Cherchneff, 2011; Gall et al., 2011; Pipino et al., 2011; Pipino & Matteucci, 2011; Michałowski et al., 2011; Yamasawa et al., 2011). Several authors suggest that at high redshifts the major dust contributors should be SNe because of their short lifetimes with respect to those of AGB stars (Maiolino et al., 2004; Marchenko, 2006). However, SNe play also an important role in dust destruction since they produce shocks and high energy particles, so that their dust contribution is currently still controversial (Todini & Ferrara, 2001; Nozawa et al., 2003; Sugerman et al., 2006). On the other hand, recent studies have concluded that the observed dust at these redshifts should be ascribed to the ejecta of stars more massive than 3 M⊙, with SNe confined to a secondary contribution (Dwek et al., 2007; Valiante et al., 2009; Dwek & Cherchneff, 2011). In this framework, it is therefore crucial to know how stellar dust ejecta, and in particular those of intermediate-mass stars, depend on metallicity since, at least in the early phases of galaxy evolution, the environment conditions were likely quite different from those in the present local Universe.
Another key motivation behind this study is the need for calibrating uncertain parameters that are commonly used in stellar evolution calculations, such as the efficiency of mass loss. New sets of Thermally Pulsing Asymptotic Giant Branch (TP-AGB) evolutionary tracks, for a wide range of initial masses and metallicities, have been recently presented by our group (Marigo et al., 2013). It is now necessary to extend the study to those AGB stellar observables, e.g. their mid-infrared colours, that critically depend on the mass loss rates. Stellar isochrones in mid-IR bands have already been calculated (Bressan et al., 1998; Marigo et al., 2008), but these studies do not rely on direct calculations of the properties of dust in the CSEs. With this work we aim at predicting all the basic quantities needed for stellar population studies in the mid-infrared, i.e. dust ejecta, dust-to-gas ratio, composition, and outflow velocity, as a function of stellar parameters.
Detailed modeling of dust formation within CSEs of AGB stars has already been carried out by several authors. On one side, full hydrodynamical computations of dust formation, coupling radiative transfer with pulsations and induced-shocks, describe the complex interaction between radiation and dust grains (Bowen & Willson, 1991; Fleischer et al., 1991; Lodders & Fegley, 1999; Cherchneff, 2000; Winters et al., 2000; Elitzur & Ivezić, 2001; Jeong et al., 2003; Höfner et al., 2003; Höfner, 2008b). A different approach is that of describing the dust growth in an expanding envelope, under the stationary-wind approximation as in Ferrarotti & Gail (2006) (hereafter FG06) and in Gail & Sedlmayr (1999). Unlike the former approach, the latter is not fully consistent since, for example, it cannot predict the mass loss rate as a function of stellar parameters. However, at present this simplified method is the only feasible way to couple dust formation with stellar evolution calculations that, especially for the TP-AGB phase, involve a large number models. Furthermore, this method can be useful for testing the effects of some critical assumptions. As a matter of fact, there are still several uncertainties that affect the theory of dust formation. In particular the dust condensation temperature of silicates obtained from the original and widely used models by Gail & Sedlmayr (1999) and FG06, 1000 K, is significantly lower than that measured in more recent laboratory experiments, 1350 K (Nagahara et al., 2009b) and this may affect significantly the results of the dust formation models.
Since the new TP-AGB tracks by Marigo et al. (2013) span a wide range of masses and metallicities and, following in a very detailed way the various physical processes inside the star, comprehend thousands of models, we opt for the more agile approach of FG06. Thanks to the flexibility of this method, we will also investigate the effects of using a new criterion for the determination of the condensation temperature of silicates. In particular, we will compare our predictions with the observed velocities of Galactic AGB stars, and analyse the impact of the different assumptions on the resulting dust ejecta.
The paper is organized as follows. In Section 2 we summarize the main characteristics of the underlying TP-AGB tracks. The basic equations of the wind model are presented in Section 3. In Section 4 we discuss the equations governing the dust growth, with particular attention to the dust destruction processes. We illustrate two different methods to compute the condensation temperature of silicates. In Section 5 we apply both methods to the TP-AGB models, and compare the results with observed terminal velocities. Dust ejecta of different masses and metallicities are provided in Section 6. Finally, the results are discussed in Section 7.
2 The TP-AGB models
The TP-AGB evolutionary models are computed with the new code COLIBRI, described in Marigo et al. (2013) to which the reader should refer for all details. In brief, for each combination of initial stellar mass () and initial metallicity (), the characteristic quantities at the first thermal pulse, obtained from the PARSEC database of full stellar models (Bressan et al., 2012), are fed as initial conditions into COLIBRI, that calculates the whole TP-AGB evolution until the entire envelope is lost by stellar winds.
It is worth emphasizing that, compared to purely synthetic TP-AGB codes, COLIBRI relaxes a significant part of their previous analytic formalism in favour of detailed physics applied to a complete envelope model, in which the stellar structure equations are integrated from the atmosphere down to the bottom of the hydrogen-burning shell. As a consequence, both the hot-bottom burning (HBB) energetics and nucleosynthesis, as well as the basic changes in envelope structure – including effective temperature and radius – can be followed with the same richness of detail as in full models, and even more accurately.
In fact, a unique feature of COLIBRI, which is of particular importance for the present work, is the first on-the-fly computation ever with the ÆSOPUS code (Marigo & Aringer, 2009) of i) the chemistry for roughly atoms and molecular species and ii) gas opacities throughout the atmosphere and the deep envelope at each time step during the TP-AGB phase. This new technique assures a consistent coupling of the envelope structure with its chemical composition, that may significantly change due to the third dredge-up and HBB processes.
In particular, with COLIBRI we are able to follow in detail the evolution of the surface C/O ratio, which is known to produce a dramatic impact on molecular chemistry, opacity, and effective temperature every time it crosses the critical region around unity (Marigo, 2002; Marigo & Aringer, 2009). In turn, the C/O ratio plays a paramount role in determining the chemical and physical properties of the dust, as we discuss in this work. We just mention here that in M-stars (C/O) the main dust species are amorphous silicates, quartz (SiO2) and corundum (Al2O3) (Tielens et al., 1998; Ossenkopf et al., 1992). On the other hand, in C-stars (C/O) the dust produced is predominantly amorphous carbon and silicon carbide (SiC) (Groenewegen et al., 1998).
Following the results of Marigo et al. (2013) the evolution of the surface C/O ratio is essentially governed by the competition between the third dredge-up occurring at thermal pulses, and HBB taking place during the quiescent interpulse periods. Of great importance are also the stages of onset and quenching of the two processes, that normally do not coincide.
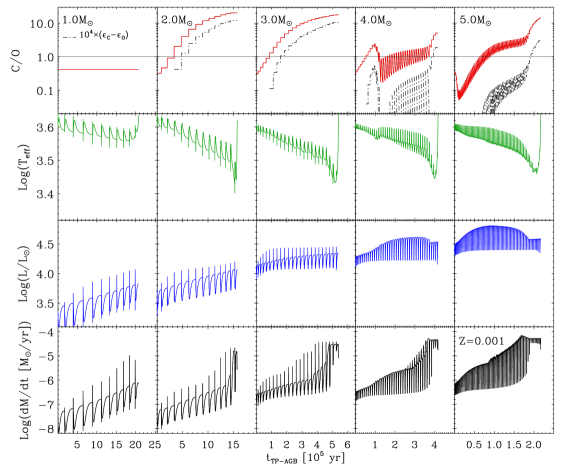
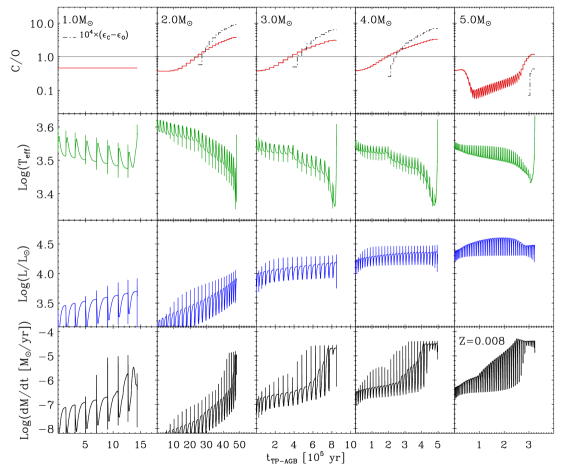
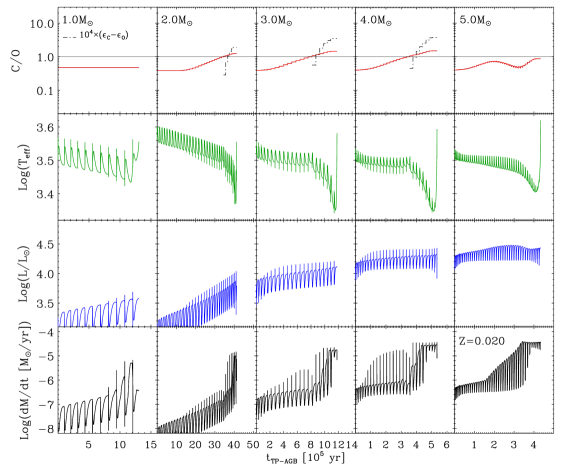
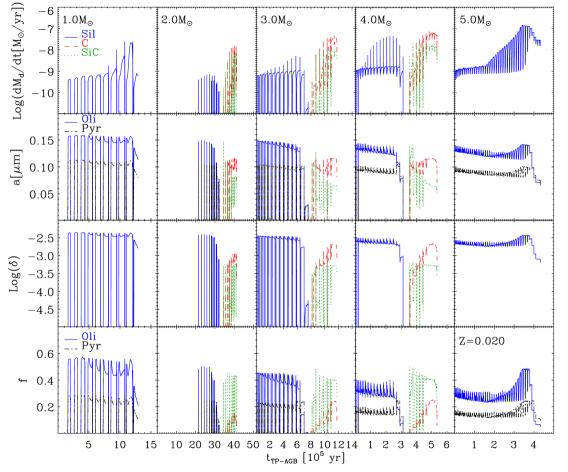
The resulting picture is quite complex as transitions through C/O may happen at different stages during the TP-AGB evolution and with different characteristics. Figures 1, 2 and 3 show the time evolution of C/O ratio, effective temperature, luminosity, and mass loss rate for a few TP-AGB stellar models with selected values of the initial mass ( M⊙) and metallicity (). Together with the C/O ratio we plot also the carbon excess, defined as the difference between the number of carbon and oxygen atoms, normalized to that of hydrogen atoms, -=-. This quantity is even more meaningful than the C/O ratio, as it defines approximately the number of carbon atoms not locked into the CO molecule, and thus available for the formation of the carbonaceous dust. From inspection of Figs. 1-3 we extract a few representative cases of the C/O evolution during the TP-AGB phase, that are relevant for the interpretation of the results presented in this work.
-
a)
C/O during the whole AGB evolution. This is typical of low-mass stars ( M⊙), but the actual minimum mass for a star to become a carbon star, M, is expected to depend critically on the metallicity, increasing at larger .
-
b)
C/O C/O as a consequence of the carbon enrichment due to the third dredge-up at thermal pulses. This explains the existence of carbon stars with typical masses of M⊙ depending on metallicity and model details. In these models the rise of the C/O ratio begins at the beginning of the third dredge-up and it is not inhibited by the HBB. Notice that, in these cases, the excess carbon becomes larger and larger at decreasing initial metallicity. Thus at decreasing metallicity, not only the carbon abundance reaches O the abundance more easily but also the amount of primary carbon production is larger. The transition to C/O may be also experienced by the brightest mass-losing objects (e.g. M¿ 5 M⊙ and ), that become carbon rich in their last evolutionary stages when HBB is extinguished, while few more third dredge-up episodes may still take place.
-
c)
C/O C/O as a consequence of a very efficient HBB, mainly in quite massive AGB stars, M⊙, at very low metallicities, . Differently from the standard channel of carbon star formation, illustrated in the former examples, in this case the C/O ratio becomes larger than unity because of the activation of the ON cycle that causes the destruction of oxygen in favour of nitrogen.
-
d)
C/O C/O may take place in relatively massive AGB stars in which HBB develops after the transition to the carbon star regime. In these cases the CN cycle becomes efficient enough to bring the star back to the M spectral type (see the crossing of C/O in the model of 4 M⊙ and , at time 1.2 105 yr).
-
e)
C/O C/O: multiple transitions across C/O may take place under particular conditions. The sawtooth trend of the C/O ratio around unity occurs for a significant part of the TP-AGB evolution of the M=4 M⊙, model. This peculiar phase is characterized by quasi-periodic transitions across C/O from both below and above unity, caused by the alternating effects of the third dredge-up (C/O ) and HBB (C/O ), so that two crossings may be experienced within a single thermal pulse cycle.
The TP-AGB models used in the present work are based on specific prescriptions for the mass loss and the third dredge-up, which we briefly outline below.
Mass loss. It has been included under the hypothesis that it is driven by two main mechanisms, dominating at different stages. Initially, before radiation pressure on dust grains becomes the main agent of stellar winds, mass loss is described with the semi-empirical relation by Schröder & Cuntz (2005), which essentially assumes that the stellar wind originates from magneto-acoustic waves operating below the stellar chromosphere. The corresponding mass loss rates are indicated with .
Later on the AGB the star enters the dust-driven wind regime, which is treated with an approach similar to that developed by Bedijn (1988), and recently adopted by Girardi et al. (2010).
Briefly, assuming that the wind mechanism is the combined effect of two processes, i.e., radial pulsation and radiation pressure on the dust grains in the outermost atmospheric layers, we adopt a functional form of the kind , as a function of the current stellar mass and radius. This expression synthesizes the results of numerical computations of periodically-shocked atmospheres (Bedijn, 1988). The free parameters and have been calibrated on a sample of Galactic long-period variables with measured mass loss rates, pulsation periods, stellar masses, radii, and effective temperatures. More details about the fit procedure will be given elsewhere. We denote the corresponding mass loss rates with . At any time during the TP-AGB calculations the actual mass loss rate is taken as the maximum between and .
The key feature of this formalism is that it predicts an exponential increase of the mass loss rates as the evolution proceeds along the TP-AGB, until typical superwind values, around M⊙yr-1, are eventually reached (see bottom panels of Figs. 1-3). The super-wind mass loss is described in the same fashion as in Vassiliadis & Wood (1993), and corresponds to a radiation-driven wind, , where is the speed of light and is the terminal velocity of the wind.
At any time during the TP-AGB calculations the actual mass loss rate is taken as
| (1) |
The third dredge-up. The onset of the third dredge-up is predicted with the aid of envelope integrations requiring that a minimum temperature ( for the present calculations) should be reached at the base of the convective envelope. The rather low value of the temperature parameter favours an earlier occurrence of the third dredge-up episodes. The efficiency of the third dredge-up is computed with the analytic fits to full TP-AGB models of Karakas et al. (2002), as a function of current stellar mass and metallicity. The chemical composition of the dredged-up material (mainly in terms of 4He, 12C, 16O, 22Ne and 23Na) is obtained with the aid of a full nuclear network applied to a model for the pulse-driven convection zone.
Hot-bottom burning. Both the break-down of the core mass-luminosity relation and the rich nucleosynthesis of HBB (via the CNO, NeNa and MgAL cycles) are followed in detail, solving a complete nuclear network coupled to a diffusive description of mixing, at each mesh throughout the convective envelope. The peculiar bell-shaped luminosity evolution of massive TP-AGB stars with HBB is shown in Figs. 1-3.
It should be mentioned that the present set of TP-AGB models is a preliminary release, since we are currently working to a global TP-AGB calibration, aimed at reproducing a large number of AGB observables at the same time (star counts, luminosity functions, C/M ratios, distributions of colors, pulsation periods, etc.) in different star clusters and galaxies. Since the calibration is still ongoing, the current parameters (e.g. efficiency of the dredge-up and mass loss) of the TP-AGB model may be changed in future calculations.
Anyhow, various tests indicate that the present version of TP-AGB models already yields a fairly good description of the TP-AGB phase. Compared to our previously calibrated sets (Marigo & Girardi, 2007; Marigo et al., 2008; Girardi et al., 2010) the new TP-AGB models yield somewhat shorter, but still comparable, TP-AGB lifetimes, and they successfully recover various observational constraints dealing with e.g. the Galactic initial-final mass relation, spectro-interferometric determinations of AGB stellar parameters (Klotz et al., 2013), the correlations between mass loss rates and pulsation periods, and the trends of the effective temperature with the C/O ratio observed in Galactic M, S and C-stars.
As we will show later in this paper, further important support comes from the results of the dust growth model applied to the TP-AGB tracks, which are found to nicely reproduce other independent sets of observations, i.e. the correlation between expansion velocities and mass loss rates of Galactic AGB stars (see Section 5.1).
3 Wind model
The TP-AGB evolutionary models computed with COLIBRI provide the input parameters necessary to determine the structure of the expanding CSE at each time step, namely: effective temperature (), luminosity (L∗), current mass (M∗), mass loss rate (), and photospheric chemical composition.
3.1 Wind dynamics
Following FG06, the equations below describe a stationary and spherically symmetric outflow of one-fluid component, assuming that there is no drift velocity between gas and dust. Neglecting the contribution of pressure we have
| (2) |
where
| (3) |
is the ratio between the radiative and the gravitational accelerations. The opacity , expressed as mean absorption coefficient per unit mass [cm2g-1], is given by the sum of the gas contribution and of all the dust species
| (4) |
where (Bell & Lin, 1994), is the degree of condensation of the key-element111Following FG06, the key-element of a given dust species denotes the least abundant element among those involved in its formation; e.g., Si is the key-element of the silicate compounds in O-rich stars. into a certain dust species and is its opacity, computed assuming the complete condensation of the key-element initially available in the gas phase. Once dust is formed, its opacity increases and the contribution of the gas becomes negligible. The wind accelerates if the opacity becomes large enough so that . As shown in Eq. (2), the acceleration is higher if this condition is satisfied at short radial distances, as it is proportional to . The degree of condensation can be written as,
| (5) |
where is the number of atoms of the key-element present in one monomer of the dust species ; is the mass of the monomer; denotes the grain size (radius) and the initial grain size; is the dust density of the grain; , are the number densities of the key-element, and of the initial number of dust grains (seed nuclei) normalized to the number density of hydrogen , respectively.
The wind dynamics and its final velocity are determined both by the amount of dust produced and its chemistry. Different dust species, in fact, have different optical properties, hence opacities, so that they condense at different radial distances. The most opaque and abundant dust species are amorphous silicates (olivine and pyroxene) in M-stars, and amorphous carbon in C-stars, whereas the other species give a negligible contribution to the total opacity.
The density profile across the wind is determined by the continuity equation:
| (6) |
The temperature structure is described with the approximation for a grey and spherically symmetric extended atmosphere (Lucy, 1971, 1976)
| (7) |
where
| (8) |
represents the dilution factor, is the photospheric radius, and is the optical depth that obeys the differential equation
| (9) |
with the boundary condition
| (10) |
3.2 Treatment of the dust opacities
The opacity of the dust is a critical quantity that determines the efficiency of the wind, as it enters the momentum conservation through the Eddington factor in Eq. (3). For each dust species under consideration, the corresponding opacity as a function of the wavelength is computed by averaging the radiation pressure cross-section, , over the normalized grain size distribution ,
| (11) |
where is the mass of the hydrogen atom, and is expressed in units of m-1. The radiation pressure cross-section, , is calculated by means of the Mie theory (Hoyle & Wickramasinghe, 1991) over a grid of sizes and wavelengths, assuming the dust grains to be spherical. The quantity is related to the absorption and scattering coefficients, and , by the relation
| (12) |
where is the asymmetry parameter that describes the deviation from isotropic scattering. The computation is performed starting from the optical constant222In the standard terminology of solid state physics, the optical constants (, ) of a solid correspond to the refractive index, and the absorptive index, respectively. data (, ) by means of a Matlab routine developed by Christian Mätzler333The routine is available at http://omlc.ogi.edu/software/mie/. The opacities of the silicate dust are presently debated. Since those of Dorschner et al. (1995), adopted in Gail & Sedlmayr (1999), are found not large enough to produce a satisfactory terminal velocity of the outflow (Jeong et al., 2003), both FG06 and Ventura et al. (2012a) adopt the opacities from Ossenkopf et al. (1992). There is another set of data (Le Sidaner & Le Bertre, 1996) which is more opaque at wavelengths shorter than 9.8 m (Jeong et al., 2003), but we find that the results obtained adopting this latter set of data are very similar to those obtained using the opacities of Ossenkopf et al. (1992).
For this work the assumed set of dust opacities is as follows. For M-stars, the (, ) data of olivine and pyroxene are taken from Ossenkopf et al. (1992), and for corundum we refer to Begemann et al. (1997). For C-stars the (, ) data of amorphous carbon are from 444Taken from http://www.mpia-hd.mpg.de/HJPDOC/carbon.php, while we use Pègouriè (1988) for silicon carbide. Iron opacity is derived from Leksina & Penkina (1967).
For each dust species , the grain size distribution is assumed to follow a power law:
| (13) |
where the size is normalized to 1 m, is the normalization constant and the slope is the same for all the dust species. The quantity is derived for the case of complete condensation by considering that the total mass of dust that can be formed can be expressed either as
| (14) |
or, after integrating over the grain size distribution, as
| (15) |
where and are respectively the maximum and the minimum dust size of the distribution. By equating the two above expressions the normalization constant reads
| (16) |
This quantity scales with the abundance of the key-element (proportional to the metallicity) and so does the opacity in Eq. (11).
For each dust species the opacity is averaged over the incident radiation field approximated with a black body. Following Lamers & Cassinelli (1999) we consider two limiting cases, the optically thin and the optically thick medium. As long as the medium remains optically thin, we use the Planck average over a black body at the effective temperature of the star, .
When dust begins to form, the opacity rises by orders of magnitude and eventually the medium becomes optically thick. In this case we use the Rosseland mean opacity and the black body distribution is computed at the local gas temperature, assuming local thermal equilibrium.
To account for the transition from an optically thin to an optically thick medium we use a linear combination of the Planck and Rosseland opacities, with a weighting factor given by the “vertical optical depth”,
| (17) |
where the Planck and the Rosseland opacities, and , are computed summing the contribution of all the dust species as in Eq. (4). In the computation of we do not consider the dilution factor because the weighting factor is computed from the condensation radius, , outwards, and dust condensation occurs very rapidly.
| (18) |
The opacity is actually used in Eq. (3).
3.3 The dust condensation temperature
Another important quantity for the calculation of a dusty CSE model is the dust equilibrium temperature. It is the temperature attained by a dust grain when it reaches the equilibrium between the energy it absorbs from the radiation field and the energy it re-emits. In particular we are interested in the equilibrium temperature, Tdust, that the dust would have at the condensation point. Since at this point the medium is optically thin, we can express the energy balance in the following way (Lamers & Cassinelli, 1999)
| (19) |
where is the Planck averaged absorption coefficient expressed explicitly as a function of the temperature and grain size, and the dilution factor W(r) is defined in Eq. (8). We notice that this is only a virtual quantity, i.e. it is the temperature that the dust would have if it could begin to form at a given radial distance. We define the dust condensation temperature, , as the dust equilibrium temperature at the point where dust of a given type effectively condenses. In principle, one should take into account that, if different dust species form at different radial distances, Eq. (19) should hold only for species that forms first because thereafter the medium could be no more optically thin. However, as we will show below, this approximation is applied only to the silicate dust produced by M-giants, that is by far the most important opacity source in their envelopes and for which we assume a condensation temperature independent of composition (olivine or pyroxene).
4 Dust growth
Dust formation in the expanding CSE of an AGB star can be modeled as a two-step process. Initially, small stable refractory aggregates are formed from the molecules in the gas phase (seed nuclei), then, as the temperature decreases, further accretion on their surface occurs by addition of more molecules. Following a commonly accepted scenario, the first to form are the most refractory aggregates, and subsequently the process proceeds by heterogeneous accretion (Gail & Sedlmayr, 1986; Jeong et al., 2003). However, the details of this process are so poorly understood that, for example, in the case of M-giants even the chemical composition of these aggregates is still a matter of debate (Jeong et al., 2003).
In our model, once the first seeds are formed, further accretion is described by explicitly computing the sticking rate of molecules on the grain surface and their evaporation rate due to the destruction processes. The primary destruction process is sublimation, caused by heating of the grains due to absorption of stellar radiation. Another mechanism is chemisputtering by H2 molecules. Gail & Sedlmayr (1999) and FG06 assume this mechanism to be very efficient within the CSE of M-type AGB stars.
Below we outline the basic equations that govern the dust growth model, while we refer to Gail & Sedlmayr (1999) and FG06 for a more detailed description.
4.1 Seed nuclei
Following Gail & Sedlmayr (1999) we treat the abundance of the seed nuclei, , as a free parameter. For silicates, a rough estimate of this quantity can be obtained using Eq. (13) assuming the number of seeds to be equal to the number of grains needed to reproduce the observed local ISM extinction. Adopting an exponent =3.5, (value suitable for olivine, Mathis et al., 1977), and integrating between m and m, we get
| (20) |
With this initial number of seeds we obtain grain sizes of about 0.01 m for the M-star models, never succeeding in reproducing the largest observed grain size 0.1 m (Sargent et al., 2010; Norris et al., 2012). On the other hand, assuming that the seeds correspond only to the fully-grown grains with typical sizes =0.1 m and mass (Jones & Merrill, 1976; van Loon et al., 2005), we can estimate their number from the grains needed to reproduce the total dust mass from Eq. (14):
| (21) |
Assuming for olivine dust g cm-3, if the key-element is silicon and according to the abundances of Anders & Grevesse (1989), we get , a much lower value than that of Eq. (20). This abundance of seeds, , assumed by Gail & Sedlmayr (1999), appears to be consistent with detailed nucleation computations by Jeong et al. (2003), as well as in very good agreement with the value inferred by Knapp (1985) for a sample of Galactic M-giants. We note that adopting in our models, the grains reach typical sizes of 0.15 m, in agreement with the observations. Anyhow, it is reasonable to keep as an adjustable parameter, since the details of the nucleation processes and even the composition of the actual seeds are still very uncertain (Goumans & Bromley, 2012). Similar considerations and results hold also for amorphous carbon.
At varying metallicity it is natural to expect that the number of seeds depends also on the abundance of the molecules that form the initial aggregates. Because of the above uncertainties on the process of seed formation we assume that in M-giants the number of seeds scales with the gas metallicity:
| (22) |
where Z is the local metallicity of the ISM. Analogously, for C-stars we scale the number of seeds with the abundance of carbon not locked into CO molecules, (Cherchneff, 2006)
4.2 Accretion of dust grains
For each dust species the growth of dust grains is determined by the balance between the rate of effective collisions of molecules on the grain surface, , and its decomposition rate, . The differential equation describing the dust growth is usually expressed in terms of the variation of the grain radius, , which is obtained from the variation of the grain volume,
| (24) |
where is the volume of the nominal monomer of dust and and are expressed per unit time and per unit surface. By differentiating one finally obtains
| (25) |
4.2.1 The growth rate
The growth is assumed to proceed through the addition of molecules from the gas phase, via suitable chemical reactions. For example forsterite, Mg2SiO4, is assumed to grow via the following net reaction,
| (26) |
The growth rate for each dust species, , is defined as the minimum between the rates of effective collisions on the grain surface of the gas molecules involved in the formation of the dust monomer, through formation reactions like that in Eq. (26). The molecular species determining such a rate is named “rate-determining species”.
| (27) |
where is the number density of the molecule in the gas phase, is the gas temperature given by Eq. (7), the corresponding thermal velocity, its stoichiometric coefficient in the dust formation reaction, the stoichiometric coefficient of the monomer of the dust species and is its sticking coefficient.
4.2.2 The destruction rate
The solid’s evaporation proceeds through pure sublimation, , due to heating by stellar radiation and, for dust species that can react with H2 molecules, such as forsterite, through the inverse reaction of the analogous of Eq. (26) at the grain surface, (Helling & Woitke, 2006). The latter process is sometimes named chemisputtering (Gail & Sedlmayr, 1999). The total destruction rate is thus
| (28) |
is determined by considering that, in chemical equilibrium conditions, it must equal the growth rate. Since the sublimation process depends only on the specific properties of the grain under consideration, the rate so determined must hold also outside equilibrium. We thus obtain from Eq. (27), after eliminating with the partial pressure and the temperature,
| (29) |
where is the dust equilibrium temperature determined with Eq. (19), is the thermal velocity of the molecule ejected from the grain surface and is the Boltzmann constant. The quantity is the saturated vapour pressure at the dust temperature, that can be expressed with the Clausius-Clapeyron equation
| (30) |
where and are sublimation constants, characteristic of the species under consideration. The constant contains the latent heat of sublimation of the dust species and the constant actually is slightly dependent on the temperature. The quantities and may be obtained either directly from thermodynamical data (Duschl et al., 1996), or by fitting with Eq. (30) the results of sublimation experiments (Kimura et al., 2002; Kobayashi et al., 2009, 2011).
is determined in an analogous way, assuming that the growth and destruction rate at equilibrium must balance, and using the Eq. (26) in chemical equilibrium to determine the partial equilibrium pressure of the rate-determining species, . We thus obtain
| (31) |
where is the rate-determining species of each dust species , and must satisfy the equilibrium condition for each formation reaction. For the reaction of formation of forsterite (26), the relation is
| (32) |
where the partial pressures are normalized to the standard reference pressure at 1 bar, is the variation of the free enthalpy per mole of the reaction in Eq. (26) and the ideal gas constant. If, for example, the rate-determining species of forsterite is SiO, Eq. (32) must be inverted to find its equilibrium pressure , given the gas partial pressures of the other species. Equations (25), (27) and (28) must be written for each of the dust species considered, as described in detail in FG06.
4.3 Low-condensation temperature models
We compute a first set of models strictly following the methodology outlined in Gail & Sedlmayr (1999) and FG06.
4.3.1 M-star models with efficient chemisputtering
From the analysis of experimental results by Nagahara & Ozawa (1996), showing that the destruction rate of forsterite in presence of H2 molecules grows linearly with the gas pressure, Gail & Sedlmayr (1999) concluded that the chemisputtering process should be fully efficient within the CSEs of AGB stars. They have shown that, in this case, the destruction rate by chemisputtering is always much larger than that of sublimation, so that one can assume that . We assume that chemisputtering is fully efficient for the species that can react with hydrogen molecules. For the species that do not react with hydrogen molecules, such as iron, we consider only the sublimation rate.
4.3.2 C-star models
For amorphous carbon, we take into account that its growth can initially proceed through complex reactions of C2H2 addition, forming isolated chains that subsequently coalesce into larger cores. Further growth of carbon mantles on these initial seeds can continue through vapor condensation (Gail & Sedlmayr, 1999). This homogeneous accretion is consistent with the microanalyses of pre-solar graphitic spherules extracted from the meteorites, revealing the presence of nanocrystalline carbon cores consisting of randomly oriented graphene sheets, from PAH-sized units up to sheets 3-4 nm in diameter (Bernatowicz et al., 1996). According to Cherchneff et al. (1992), the chain of C2H2 addition reactions have a bottleneck in the formation of the benzene because it becomes effective only when the gas temperature is below =1100 K. Therefore, while the sublimation temperature of solid carbon can exceed 1600 K, its growth should be inhibited above =1100 K. Thus, following FG06, we do not consider any destruction reaction in the case of amorphous carbon, but we assume that it can grow only when 1100 K.
Finally, we notice that a significant fraction of the pre-solar graphitic spherules contains internal crystals of metal carbides with composition from nearly pure TiC to nearly pure Zr-Mo carbide (Bernatowicz et al., 1996), but only rarely SiC (Hynes et al., 2007). These carbides might have served as heterogeneous nucleation centers for condensation of carbon, opening an alternative path with respect to the homogeneous accretion described above (Croat et al., 2005). This alternative path and its implications for the efficiency of carbon dust growth at varying metallicity will be discussed in a forthcoming paper.
The results of the present sets of calculations will be discussed in Section 4.4. Here we anticipate that the application of Eq. (25) in typical conditions of a CSE is that silicate dust destruction is very efficient above 1100 K (Gail & Sedlmayr, 1999; Helling & Woitke, 2006; Gail, 2010). We notice that this latter value of the temperature is improperly referred by some authors as the condensation temperature of silicates, though the corresponding dust temperature of silicates can be significantly less than the above value, 900 K. In analogy to the case of M-star models with efficient chemisputtering, we will also refer to these C-star models as low-condensation temperature (LCT) models.
4.4 High-condensation temperature models
4.4.1 M-star models with inhibited chemisputtering
The efficiency of chemisputtering is still a matter of debate (Duschl et al. 1996; Nagahara et al. 2009b; Tielens, private communication). On the theoretical side, the main argument is that chemisputtering could be inhibited by the high activation energy barrier of the reduction reaction of silicate dust compounds by H2 (Gardner, 1974; Tso & Pask, 1982; Massieon et al., 1993). On the observational side there is evidence, from recent experiments by Nagahara et al. (2009a), that the condensation temperature of crystalline forsterite (iron-free olivine) and crystalline enstatite (iron-free pyroxene), at pressure conditions corresponding to stellar winds, is between 1400–1500 K, while it is only slightly lower for amorphous silicates (1350 K). Therefore, the condensation temperatures obtained in the laboratory are significantly higher than those predicted by models that include a fully efficient chemisputtering. We notice that these recent results are not in contradiction with the previous work of Nagahara & Ozawa (1996) on the evaporation rate of forsterite, because the evidence of chemisputtering in their experiment appears at a gas pressure which is considerably higher than that at which dust is predicted to form in the CSEs.
Following the above indications, we also compute a class of models without chemisputtering. The evolution of the grain size is described by Eq. (25), with the destruction rate given only by the sublimation term, . We notice however that the sublimation rate depends on the dust equilibrium temperature which, in our simple model, can be defined only near the condensation point (Section 3.3). Thus, instead of integrating the full Eq. (25), we first determine the condensation point within the CSE by comparing the growth rate with the maximum sublimation rate, i.e. the sublimation rate obtained by setting in Eq. (29). This point is defined by the condition and provides also the condensation temperature. Beyond this point, we compute the evolution of the grain size by assuming that the sublimation process is negligible in the right-hand side of Eq. (25). In this way, the condensation temperature depends, on one side, on the dust species which determines and, on the other, on the physical conditions of the CSE, which determine . Since the real sublimation rate is only times the maximum sublimation rate, the above condition implies that condensation begins when the growth rate is (10 for silicates) the real sublimation rate. The corresponding super-saturation ratio is also 1/ (10 for silicates). Considering also that, beyond the condensation point, the sublimation rate decreases almost exponentially with the temperature, retaining only the growth term in Eq. (25) does not affect the accuracy of the results. This method is similar to the procedure usually followed in the literature, but for the fact that, instead of assuming a fixed condensation temperature, we derive it from the comparison of the growth and destruction rates.
An estimate of the condensation temperature of silicates as a function of , is shown in Fig. 4. The solid and dotted lines refer to the case of the olivine and pyroxene, respectively, with computed following the method by Kimura et al. (2002) (see also Kobayashi et al. (2011)). For the evaporation of pyroxene they have considered that the preferential mode is through SiO2 molecules (Tachibana et al., 2002) and have empirically derived 6.99 104 K and =3.13 1011 dyne cm-2. With these values in the equation of the saturated vapour pressure (Eq. 30), we obtain condensation temperatures that lie between 1400 K and 2000 K. For olivine, Kimura et al. (2002) determine, from experimental results, K and dyne cm-2. With these values we obtain condensation temperatures between 1200 K and 1400 K. The olivine curve obtained with this approach can be compared with that derived for forsterite (dashed line) using, instead, the analytical fits to theoretical calculations of and provided by Duschl et al. (1996). We see that the two methods give comparable condensation temperatures for olivine-type silicates. These condensation temperatures are significantly higher than those found in presence of chemisputtering ( 900 K). The values shown in the figure are also consistent with those derived by Kobayashi et al. (2009, 2011), in the different context of sublimation of dust grains in comets.
Moreover, for olivine, this result is in very good agreement with the recent experimental results by Nagahara et al. (2009a), who have found from 1350 K (amorphous silicates) to 1450 K (crystalline silicates). Instead, for pyroxene, our values are significantly higher than the above values. However our result for pyroxene is not very reliable and must be considered only as un upper limit for the following reason. We assume that pyroxene evaporates preferentially incongruently through SiO2 but we do not take into account that this incongruent sublimation is followed by the production of forsterite (Tachibana et al., 2002) which, at these temperatures, immediately evaporates. Thus, in the following, we will consider the condensation temperature of the olivine as representative of all other silicates.
We stress that in these models we neglect the chemisputtering process at any pressure (Kobayashi et al., 2011) while Nagahara & Ozawa (1996) have found that, at high pressures, the evaporation at fixed temperature increases almost linearly with the pressure, so that chemisputtering could become efficient. The lowest pressure in the Nagahara & Ozawa (1996) experiment was P dyne cm-2 while in Nagahara et al. (2009a) the upper limit was P dyne cm-2. With these two values we derive typical dust equilibrium temperatures of T 1500 K to T 1600 K, which are significantly higher than the values of the condensation temperature of olivine.
Therefore, we conclude that, besides leading to temperatures in good agreement with experimental evidence, the assumption of neglecting the chemisputtering process does not lead to results in disagreement with the evidence that this process may play a role at higher gas pressures.
4.4.2 C-star models with modified condensation temperature
For the amorphous carbon we have already seen that the growth is not regulated by its sublimation temperature (1500 K), but by the gas temperature window (900–1100 K) that allows an efficient chain of C2H2 addition reactions (Cherchneff et al., 1992). However, recent hydrodynamical investigations indicate that, during a pulsation cycle, gas that is initially at temperatures well above K, after being shocked may cool down and remain inside the effective temperature window long enough to enhance the rate of addition reactions (Cherchneff, 2011). In the detailed model of IRC+10216 this process allows the formation of amorphous carbon in inner regions of the CSE where the pre-shock gas temperature is significantly above the effective window, K (Cherchneff, 2012). As a consequence, the growth rate of amorphous carbon can be significantly enhanced. To investigate the impact on the predicted ejecta of carbon dust, we explore the case of a higher temperature window, following the detailed results of Cherchneff (2012). In this case we simply assume that the amorphous carbon can condense below K, which should set a fairly upper limit to the growth rate of amorphous carbon.
In the following we will refer this set of models as high-condensation temperature (HCT) models.


4.5 Method of solution and initial conditions
The system of differential equations describing the dust evolution is given by Eq.s (2), (9) and an equation like (25) for each dust species. In M-stars we consider the evolution of corundum (Al2O3), quartz (SiO2), iron, olivine (Mg2xFe2(1-x)SiO4) and pyroxene (MgxFe1-xSiO3). The quantity , the fractional abundance of Mg molecules with respect to the sum of Mg and Fe molecules, ranges from 0 to 1 and is governed by equations like (12) and (16) of FG06. In C-stars we consider amorphous carbon, silicon carbide (SiC) and iron. Finally we add the Eq. (18) to compute the weighting factor for the opacity. The independent variable of the system is the radial distance , whereas, the dependent variables are the velocity, , the optical depth, , the grain size for each dust species, , and the vertical optical depth, . The quantities that determine the wind structure are the gas temperature and density profiles, and , the total opacity, , the dust condensation fraction, , and .
Since the boundary condition on (Eq. 10) is at infinity, but all the other conditions are at the inner radius, we solve the system by means of the following shooting method. We begin the integration with a guess value of at a suitable inner radius chosen so that the gas temperature is high enough to inhibit the formation of any type of dust. We then integrate outward all the equations until 1000 . The latter condition is set because, at these large distances from the photosphere, the density is so low that dust cannot grow any more and the acceleration term is negligible. As the integration moves outward, all the dependent variables, but , are reset to their initial values, until dust begins to condense. In this way we avoid that, for example, the velocity drops to zero before dust condenses, which corresponds to the assumption that pulsations are able to drive the medium into the condensation region. We iterate on until the condition is met. This condition actually replaces Eq. (10) and the accuracy has been chosen to be in order to provide stable solutions and to avoid excessive computational time, at once.
The reactions assumed for dust formation are taken from Gail & Sedlmayr (1998), for corundum, and FG06 for all the other dust compounds. The thermodynamical data for the decomposition rates are taken from Sharp & Huebner (1990) with the exception of FeSiO3 and SiC for which we use the data taken by Barin & Platzki (1995). The values of the sticking coefficients are taken from laboratory measurements, when available, or theoretical computations. However, their uncertainties can be high because they may involve a temperature dependent activation factor while experiments encompass only a limited range of temperatures. For olivine we adopt determined from evaporation experiments of forsterite by (Nagahara & Ozawa, 1996). For iron and quartz the experimental values are and , respectively (Landolt-Börnstein, 1968). For the growth of SiC a value of has been determined by Råback (1999). For other species we cannot rely on experimental measurements of the sticking coefficient and we need to make some assumption. For pyroxene we adopt the same value as that used for olivine. For corundum we chose the maximum possible value, i.e. . Finally, for amorphous carbon the usual assumption is to adopt because, once the C2H2 addition reactions are activated, the gas temperature K is so much below the typical sublimation temperature K of carbon, that the latter is supposed to grow at the maximum efficiency (Gail & Sedlmayr, 1988; Cherchneff et al., 1992; Krueger et al., 1996). We thus adopt the standard assumption , but we also check the effects of adopting a lower sticking coefficient and .
For the computation of the opacities in LCT models, we use the dust distribution parameters determined by Mathis et al. (1977) namely, =3.5 and m, m. These parameters are kept fixed at varying metallicity. This choice of the parameters is adopted only for comparison with the results of FG06 and Ventura et al. (2012a). A different choice is adopted in the HCT models, for which an almost flat distribution is assumed (=0.1) and m, m. This choice is more consistent with the grain size distribution obtained from the integration. The number of initial seeds is set to (see also Section 4.1) and their initial size is assumed to be m (FG06).
The value of initial velocity of the wind was arbitrary chosen to be 0.5 km s-1. According to the amount and the dust species produced, the matter can a) not being accelerated at all, b) first accelerate, but then decelerate again at some radial distance c) be accelerated away from the star. In any case if the local velocity never exceeds the local escape velocity, dust is not able to drive the wind -inefficient dust-driven case according to FG06, Höfner (2009)- and we assume that the outflow proceeds at least at the initial velocity. This assumption tends to overestimate the fraction of dust that can condense but, since it corresponds to phases where the mass loss rate is relatively low, it does not significantly affect the total dust ejecta.
We exclude from the calculations the models for mass loss rates below 10-8 M⊙ yr-1, because dust formation is already negligible at those values (FG06).
5 Results
We follow the growth and evolution of dust in the CSEs of a few selected evolutionary TP-AGB tracks, extracted from the set of Marigo et al. (2013).
We consider three values of the initial metallicity, , , , which are representative of low, intermediate and solar metallicity respectively, and a few selected values of the initial stellar mass, between 1 M⊙ and 6 M⊙ as listed in Table 1. We are presently extending the dust computations to other metallicity sets of TP-AGB models, while the range of Super AGB stars (Siess, 2010) will be the subject of a following investigation.
5.1 Expansion velocities
5.1.1 M-stars
We first discuss the effects of including (LCT) or neglecting (HCT) chemisputtering in a model representative of a typical Galactic M-giant, with mass M⊙, metallicity and mass loss rate M⊙yr-1. In the upper panel of Fig. 5 we show the gas (thick line) and dust (thin line) temperature profiles. In the LCT model dust condensation starts at a gas temperature of about 1100 K, in agreement with Helling & Woitke (2006) and with the condensation curves drawn by Gail & Sedlmayr (1999) for the chemisputtering process. The corresponding dust condensation temperature, indicated by the lower cross, is only of about K. Instead, when only sublimation is considered, silicate dust begins to condense at a dust temperature of K, well above the limit obtained with chemisputtering and in very good agreement with the one experimentally determined by Nagahara et al. (2009b). We notice that the corresponding gas temperature, K, is comparable with the one at which Nagahara & Ozawa (1996) performed their experiments. The corresponding gas pressure is relatively low, dyne cm-2, and falls within the regime where the decomposition rate measured by Nagahara & Ozawa (1996) is independent of the pressure.
The velocity and condensation profiles are shown in the lower panel of Fig. 5. Notice that the silicate condensation fractions reach the same value, but the bulk of condensation occurs much closer to the star when the chemisputtering process is neglected. In this case, the bulk of condensation happens at , a factor 2.5 less than when chemisputtering is included (). The overall effect is that, for the HCT models the acceleration term is larger, mainly because of the larger local acceleration of gravity in the inner regions. This gives rise to a final velocity which is more than twice the terminal velocity reached by the model with chemisputtering.
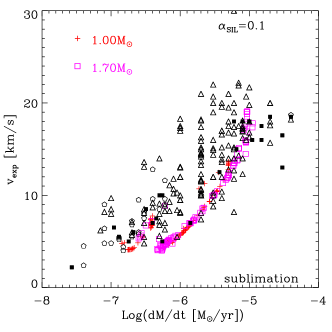
We now compare the expansion velocities obtained with our models with those observed in Galactic M-type AGB stars. It is important to stress here that, contrary to more sophisticated hydrodynamical models, our model cannot provide the mass loss rate, which must be assumed. The meaning of this comparison is thus to check whether, given the stellar parameters and the corresponding mass loss rates, our model is able to reproduce the terminal velocities of the wind, over the entire range of observational data. The comparison is shown in Fig. 6. Mass loss rates and expansion velocities are taken from Loup et al. (1993) (black triangles), González Delgado et al. (2003) (black pentagons) and Schöier et al. (2013) (black squares). Data from Loup et al. (1993) and Schöier et al. (2013) are derived from observations of 12CO and HCN rotational transitions, whereas González Delgado et al. (2003) obtained their values from the interpretation of SiO rotational transition lines. The mass loss rates range from 10-7 M⊙yr-1 to a few 10-5 M⊙yr-1, including also dust-enshrouded AGB stars, while the wind velocities range from a few km s-1 to 20 km s-1. For the models we use an initial metallicity , that we consider typical of the solar environment (Lambert et al., 1986). We remind that, though the current solar metallicity is estimated to be 0.0154 (Caffau et al., 2011) and its derived initial metallicity is 0.017 (Bressan et al., 2012), Lambert et al. (1986) compared their observations with model atmospheres based on the old (Lambert, 1978) solar abundances for which .
In Fig. 6, as well as in Figs. 7 to 9 where we compare predictions with observations, the evolutionary tracks for TP-AGB stars with various masses are represented with a discrete number of points, selected from a randomly generated uniform distribution of ages that samples the entire TP-AGB phase of each star. The number of points is not set equal to the total number of observed objects because our aim is only to highlight the regions where TP-AGB stars are expected to spend most of their evolutionary time, and not that of performing a population synthesis analysis. This latter would require the convolution with the initial mass function and the star formation rate, which is beyond the goal of this paper.
In the left panel of Fig. 6 we compare the data with the LCT models (with chemisputtering) while, in the right panel, we consider the HCT models (with only sublimation). It is immediately evident that the models with efficient chemisputtering cannot reproduce the observed velocities. The predicted velocities never exceed 10 km s-1. Moreover, after an initial rise, they saturate or even decrease at increasing mass loss rate, failing to reproduce the observed trend. This long standing discrepancy has challenged many theoretical investigations (Ireland & Scholz, 2006; Woitke, 2006, e.g.). As discussed also by FG06 this problem is largely insensitive to the adopted opacities. Even using different opacity data, (Jones & Merrill, 1976; Ossenkopf et al., 1992; Dorschner et al., 1995) in the revised version of Le Sidaner & Le Bertre (1996), we cannot reproduce the observed relation.
Recently a solution to this discrepancy has been advanced by Höfner (2008a) who was able to obtain the needed acceleration by combining (i) photon scattering from large iron-free silicate grains with (ii) a high sticking coefficient ().
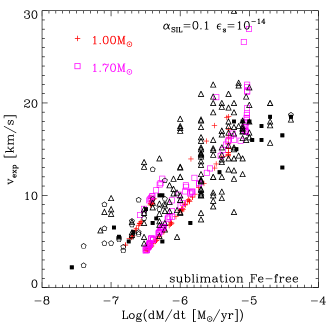
An alternative explanation of the discrepancy between observed and predicted terminal velocities is naturally provided by our HCT models, as can be seen in the right panel of Fig. 6. With a higher condensation temperature for silicates, dust formation can take place in inner regions of the CSE, where the acceleration term is larger. The observed trend of velocity with mass loss rate is now satisfactorily reproduced, with the predicted values only slightly lower than observations. In order to improve the comparison, other important input parameters could be varied such as, the average dust size and the sticking coefficients.
The need for using large iron-free grains is thoroughly discussed by Bladh & Höfner (2012). In order to investigate the effects of large grains in our HCT models we compute a few models decreasing the number of seeds to =10-14. In these runs we use an opacity suitable for iron-free silicates (forsterite and enstatite) taken from Jäger et al. (2003). With a lower number of seeds we obtain grain sizes larger than 0.3 m. The models are plotted in Fig. 7. The comparison with the observed velocities is clearly improved, with respect to the results shown in the right panel Fig. 6. The models show two separate branches. The lower one is populated by stars with a current mass not yet highly affected by mass loss. The upper sequence is populated by models in the latest stages of the evolution, when the current mass is significantly lower than the initial one. This sequence is present in all our computed TP-AGB tracks but it is more evident in the case of large grains. Though the agreement with the data is not yet perfect, inspection of Fig. 7 shows evidence that this effect could be real. Indeed there is a sequence of stars that runs above and detached from the bulk of the data. These data could represent stars in the latest stage of the TP-AGB phase.
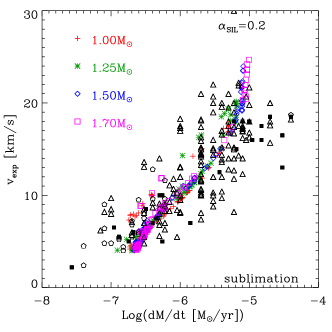
The effects of changing only the sticking coefficient are shown in Fig. 8. Here we use HCT models with standard sizes and opacity but with a modest variation of the sticking coefficient, from 0.1 to 0.2. This variation is reasonable given that the sticking coefficients for circumstellar conditions are not experimentally well constrained (Nagahara et al., 2009b). The agreement with the data is also good, indicating that with a larger condensation temperature it may not be necessary to invoke iron-free grains.
5.1.2 C-stars
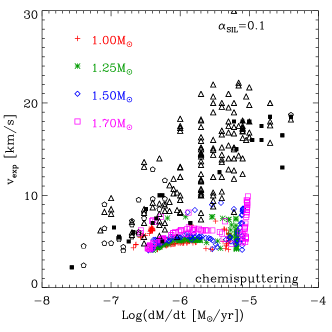
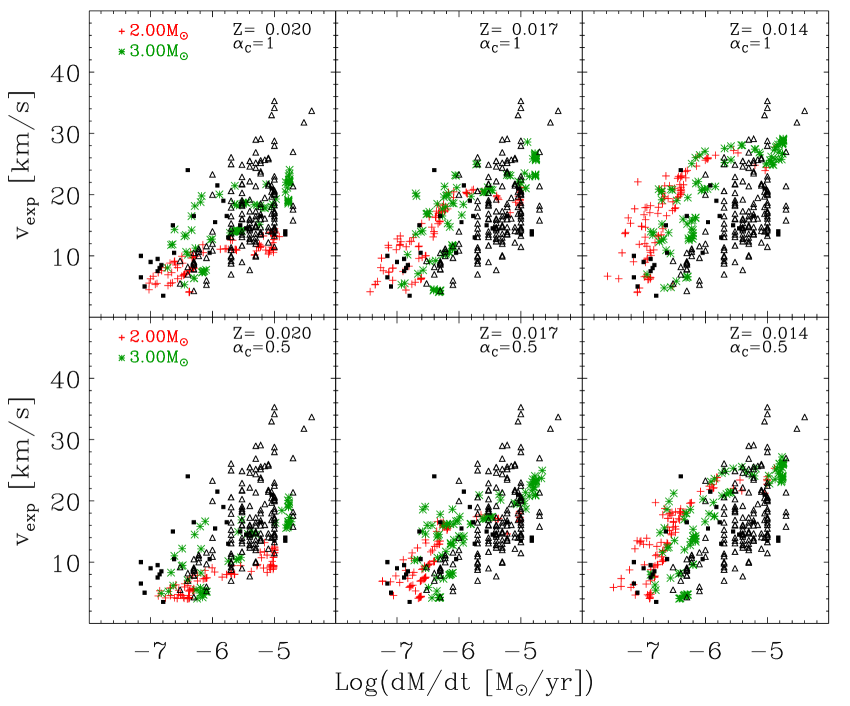
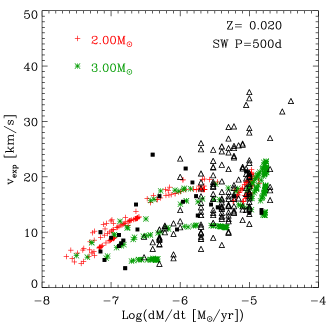
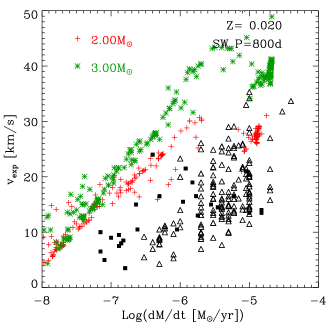
The comparison with C-stars is shown in Fig. 9. Observed terminal velocities and mass loss rates of Galactic C-giants are taken from Loup et al. (1993) (black triangles) and Schöier et al. (2013) (filled black squares). The observed velocities range from a few km s-1 to about 35 km s-1 for mass loss rates between 10-7 M⊙yr-1 and 10-5 M⊙yr-1. LCT models of C-stars with initial mass between 2 M⊙ and 3 M⊙, metallicity and sticking coefficient of amorphous carbon (top left panel) reproduce fairly well the observed diagram. This result is already known because the opacity of amorphous carbon is by far larger than that of silicate dust.
The other two upper panels in Fig. 9 show the effects of lowering the initial metallicity from to and to . At a given mass loss rate, the predicted terminal velocities increase at decreasing Z and while for the models perform fairly well, at lower metallicity there is a tendency to run above the region occupied by the bulk of the data.
In particular, for many models fall in a region with detectable mass loss rates but with velocities significantly higher than observed. To explain this effect we notice that, as shown in Figs. 1-3, at decreasing metallicity C-stars of the same mass not only reach a higher C/O ratio, but also a larger carbon excess, -. Indeed, for the metallicities considered in Fig. 9, the maximum C/O attained in the models of 2 M⊙ and 3 M⊙ are C/O and 1.46 for , C/O and 1.70 for , C/O and 2.06 for Z, while the maximum carbon excess is 1.92 and 3.52 for , 3.63 and 4.57 for and 5.39 and 5.58 for , respectively. With a larger carbon excess, the amount of amorphous carbon that can be produced in our scheme is also larger and the wind experiences a higher acceleration. To see how this result depends on the adopted value of the sticking coefficient of the amorphous carbon we have recomputed the above dust evolution sequences with both and . With the latter value we could not obtain C/O ratios within the range that can produce realistic expansion velocities (Mattsson et al., 2010). With the intermediate value one can still get a good agreement with the data, as shown by the lower panels of Fig. 9. With the best agreement between data and simulations is achieved for and, as in the case with sticking coefficient , seems to be a too low metallicity for the Galactic C-stars. Clearly, there is a degeneracy between the carbon excess and the sticking coefficient, so that we expect that even for there will be a value of the sticking coefficient, , that is able to reproduce the observed data. Nevertheless, given that a metallicity between and is fairly representative of the possible values for C-stars of the Galactic disk and in absence of more accurate experimental determinations, we consider the most plausible range for the sticking coefficient of amorphous carbon.
It is also interesting to see the effects of adopting different mass loss prescriptions, but maintaining the same prescription for the efficiency of the third dredge-up (Karakas et al., 2002). In the upper panel of Fig. 10 we show the effects of adopting the mass loss rate prescription of Vassiliadis & Wood (1993) in its original formulation, with a superwind phase starting at a pulsation period days. The general agreement is satisfactory, similar to the results in Fig. 7 (top panel).
Instead, delaying the onset of the superwind to P=800 days as suggested by Kamath et al. (2011), we predict expansion velocities that are too high compared to the bulk of the observed data, for . In this case, TP-AGB models suffer more third dredge-up events, which lead to larger C/O ratios, i.e. 1.77 and 2.47 for the 2 M⊙ and 3 M⊙ models, respectively. Lower velocities may be obtained with models of higher Z, but this would conflict with the observed oxygen abundances of the Galactic C-stars which are slightly sub-solar. Within our adopted scheme for C-dust formation, a delayed super-wind can still produce a reasonable agreement with observations, but invoking a lower efficiency of the third dredge-up at the same time.
It is also worth mentioning that there is observational evidence that C-stars in the Small Magellanic Cloud (SMC), despite having very similar molecular C2H2 and HCN NIR band strengths compared to C-stars in the Large Magellanic Cloud (LMC), show a lower intrinsic dust attenuation (van Loon et al., 2008). This would confirm earlier suggestions that also for C-stars the dust-to-gas ratio should decrease with the initial metallicity, and this would directly affect the predicted velocities. In particular van Loon (2000), combining scaling laws provided by spherically symmetric stationary dusty winds with other observational evidence, derived a linear relation between the dust-to-gas ratio and the initial metallicity of C-stars. While in M-giants a correlation with metallicity is naturally explained by the secondary nature of the dust key-elements such as silicon and magnesium, for C-stars this would mean that the efficiency of converting C-molecules into C-grains decreases with the initial metallicity (van Loon et al., 2008). This would point against the homogeneous growth assumed in this paper, and would be more in favour of a heterogeneous growth on metal carbides (TiC, ZrC, MoC), as already discussed in section 4.3.2.
In summary, we can draw the following conclusions: expansion velocities
of C-stars depend on the interplay between mass loss and third dredge-up,
and are affected by the uncertainties in the sticking coefficients and the details
of underlying nucleation process.
As a result, some degree of degeneracy affects the predictions.
At the same time, the observed velocities may offer a powerful tool
to calibrate the above processes, provided that
other independent observational constraints
are considered jointly (e.g. measurements of C/O ratios,
effective temperatures, mass loss rates, lifetimes from star counts, etc.).
5.2 Condensation fractions, composition, dust sizes and dust mass loss rates
Figures 11, 12 and 13 show the evolution of the dust mass loss rates, the dust sizes, the dust-to-gas mass ratios and the dust condensation fractions for the three different metallicities considered in this paper and for several initial masses. We show only the results of the HCT models computed with , that provide the best agreement with observations in terms of expansion velocities for M-stars. For sake of simplicity, the mass loss rates and the dust-to-gas ratios are shown only for silicates, amorphous carbon and SiC. As for grain sizes and condensation fractions, we distinguish between pyroxene and olivine. Referring back to Figs. 1-3, it is clear that all these quantities are modulated by the thermal pulse cycles, over which significant changes in , , and are expected to take place. The chemical type of the main dust species (either silicates of carbonaceous dust) is essentially controlled by the C/O ratio, hence it depends on the interplay between third dredge-up which tends to increase the carbon excess, and HBB that converts carbon, and even oxygen at lower metallicities, into nitrogen. Stars with mass M M⊙, corresponding to item a) in section 2, will produce mainly olivine and pyroxene. At the lower metallicity the condensation fractions are very low and these stars are able to give rise to a dust driven wind only during the peak luminosity associated with the thermal pulses. At increasing metallicity, the condensation fractions become larger and the stars are able to produce a dust driven wind also during the inter-pulse phase. The dust composition of the stars with masses of M⊙, whose evolution has been described in item b) in section 2, is initially that of an M-giant, i.e. mainly composed of silicates. During this phase the C/O ratio increases because of the third dredge-up, while remaining below unity. Therefore, the excess of oxygen (), available to be locked into silicates progressively decreases. However, since the key-element is silicon, the dust-to-gas ratio is not affected by this variation until eventually C/O1. At this stage there is a visible drop in silicate production. Once the C/O ratio becomes larger than , carbonaceous dust is produced, initially in the form of SiC. In fact, SiC condenses at a higher gas temperature than amorphous carbon, but its abundance is limited either by the silicon abundance or by the carbon excess if -. When this latter condition is fulfilled, almost all the carbon available condenses into SiC, as it can be seen at the first thermal pulse of the C-star phase of the 2 M⊙ and 3 M⊙ models at solar metallicity. As soon as , amorphous carbon becomes the dominant species as the abundance of the SiC is now controlled by the abundance of silicon. We note that the mass loss rate during the C-star phase is about two orders of magnitude larger than in the previous M-star phase, so that the integrated dust ejecta are mainly in the form of amorphous carbon. The dust evolution of the more massive stars at low and intermediate metallicity is similar to the previous case but, because of the very efficient HBB there is a rapid initial decrease of the C/O ratio. Since the key-element of silicate dust is silicon, the gas-to-dust ratio is unaffected by this variation. The stars evolve at higher luminosities and cooler effective temperatures and the mass loss rates, in both gas and dust, increase significantly. In the case of intermediate metallicity the star becomes carbon-rich in its last evolutionary stages when HBB is extinguished. Since at this stage only few more third dredge-up episodes may still take place, the contribution of carbonaceous dust to the integrated ejecta is negligible compared to that of silicates. In the case of the model of M⊙ and that may be considered representative of the more massive TP-AGB stars of low metallicity, corresponding to item c) in section 2, the HBB is so efficient that also the ON cycle is active, causing the partial conversion of oxygen into nitrogen. Thus, after an initial drop of both C and O, the C/O ratio quickly becomes larger than unity. As a consequence, silicate dust production is negligible and the main product is amorphous carbon. SiC dust is also minor in this model. Finally the model with M⊙ and presents several characteristics at a time. It begins as an M-giant but its silicate condensation fraction is not high enough to power a dust driven wind. It then becomes a carbon star, item b), but, after a while, the HBB is enough to convert it back again into an M-giant, this time with a dust driven wind, item d) in section 2. After this stage its dust evolution is characterized by the quasi-periodic transitions across C/O from both directions, caused by the alternating effects of the third dredge-up (C/O ) and HBB (C/O ), corresponding to item e). Accordingly, the main characteristics of this star are the concomitant presence of both silicate and carbonaceous dust in the same thermal pulse cycle, because the two crossings are experienced within the same cycle. During the C-star phase the main product is amorphous carbon even if C/O1, because of the very low silicon abundance.
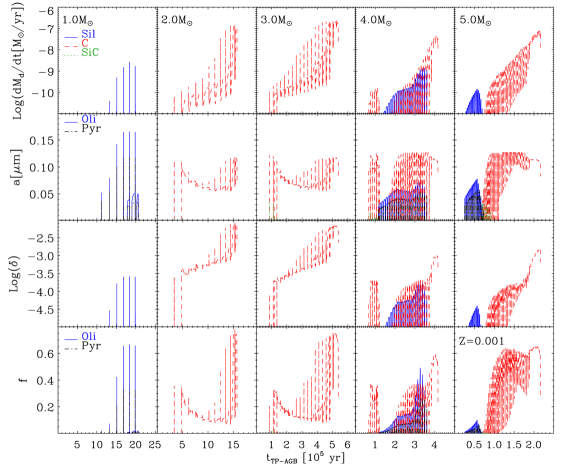
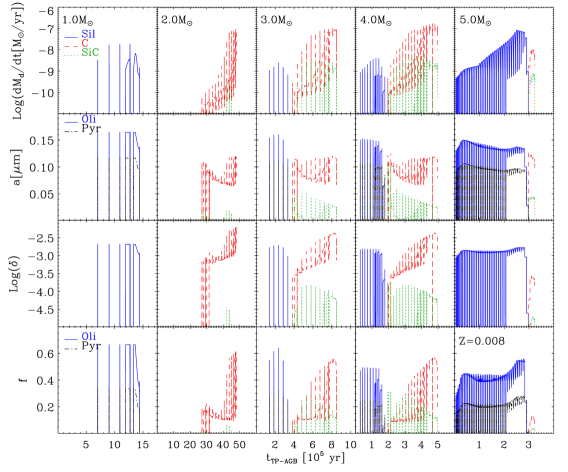
In summary, on the basis of our results, the emerging picture concerning dust production in single stars is as follows. At silicates dominate dust production only at the lowest masses (M1 M⊙) where the third dredge-up process is absent. However the corresponding dust mass loss rates are very low. At larger masses, amorphous carbon is the main dust species, though its amount may change depending on the relative efficiencies of the third dredge-up and HBB. At increasing metallicity, the third dredge-up and HBB combine in such a way that the mass range for carbon dust production becomes narrower. At , carbon dust is produced between 2 M⊙ and 4 M⊙ whereas, in all other masses, silicate dust is the main product. This result is almost independent from whether chemisputtering is included or not but, obviously, in the case without chemisputtering, silicates tend to condense more efficiently. The differences between LCT and HCT models for silicates are more pronounced at mass loss rates below 10-6M⊙yr-1 while, at higher mass loss rates, the models reach approximately the same condensation degree. These are also the phases that dominate the total dust production.
The sizes of dust grains span a wide range of values during the TP-AGB evolution, from a few hundredths of a micron up to a maximum, typically around 0.15 m, for all stellar masses and metallicities, as shown in Figs. 11-13. The broad range of spanned during the TP-AGB phase depends mainly on the efficiency of mass loss, as this latter determines the volume density of the key-elements which, in turn, regulate the growth rates (see Eq. 27). Interestingly, the maximum value of the size is almost independent from the metallicity of the star. This is due to the fact that both the initial number of seeds (Eq.s 22 and 23) and the total amount of dust that may condense, scale linearly with the metallicity or with the carbon excess. Indeed, by decreasing the number of seeds to =10-14 in a few test models, we obtain a maximum size 0.3 m, as expected from the above simple scaling.
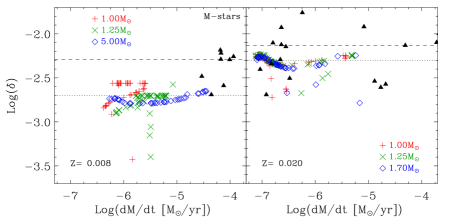
The lower panels in Figs. 11-13 show the dust-to-gas ratios , and the condensation fractions , respectively. The dust-to-gas ratios of CSE models can be compared with observations when independent data exist for both the dust mass loss and the gas mass loss rates. Unfortunately, the dust-to-gas ratio is difficult to measure mainly due to the difficulties of obtaining accurate measurements of the gas mass loss rates. For example, for the extragalactic C-stars, for which CO observations are challenging, the dust-gas-ratio is almost always assumed and used to derive the total mass loss rate from mid infrared observations. An important issue is whether and how this ratio depends on metallicity and chemistry. There are indications that for M-giants it decreases almost linearly with the metallicity (Marshall et al., 2004), while for the C-stars the situation is more intriguing because carbon is enhanced by the third dredge-up, and so dust production may not reflect the initial metallicity as in M- giants. If also carbon formed from heterogenous nucleation on metal carbides, as suggested by some recent observations (van Loon et al., 2008), then a behavior similar to that shown by M-giants should be expected. If a significant fraction of carbon formed from homogeneous growth, as suggested by the absence of metallic seeds in the nuclei of several meteoritic graphite spherules (Bernatowicz et al., 1996), then the run of the dust-to-gas ratio may be more dependent on the evolution along the AGB. Typical values assumed for the CSE dust-to-gas ratios are 1/200 for the Galaxy, 1/500 for the LMC and 1/1000 for the SMC (Groenewegen et al., 1998; van Loon et al., 2005). Dust-to-gas ratios twice the quoted values are also quite common (Groenewegen et al., 2009; Woods et al., 2012).
A noticeable effect that can be already seen in Figs. 11-13 is that in M-giants the dust-to-gas ratio () shows only a mild dependence on the evolutionary status of the star. Of course, there are strong variations near the peak luminosity after each thermal pulse but, during the inter-pulse phase, its value runs almost flat. In contrast, in the case of C-stars, generally increases during the evolution both at the peak luminosity and at each inter-pulse cycle. This mainly reflects our choice of adopting a homogeneous growth process for carbon. The comparison with Galactic M-giants (right panel) and with LMC data (left panel) is shown in Fig. 14. For Galactic M-stars we use the sample by Knapp (1985) providing both dust and gas mass loss rates. For LMC M-stars there exist only very few data in literature that can be used to determine . From OH observations of a small sample of M-giants (Marshall et al., 2004), we derive the gas mass loss rates using the prescription presented by van der Veen & Rugers (1989)
| (33) |
where D is the distance in kpc, assumed D=50 for the LMC, FOH is the OH 1612-MHz maser peak intensity in Jy and vexp is the wind speed in km s-1. The latter two quantities are provided by Marshall et al. (2004) while the factor , representing the conversion factor from OH to H2 abundances, is scaled with the metallicity, i.e. = 0.02/0.008 (=1.6) in Eq. (33). The dust mass loss rates are derived from the total mass loss rates provided by van Loon et al. (2005) for common stars, which are based on mid infrared spectral fitting. We re-normalize the values to the Marshall et al. (2004) velocities and multiply by the dust-to-gas ratio assumed by van Loon et al. (2005), . These data are compared with selected HCT models with and and initial stellar masses of 1, 1.25, 1.7 and 5 M⊙, the latter only for the lower metallicity. Like in the comparison with the velocities, the models are drawn from a uniform randomly generated set of AGB ages, for each mass. Furthermore we also take into account that the H2 abundance in our wind models is 75% of the total gas mass and, accordingly, we multiply our total mass loss rates for the same factor.
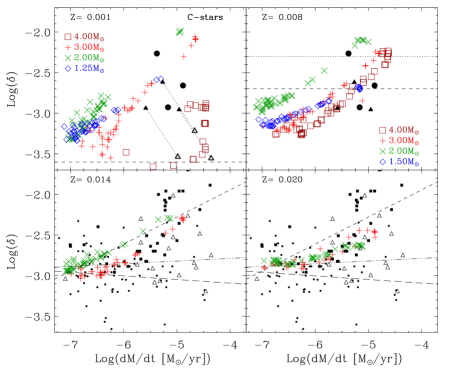
The dashed line in the right panel of Fig. 14 represents the median value for the Knapp (1985) data, . We prefer the median value of the data since, in the case of such a range of values covering about one order of magnitude because of different physical conditions, the mean value would be biased toward the highest values (). The resulting value is larger than that usually assumed, shown by the dotted line. Our models cluster around and systematically underestimate the observed median value by 50%. We notice that in our models the total fraction of silicon that is condensed into dust is already high, typically 0.7 (see also lower panels of Figs. 11-13) and that, in order to reproduce the observed values at solar metallicity, all the silicon should be locked into silicate dust, as already noticed by Knapp (1985), unless the adopted metallicity is too low. We also notice that, as already anticipated, the models show only a small dependence on the evolutionary phase along the AGB, represented here by the value of the total mass loss rate. Concerning the LMC (left panel), we see that the median value of the data (, dashed line) is 40% lower than that of Galactic M-giants. Instead our models cluster around (dotted line), the value usually adopted for the LMC. Marshall et al. (2004) already noticed that, in order to reproduce the total mass loss rates derived from infrared observations assuming (van Loon et al., 2005), they had to use a conversion factor for the LMC stars . Had we used this higher conversion factor, the median of the data would have been very near to . However, unless the adopted metallicities for the Galactic and LMC stars are grossly in error, our scaling seems more robust because oxygen is a very good tracer of the metallicity, even for non standard elemental partition. We finally notice that the models do not reproduce the highest observed mass loss rates, in both Galactic and LMC M-giants. In the latter case, the mismatch is more evident because the observations are likely biased toward the highest mass loss rates. Because also at this metallicity the trend with the total mass loss rate (if any) is modest, pushing the models toward higher mass loss rates would not solve the discrepancy with the observed dust-to-gas ratios.
Predicted dust-to-gas ratios for C-stars are compared with the observed data in Fig. 15. Data for Galactic C-stars are shown in the lower two panels of Fig. 15. Open triangles refer to the data by Knapp (1985) (median value , ), filled boxes to Groenewegen et al. (1998) (median value , ), and small dots to the revised compilation by Bergeat & Chevallier (2005) (median value , ). C-stars LCT models with initial masses of 2 and 3 M⊙ are shown in the lower right panel for and in the lower left panel for , respectively. In contrast with M-giants, the models show a clear trend of increasing dust-to-gas ratio with mass loss rate, that becomes more evident at decreasing metallicity. In order to judge whether this trend is real we have fitted with a least square routine the logarithmic values of and mass loss rates. Only the data of Groenewegen et al. (1998) (short-dashed line) show a similar trend while in both the sample of Knapp (1985) (dot-dashed line) and in that of Bergeat & Chevallier (2005) (long-dashed line) this trend is not observed. Overall the models are in fairly good agreement with the observations of Galactic C-stars though they cannot reproduce the highest observed ratios.
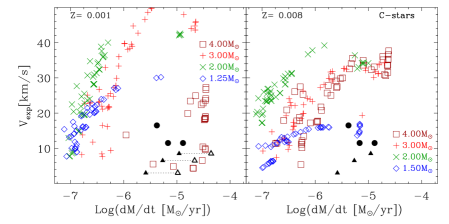
The predictions of the models at intermediate and low metallicities are shown in the upper right and left panels of Fig. 15, respectively. At metallicities lower than those of Galactic disk, the comparison with observations is challenged by the lack of gas-mass loss observations in typical subsolar environments rich in C-stars, such as the Magellanic Clouds. We plot in Fig. 15 only the recent observations of a few metal poor C-stars toward the Galactic Halo by Lagadec et al. (2012). From radial velocities, distances and Galactic coordinates Lagadec et al. (2012) place their memberships in the thick disk (filled triangles in Fig. 15) or in the Halo (filled circles). The nature of the Halo stars is still a matter of debate. In our low metallicity models the minimum mass for a star to become C-star is M1.2M⊙, while the typical turn-off mass for an old metal poor population like that of the Halo is M0.9M⊙. Since the lack of an efficient third dredge-up at low masses is a common feature of all the models of C-stars and assuming that they are correct, these stars do not belong to the Halo population and they could have formed either on the thick disk or outside the Galaxy (e.g. in the Sagittarius dSph Galaxy). Furthermore, the Halo stars show strong C2H2 molecular absorption bands, typical of low metallicity stars (van Loon et al., 2008) and strong SiC emission, characteristic of more metal rich stars. Since the metallicity of these stars cannot be firmly constrained, we compare their dust-to-gas ratios with the predictions of both the intermediate and low metallicity models. The median value of their dust-to-gas ratios, (), is very similar to that assumed for intermediate metallicity stars, , which we show as a dashed line in the upper right panel. In the same panel the dotted line represents , typical of solar metallicity but sometimes taken as reference also for intermediate metallicities. For we plot the models of initial masses 1.5, 2, 3 and 4 M⊙. For the dashed line represents , obtained by scaling the usual reference value linearly with the metallicity. For we plot the models of 1.25, 2, 3 and 4 M⊙. At these metallicities the trend of increasing with increasing mass loss rate becomes more evident. We also notice that, at decreasing metallicity the dust-to-gas ratios at low mass loss rates decreases while the maximum value, reached at the highest mass loss rates, increases with a global spread of about one order of magnitude. Thus a constant dust-to-gas ratio is not supported by our models. Furthermore our simple random selection process indicates that at low metallicity lower values of are preferred, but these values are still significantly higher than those predicted by a linear scaling with the metallicity. We recall also that at the lowest metallicity the most massive AGB stars undergo a very efficient HBB which inhibits the growth of the carbon excess to large values. This explains why, at , the maximum value reached by the model of 4 M⊙ is significantly lower than those of less massive stars. If we adopt an intermediate metallicity for the Lagadec et al. (2012) C-stars, their dust-to-gas ratios can be fairly well reproduced by our models though, for most of them, there is a significant degeneracy with the initial mass. However at this same metallicity we cannot reproduce the velocities of the Halo stars, while thick disk stars could be compatible with the model of M=1.5 M⊙, as shown in Fig. 16. Halo stars expansion velocities can be reproduced at the lower metallicity only by those models in which the HBB is very efficient, such as that with M=4 M⊙. At this metallicity one should also correct for a H2/CO conversion factor higher than that used by Lagadec et al. (2012). This would shift the data toward higher gas mass loss rates and lower values of as shown by the empty thick triangles in Figs. 15 and 16, obtained adopting an H2/CO factor four times larger than that used by Lagadec et al. (2012). Notice that with this correction the Halo stars are fully compatible, in dust-to-gas ratio, velocities and mass loss rates, with low metallicity models where the growth of carbon excess is inhibited by an efficient HBB. Whether this is a real effect or if it mimics a more general need of reducing the efficiency of carbon dust formation at low metallicity, as suggested by other authors, must be analyzed by means of models that take fully into account the heterogeneous growth of amorphous carbon on metal seeds (van Loon et al., 2008). This is the subject of a forthcoming investigation.
The dust composition of our models can be derived from the condensation fractions plotted in the lower panel of Figs. 11-13. For amorphous silicates, the most abundant dust species in M-giants, we consider the two main components, olivine and pyroxene. Crystalline silicates have also been detected from their MIR features but their abundances are by far less than the corresponding amorphous phase. Though the condensation fractions are plotted separately for olivine and pyroxene, it is not yet possible to quantify their relative abundances observationally.
On the contrary, in the case of C-stars it is possible to derive the relative abundances of the two different main components, SiC an amorphous carbon. Fig. 17 shows the comparison between existing observations of the SiC/C mass ratio and the predictions of our models, for different metallicities. We plot the data for Galactic stars (filled squares) from Groenewegen et al. (1998) together with our models at in the lower right panel and at in the lower left panel, respectively. Data for LMC C-stars (filled small dots) from Groenewegen et al. (2007) are compared with models at in the upper right panel. Finally, the data of Lagadec et al. (2012) (filled triangles for the Halo memberships and large filled dots for the thick disk memberships) are compared with models of low and intermediate metallicity in the upper left and upper right panels, respectively. As can be seen from the figure our models overestimate the observed SiC/C ratios at solar metallicity. Galactic data are mostly concentrated around 0.05-0.1 while our models may reach also SiC/C=1, as shown by the dust-to-gas ratios in Figs. 11-13. Though the comparison improves if we consider a slightly lower metallicity for the Galactic data, , there is an evident over-production of SiC. At the agreement with the observations is only partially better. The majority of the stars have SiC/C=0.02 but also a high uncertainty (Groenewegen et al., 2007). These data are consistent with AGB stars with initial mass M2 M⊙. On the other hand data with values larger than 0.02 are well reproduced by all the other models. In particular the putative thick disk members in the Lagadec et al. (2012) sample (large filled dots) are well reproduced by stars with initial mass M=1.5 M⊙. At the lowest metallicity considered here the predicted SiC/C ratios become negligibly small. A decreasing SiC/C ratio with metallicity is indeed observed through the measure of the strength of the SiC spectral features at 11.3 m. This feature decreases going from the Galaxy to the LMC and to the SMC and other metal poor galaxies of the Local Group (Sloan et al., 2009). In this respect the location of the Halo stars in the panel are surprising, as already noticed by Lagadec et al. (2012).
A noticeable feature emerging from the Galactic sample is that, at increasing mass loss rates, the SiC/C ratios decrease. This trend is shown also by the models. Inspection of our models shows that while carbon dust-to-gas ratio, , continuously increases with the mass loss rate, initially increases and then it remains constant or even decreases. Furthermore, the maximum value reached by the models decreases with the metallicity. While the latter effect is expected if silicon is the key element for the formation of SiC, the global decrease with the mass loss rate is rather an effect of the internal structure and wind dynamics. This is even more evident if we increase the temperature of carbon dust. For the HCT models, where carbon condenses at =1300 K, the picture becomes quite different, as can be seen in Fig. 18. At low mass loss rates the predicted SiC/C ratios are significantly lower than that of LCT models while at high mass loss rates the value remain almost unchanged. This behavior is due to the fact that, at low mass loss rates, the condensation process is very sensitive to the details of the internal structure, because the overall density is lower. Indeed, the large opacity rise due to the condensation of carbon is always accompanied by a strong acceleration of the wind and thus by a significant temperature and a density drop. At lower mass loss rates the global density is lower and an earlier condensation of carbon is enough to inhibit the formation of SiC. On the contrary at high mass loss rates the structure is self-regulating and less dependent on the details of the condensation process. In this case an increase of the carbon condensation temperature has an almost negligible impact on the SiC/C ratios.
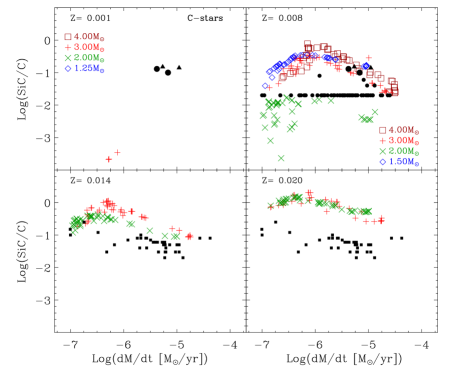
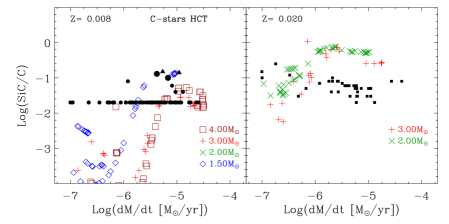
6 Dust ejecta
By integrating the dust mass loss rate along the entire TP-AGB phase we compute dust ejecta for the different masses and metallicities. The ejecta refer to individual stars and they may not be representative of the corresponding dust yields obtained after convolving with the initial mass function. They are provided in Table 1 for both the LCT models (Section 4.3), and for the HCT models (Section 4.4). The above integration is performed irrespective of the ability of dust to drive or not the stellar wind. In fact, we have already stressed that, for silicates and in particular in models with chemisputtering, dust cannot always drive an outflow consistent with the adopted mass loss rate. In these cases we must assume that there exist other possible ways to accelerate the wind, that may finally deliver the material into the ISM (Harper, 1996). However, these phases are characterized by a low dust mass loss rate so that they do not contribute significantly to the total ejecta.
Figure 19 shows the total dust ejecta of the main condensed compounds, silicates, amorphous carbon, Fe and SiC, as a function of the initial stellar mass and for the three metallicities considered here.
We first compare the results of our own models, obtained with the two different formalisms. We remind that, in the case of C-stars, the chemisputtering process is neglected in both schemes (see also FG06) but, as a test case, we have recomputed the models with a higher gas condensation temperature ( 1300 K instead of 1100 K) to check its effect on the total ejecta. These models are plotted as asterisks in the figure and are referred in Table 1 as HCT models. We notice also that, in the case of SiC and Fe, possible differences in the ejecta, between LCT and HCT models, are only an indirect consequence of the variations of the condensation temperatures of silicates and amorphous carbon, because their dust growth schemes do not change.
As for the C-stars, the final dust ejecta mainly consist of amorphous carbon (C in Table 1) and there are not significant differences between LCT and HCT models, at any metallicity. As far as the variation of is concerned, its largest effect is on the ejecta of amorphous carbon but the maximum variation between the models computed with and , at solar metallicity, is only 5%.
Differently, in the case of M-stars, we find that the silicate ejecta of HCT models can be as much as 50 per cent higher compared to the LCT ones. These differences tend to vanish towards the largest mass models, since the condensation fraction of silicates is quite high in both classes of models, mostly due to the large mass loss rates.
Thus we may conclude that, in spite of the differences in velocity, density and temperature profiles brought about by the adoption of either of the two formalisms, their effect on the final dust ejecta is, instead, rather weak.
In the same figure we plot also the results of FG06, Ventura et al. (2012a) and Ventura et al. (2012b), that can be compared to our LCT models. We remark that FG06 TP-AGB models are based on a compilation of analytic relations (partly taken from Marigo et al., 1996) while, Ventura et al. (2012a) and Ventura et al. (2012b) use full numerical calculations along the AGB. The latter models also include the super-AGB stars between 6 M⊙ and 8 M⊙, that have developed an electron-degenerate O-Ne core after the C-burning phase (Siess, 2010).
At low metallicity our results are qualitatively in good agreement with those of FG06, since both studies predict that the bulk of dust produced by low and intermediate mass stars is amorphous carbon. In our models the carbon dust production is even larger than in FG06, by up to a factor of two in some cases.
We emphasize that the TP-AGB models computed by FG06 neglect two important aspects of stellar evolution, namely: the break-down of the core mass-luminosity relation due to HBB in stars with masses M⊙, and the drastic changes in molecular opacities, hence in the effective temperatures, as soon as the C/O ratio increases above unity as a consequence of the third dredge-up. Both factors concur to a likely overestimation of the TP-AGB lifetimes, hence to an over-exposure of the stellar mantle to nucleosynthesis and mixing processes.
Therefore, the FG06 TP-AGB models are, by construction, quite different from the most recent ones of Marigo et al. (2013). The latter models are based on accurate numerical integrations of a complete envelope model in which the HBB energetics and nucleosynthesis are properly taken into account, the initial conditions at the first TP are extracted from the new stellar evolutionary tracks (Bressan et al., 2012), and more importantly, they use new and accurate equation of state and molecular opacities that account for the continuous changes in the surface chemical composition (see Marigo et al. (2013) for more details).
In the models by Ventura et al. (2012a) at , the dust production is about ten times less than in our models. Furthermore, while Ventura et al. (2012a) predict that the dust ejecta are dominated by silicates for stars with M M⊙, in our models the main dust species is amorphous carbon. This difference is likely due to a more efficient third dredge-up in our AGB models at this low metallicity.
At we are again in qualitative good agreement with FG06 because both studies predict that stars with mass below 1.5 M⊙ produce silicate dust, while at larger masses the main dust species is amorphous carbon.
However, while in FG06 models for stars more massive than 5 M⊙ the carbonaceous and silicate dust ejecta are comparable, in our models the ejecta are dominated by silicates. This difference is likely due to a more efficient HBB in our models. We also note that for M⊙, our dust ejecta are roughly 5 times larger than those of FG06.
The comparison with Ventura et al. (2012b) shows again that, for M⊙, our models produce about ten time more dust. Only for M⊙ their dust ejecta become comparable (and sometimes slightly higher) to those of ours models. In Ventura et al. (2012b) silicate dust production becomes efficient above M⊙ whereas, in our models this happens at about M⊙.
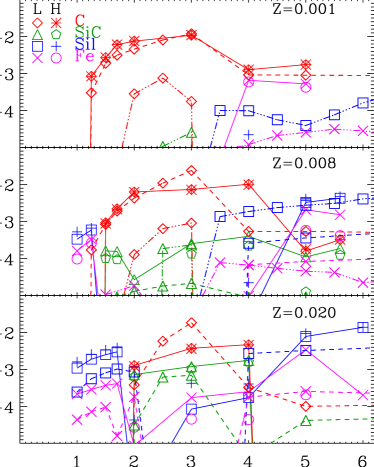
At solar metallicity we can compare our results only with those of FG06. The production of carbon dust is limited to the mass range between 2 M⊙ and 4 M⊙, with a peak at around 3 M⊙, both in our models and in those of FG06. The larger dust ejecta predicted by FG06 are probably due to the larger C/O ratios reached by their TP-AGB models. In fact, FG06 do not account for the cooling effect of the TP-AGB tracks (for C/O) , produced by the C-rich molecular opacities, with consequent shortening of the C-star lifetimes (Marigo, 2002).
Moreover, for M M⊙, our silicate ejecta are roughly a factor of 3 larger than FG06. This may be related to a more efficient HBB in our models, that lowers significantly the carbon content in the CSEs.
| Mi | (age/yr) | Sil | Fe | Al2O3 | C | SiC | |||||
| [M⊙] | (M/M⊙) | ||||||||||
| LCT | HCT | LCT | HCT | LCT | HCT | LCT | HCT | LCT | HCT | ||
| 1.00 | 9.7 | - | - | - | - | ||||||
| 1.25 | 9.5 | - | - | - | - | - | - | ||||
| 1.50 | 9.3 | - | - | - | - | - | - | ||||
| 1.70 | 9.1 | - | - | - | - | - | - | ||||
| 2.00 | 8.9 | - | - | - | - | - | - | ||||
| 3.00 | 8.5 | - | - | - | - | ||||||
| 4.00 | 8.2 | - | |||||||||
| 5.00 | 8.0 | - | - | - | |||||||
| LCT | HCT | LCT | HCT | LCT | HCT | LCT | HCT | LCT | HCT | ||
| 1.00 | 9.9 | - | - | - | - | ||||||
| 1.25 | 9.6 | - | - | - | - | ||||||
| 1.50 | 9.4 | ||||||||||
| 1.70 | 9.3 | - | - | - | - | ||||||
| 2.00 | 9.1 | - | - | - | - | ||||||
| 3.00 | 8.6 | ||||||||||
| 4.00 | 8.3 | ||||||||||
| 5.00 | 8.0 | ||||||||||
| 5.60 | 7.9 | ||||||||||
| LCT | HCT | LCT | HCT | LCT | HCT | LCT | HCT | LCT | HCT | ||
| 1.00 | 10 | - | - | - | - | ||||||
| 1.25 | 9.7 | - | - | - | - | ||||||
| 1.50 | 9.5 | - | - | - | - | ||||||
| 1.70 | 9.4 | - | - | - | - | ||||||
| 2.00 | 9.2 | ||||||||||
| 3.00 | 8.7 | ||||||||||
| 4.00 | 8.3 | ||||||||||
| 5.00 | 8.1 | - | - | - | - | ||||||
| 6.00 | 7.9 | - | - | - | - | ||||||
7 Summary and concluding remarks
In this study we investigate formation, evolution, and mineralogy of the dust grains that are expected to form in the outflows of TP-AGB stars. Following the formalism developed by FG06, a dust-growth model, coupled to a simplified description of the wind dynamics, is applied to the new TP-AGB evolutionary tracks computed by Marigo et al. (2013). The new TP-AGB tracks rely on an accurate treatment of the molecular chemistry and opacities across the stellar envelope and the atmosphere, which are consistently linked to the changes in the chemical abundances caused by the third dredge-up and HBB nucleosynthesis.
We pay particular attention to reproduce the measured expansion velocities and the dust-to-gas ratios of the expanding CSEs around Galactic M and C-stars, and their observed correlations with the mass loss rates.
As far as the M-stars are concerned, we find that our computations, based on the original FG06 formulation for the grain growth, fail the comparison with observations, predicting terminal velocities that are too low.
The cause lies in the inability of iron-rich silicates to form and to keep thermally stable in the inner regions of the CSE, so that the acceleration imparted to the gas only starts at larger distances and it is insufficient to account for the observed expansion velocities.
It must be emphasized that the discrepancy between predicted and measured expansion velocities for M-stars is a well-known fact, and it stems from a more dramatic issue, inherent to the severe inability of detailed dynamical wind models to even generate an outflow from O-rich AGB stars, i.e. to reach dust radiative accelerations larger than the gravitational one (Woitke, 2006).
This challenging problem has been more recently tackled by Höfner (2008b) and Bladh & Höfner (2012); Bladh et al. (2013). These studies point out that a possible way to produce a wind in M-stars may rely on photon scattering by large iron-free silicate grains. Since these grains are transparent to radiation at shorter wavelengths, they can survive in the inner zones of CSE, where they give an efficient boost to the gas thanks to their high scattering opacity.
From all these indications, it is clear that in any case, i.e. for any model, the critical process that should be inhibited is dust destruction in the inner regions of the CSE. Guided by this premise, we have addressed the specific question of predicting higher terminal velocities for the CSEs of M-stars, so as to eventually match the observations. Given that in our model mass loss is assumed and not predicted as in Höfner (2008b), our analysis considers the problem from a different perspective, that is to test the suitability of some physical assumptions, under the working hypothesis that the AGB wind does exist.
We have revisited the two mechanisms that are able to efficiently destroy dust grains, i.e. in order of importance, chemisputtering by H2 molecules and sublimation (Gail & Sedlmayr, 1999). Concerning chemisputtering, we take into account the suggestion of several authors that, considering the activation energy barrier of the reduction reaction of silicates by H2 (Gardner 1974; Tso & Pask 1982; Massieon et al. 1993; Tielens, private communication). the process could be strongly inhibited at the temperatures and pressures of the regions where dust is predicted to form. There is also experimental evidence that, at the pressures typical of a CSE (P 10-2dyne cm-2), chemisputtering may not be efficient (Nagahara & Ozawa, 1996; Tachibana et al., 2002). Furthermore, in recent experiments condensation temperatures of amorphous silicates as high as 1350 K have been measured (Nagahara et al., 2009a).
Therefore, we consider it plausible and instructive examining the case in which the evolution of dust grains is only determined by growth and free sublimation, hence switching chemisputtering off. The rate of sublimation in vacuum, computed following Kobayashi et al. (2011), is used to determine the critical temperature below which dust can grow, as explained in Section 4.4. In this way, we are able to follow the evolution of the condensation temperature in response to changes in the phyiscal properties of the CSEs.
The key point is that, without chemisputtering, the sublimation rates of silicates exceed their growth rates at dust equilibrium temperatures significantly higher than previously assumed. In these HCT models the condensation temperature of olivine is always between 1200 K and 1400 K and the corresponding gas pressure is always between P10-4dyne cm-2 and P10-2dyne cm-2. The values of the condensation temperature are in very good agreement with the recent experimental measurements by Nagahara et al. (2009a) and the value of the pressure corresponds to the condition where chemisputtering should not be efficient (Nagahara & Ozawa, 1996).
By neglecting chemisputtering and including a consistent determination of the condensation temperature, we find that, even assuming an opacity typical of dirty silicates, grains can form and survive in the inner regions of the CSEs (R2 R∗). In these regions the grains quickly grow to large sizes, and provide the gas with the needed acceleration. Our HCT models are able to reproduce fairly well the trend of the velocity with the mass loss rate observed in Galactic M-giants (Fig. 6).
At the lower mass loss rates, a small mismatch remains that may require further investigation. A possibility is that those measured in laboratory evaporation experiments may not represent the effective sticking coefficients that regulate the dust growth in CSEs. For instance, Nagahara & Ozawa (1996) noticed that the measured sticking coefficients refer to the crystalline structure used in the experiments, and that different structures could have different energy barriers for the formation reactions, implying different values of the sticking coefficient. Other authors have investigated the effects of increasing this coefficient up to 0.5 (Ventura et al., 2012a) for pyroxene, or even 1.0 for olivine (Höfner, 2008a). We find that just increasing the sticking coefficient of silicates to is enough to eliminate the residual discrepancy between observed and predicted terminal velocities of M-giants. Another possibility could be that of decreasing the number of initial seeds in order to reach larger grain sizes that provide a higher opacity. Lowering the seed number from 10-13 to 10-14, the maximum grain sizes increase from 0.1 m to 0.3 m, succeeding in reproducing the observed terminal velocities also for iron-free silicates, as shown in Fig. 7.
The predicted dust-to-gas ratios of M-giants are within the observed range. However though the models cluster around , which is the value usually adopted for Galactic AGB stars, the observed sample has a median value about 50% larger, . Furthermore our models never reach the highest measured values. They also follow the usual linear scaling at decreasing metallicity, clustering around for but again, the few direct data available for LMC M-giants, indicate that their dust content is more than twice that of our models.
As far as C-star models are concerned, they reproduce fairly well the observed expansion velocities of Galactic C-stars. In the homogeneous growth scheme, at the base of our carbon dust formation model, the key role is played by the carbon over oxygen excess (Mattsson et al., 2010). This parameter is mainly determined by the complex interplay between mass loss, third dredge-up and HBB. For example, we have shown that delaying the super-wind phase without suitably lowering the efficiency of the third dredge-up, the carbon enrichment at the surface would be larger, and consequently the terminal velocities would be higher. We have also shown that varying the sticking coefficient of carbon can induce some degeneracy with the metallicity but, unless one assumes a very low value (0.1), the velocities of Galactic C-stars can be well reproduced. We compare the dust-to-gas ratios of the C-star models with three different Galactic samples. Contrary to those of M-giant models which show little dependence on the mass loss rates, those of C-stars increase at increasing mass loss rates. This trend is present only in one of the three samples Groenewegen et al. (1998) while it is absent in the other two. At low mass loss rates the median values of the three samples are similar and they are reproduced by our models. At the high mass loss rates the models are not able to reproduce the largest observed values. We notice also that the maximum mass loss rate obtained by our models is about 2-3 times lower than the maximum observed one.
The coupling of the homogeneous growth scheme to our AGB models gives rise to the following trends with decreasing metallicity. The velocities at a given mass loss rate increase, the dependence of the dust-to-gas ratios on the mass loss rate becomes stronger but their values at low mass loss rates decrease. Unfortunately, in spite of the huge literature on C-stars at metallicities lower than solar, there is a severe lack of direct measurements of dust-to-gas ratio and terminal velocities. The velocities of six C-stars toward the Galactic Halo (Lagadec et al., 2012) are clearly significantly lower than those of the bulk of our models at and even at . However, for the three objects likely belonging to the thick disk, we can reproduce dust-to-gas ratios and velocities with C-stars of and M=1.5 M⊙. For the other three stars, that were classified as Halo members, the data can be reconciled with models with and M4 M⊙, where the carbon excess is lowered by an efficient HBB. This value for the mass is somewhat higher than that estimated by (Lagadec et al., 2012), on the basis of their luminosity (M2-3 M⊙). Furthermore, and perhaps more important, the particularly strong equivalent width of their 7.5 m C2H2 feature is difficult to reconcile with a relatively lower carbon excess. This could be an indication that the efficiency of carbon dust formation decreases at decreasing metallicity as suggested by van Loon et al. (2008). Whether the efficiency becomes lower by assuming an heterogeneous nucleation on metallic seeds (TiC, ZrC and MoC) needs still to be investigated.
For C-stars we have also compared the predicted abundance ratios of SiC relative to carbon, with the observations. At solar metallicity our LCT models predict values that are significantly higher than those observed among Galactic C-stars while at intermediate metallicity the agreement is fairly good. The three Halo stars at low metallicity have measured SiC/C ratios that are too high with respect to our models. But this is more likely a intriguing problem related to their origin because the mid infrared SiC feature is observed to decrease significantly at decreasing metallicity. In any case the SiC/C ratio may depend on effects other than the global metallicity or the carbon excess. For example, we have shown that increasing the condensation temperature of carbon, lowers significantly the SiC/C ratios of models with moderate and low mass loss rates.
Our simple models provide a powerful check of the internal processes that regulate the evolution of TP-AGB stars, that should be added to all other existing observable tests used to calibrate this important phase of stellar evolution.
In this work we also present new dust ejecta of TP-AGB stars, computed for three initial metallicities, , and , and a few values of the initial mass, from 1 M⊙ to M⊙.
At low metallicity, the bulk of the dust consists of amorphous carbon, whereas, at increasing metallicity, the range of initial stellar masses producing this dust species is limited between 2 M⊙ and 4 M⊙ at . Silicate dust production dominates at lower masses due to weak or absent dredge-up and, at higher masses, because of efficient HBB. The ejecta depend weakly on the details of the adopted condensation prescriptions. This is true not only for silicate dust, but also for carbon dust as demonstrated with the aid of test calculations in which we artificially increased the gas temperature threshold for the activation of the C2H2 chains.
Differently, the results do depend on the underlying TP-AGB evolutionary models. In particular, a sizeable discrepancy affects the predictions for the carbon dust production at low metallicity, between Ferrarotti & Gail (2006) and our new results based on the COLIBRI code on one side, and the results of Ventura et al. (2012a) on the other side. Furthermore, silicate ejecta computed with the COLIBRI code are significantly larger than those of Ferrarotti & Gail (2006) and Ventura et al. (2012a). For C-stars these differences are related to our poor understanding of the mass loss and third dredge-up processes, since their ill-determined efficiency affects dramatically the surface C/O ratio. Differences in silicate ejecta are more subtly related also to initial metal partitions and adopted opacities, so that it is difficult to trace back their origin.
In both full evolutionary TP-AGB models (Ventura et al., 2012a), and TP-AGB models based on numerical envelope integrations (Marigo et al., 2013) mass loss and third dredge-up are described by means of suitable parameters. For mass loss, both models use empirical laws taken from the literature, while the third dredge-up is regulated by a parametrized efficiency of convective overshoot in full models, or directly described by its efficiency parameter in envelope-based models. How these parameters depend on the ambient metallicity is one of the far-reaching questions, that are crucial for the interpretation of extragalactic observations up to high redshift.
Indeed, the major aim of the COLIBRI code, together with the piece of work presented here, is to provide a fast and flexible tool able to put different observations inside a common interpretative framework. In this respect, the dust formation scheme described here will be soon applied to study the emission properties of the circumstellar dusty envelopes (Bressan et al., 1998; Marigo et al., 2008).
Acknowledgements
We thank the referee, Jacco van Loon, for his careful reading of the manuscript and his many suggestions that helped us to improve the paper. We also thank L. Danese, A. Tielens, H. Kobayashi, I. Cherchneff and L. Agostini for the fruitful discussions. We acknowledge financial support from contract ASI-INAF I/009/10/0, and from the Progetto di Ateneo 2012, CPDA125588/12 funded by the University of Padova. AB acknowledges financial support from MIUR 2009.
References
- Anders & Grevesse (1989) Anders E., Grevesse N., 1989, Geochim. Cosmochim. Acta, 53, 197
- Barin & Platzki (1995) Barin I., Platzki G., 1995, Thermochemical data of pure substances. No. v. 1 in Thermochemical Data of Pure Substances, VCH
- Bedijn (1988) Bedijn P. J., 1988, A&A, 205, 105
- Beelen et al. (2006) Beelen A., Cox P., Benford D. J., Dowell C. D., Kovács A., Bertoldi F., Omont A., Carilli C. L., 2006, ApJ, 642, 694
- Begemann et al. (1997) Begemann B., Dorschner J., Henning T., Mutschke H., Guertler J., Koempe C., Nass R., 1997, ApJ, 476, 199
- Bell & Lin (1994) Bell K. R., Lin D. N. C., 1994, ApJ, 427, 987
- Bergeat & Chevallier (2005) Bergeat J., Chevallier L., 2005, A&A, 429, 235
- Bernatowicz et al. (1996) Bernatowicz T. J., Cowsik R., Gibbons P. C., Lodders K., Fegley Jr. B., Amari S., Lewis R. S., 1996, ApJ, 472, 760
- Bertoldi et al. (2003) Bertoldi F., Cox P., Neri R., Carilli C. L., Walter F., Omont A., Beelen A., Henkel C., Fan X., Strauss M. A., Menten K. M., 2003, A&A, 409, L47
- Bladh & Höfner (2012) Bladh S., Höfner S., 2012, A&A, 546, A76
- Bladh et al. (2013) Bladh S., Höfner S., Nowotny W., Aringer B., 2013, ArXiv e-prints
- Bowen & Willson (1991) Bowen G. H., Willson L. A., 1991, ApJ, 375, L53
- Boyer (2013) Boyer M. L., 2013, Astronomische Nachrichten, 334, 124
- Boyer et al. (2012) Boyer M. L., Srinivasan S., Riebel D., McDonald I., van Loon J. T., Clayton G. C., Gordon K. D., Meixner M., Sargent B. A., Sloan G. C., 2012, ApJ, 748, 40
- Bressan et al. (1998) Bressan A., Granato G. L., Silva L., 1998, A&A, 332, 135
- Bressan et al. (2012) Bressan A., Marigo P., Girardi L., Salasnich B., Dal Cero C., Rubele S., Nanni A., 2012, MNRAS, 427, 127
- Caffau et al. (2011) Caffau E., Ludwig H.-G., Steffen M., Freytag B., Bonifacio P., 2011, Sol. Phys., 268, 255
- Calura et al. (2008) Calura F., Pipino A., Matteucci F., 2008, A&A, 479, 669
- Cherchneff (2000) Cherchneff I., 2000, in Wing R. F., ed., The Carbon Star Phenomenon Vol. 177 of IAU Symposium. p. 331
- Cherchneff (2006) Cherchneff I., 2006, A&A, 456, 1001
- Cherchneff (2011) Cherchneff I., 2011, A&A, 526, L11
- Cherchneff (2012) Cherchneff I., 2012, A&A, 545, A12
- Cherchneff et al. (1992) Cherchneff I., Barker J. R., Tielens A. G. G. M., 1992, ApJ, 401, 269
- Croat et al. (2005) Croat T. K., Stadermann F. J., Bernatowicz T. J., 2005, ApJ, 631, 976
- Dorschner et al. (1995) Dorschner J., Begemann B., Henning T., Jaeger C., Mutschke H., 1995, A&A, 300, 503
- Draine (2003) Draine B. T., 2003, ARA&A, 41, 241
- Duschl et al. (1996) Duschl W. J., Gail H.-P., Tscharnuter W. M., 1996, A&A, 312, 624
- Dwek (1998) Dwek E., 1998, ApJ, 501, 643
- Dwek & Cherchneff (2011) Dwek E., Cherchneff I., 2011, ApJ, 727, 63
- Dwek et al. (2007) Dwek E., Galliano F., Jones A. P., 2007, Nuovo Cimento B Serie, 122, 959
- Eales et al. (2000) Eales S., Lilly S., Webb T., Dunne L., Gear W., Clements D., Yun M., 2000, AJ, 120, 2244
- Elitzur & Ivezić (2001) Elitzur M., Ivezić Ž., 2001, MNRAS, 327, 403
- Ferrarotti & Gail (2006) Ferrarotti A. S., Gail H.-P., 2006, A&A, 447, 553
- Fleischer et al. (1991) Fleischer A. J., Gauger A., Sedlmayr E., 1991, A&A, 242, L1
- Gail (2010) Gail H.-P., 2010, in Henning T., ed., Lecture Notes in Physics, Berlin Springer Verlag Vol. 815 of Lecture Notes in Physics, Berlin Springer Verlag, Formation and Evolution of Minerals in Accretion Disks and Stellar Outflows. pp 61–141
- Gail & Sedlmayr (1986) Gail H.-P., Sedlmayr E., 1986, A&A, 166, 225
- Gail & Sedlmayr (1988) Gail H.-P., Sedlmayr E., 1988, A&A, 206, 153
- Gail & Sedlmayr (1998) Gail H.-P., Sedlmayr E., 1998, Faraday Discussions, 109, 303
- Gail & Sedlmayr (1999) Gail H.-P., Sedlmayr E., 1999, A&A, 347, 594
- Gall et al. (2011) Gall C., Andersen A. C., Hjorth J., 2011, A&A, 528, A14
- Gardner (1974) Gardner R. A., 1974, Journal of solid state chemistry, 9, 336
- Gehrz (1989) Gehrz R., 1989, in Allamandola L. J., Tielens A. G. G. M., eds, Interstellar Dust Vol. 135 of IAU Symposium. p. 445
- Girardi et al. (2010) Girardi L., Williams B. F., Gilbert K. M., Rosenfield P., Dalcanton J. J., Marigo P., Boyer M. L., Dolphin A., Weisz D. R., Melbourne J., Olsen K. A. G., Seth A. C., Skillman E., 2010, ApJ, 724, 1030
- González Delgado et al. (2003) González Delgado D., Olofsson H., Kerschbaum F., Schöier F. L., Lindqvist M., Groenewegen M. A. T., 2003, A&A, 411, 123
- Goumans & Bromley (2012) Goumans T. P. M., Bromley S. T., 2012, MNRAS, 420, 3344
- Groenewegen & de Jong (1998) Groenewegen M. A. T., de Jong T., 1998, A&A, 337, 797
- Groenewegen et al. (2009) Groenewegen M. A. T., Sloan G. C., Soszyński I., Petersen E. A., 2009, A&A, 506, 1277
- Groenewegen et al. (1998) Groenewegen M. A. T., Whitelock P. A., Smith C. H., Kerschbaum F., 1998, MNRAS, 293, 18
- Groenewegen et al. (2007) Groenewegen M. A. T., Wood P. R., Sloan G. C., Blommaert J. A. D. L., Cioni M.-R. L., Feast M. W., Hony S., Matsuura M., Menzies J. W., Olivier E. A., Vanhollebeke E., van Loon J. T., Whitelock P. A., Zijlstra A. A., Habing H. J., Lagadec E., 2007, MNRAS, 376, 313
- Harper (1996) Harper G., 1996, in Pallavicini R., Dupree A. K., eds, Cool Stars, Stellar Systems, and the Sun Vol. 109 of Astronomical Society of the Pacific Conference Series. p. 481
- Helling & Woitke (2006) Helling C., Woitke P., 2006, A&A, 455, 325
- Höfner (2008a) Höfner S., 2008a, Physica Scripta Volume T, 133, 014007
- Höfner (2008b) Höfner S., 2008b, A&A, 491, L1
- Höfner (2009) Höfner S., 2009, in Henning T., Grün E., Steinacker J., eds, Cosmic Dust - Near and Far Vol. 414 of Astronomical Society of the Pacific Conference Series. p. 3
- Höfner et al. (2003) Höfner S., Gautschy-Loidl R., Aringer B., Jørgensen U. G., 2003, A&A, 399, 589
- Hoyle & Wickramasinghe (1991) Hoyle F., Wickramasinghe N., 1991, The Theory of Cosmic Grains. Astrophysics and space science library, Kluwer Academic
- Hynes et al. (2007) Hynes K. M., Croat T. K., Bernatowicz T. J., 2007, in Lunar and Planetary Institute Science Conference Abstracts Vol. 38 of Lunar and Planetary Institute Science Conference Abstracts, Microstructure of Silicon Carbides Found Within Presolar Graphite. p. 1693
- Ireland & Scholz (2006) Ireland M. J., Scholz M., 2006, MNRAS, 367, 1585
- Jäger et al. (2003) Jäger C., Dorschner J., Mutschke H., Posch T., Henning T., 2003, A&A, 408, 193
- Jeong et al. (2003) Jeong K. S., Winters J. M., Le Bertre T., Sedlmayr E., 2003, A&A, 407, 191
- Jones & Merrill (1976) Jones T. W., Merrill K. M., 1976, ApJ, 209, 509
- Kamath et al. (2011) Kamath D., Wood P. R., Soszyński I., Lebzelter T., 2011, in Kerschbaum F., Lebzelter T., Wing R. F., eds, Why Galaxies Care about AGB Stars II: Shining Examples and Common Inhabitants Vol. 445 of Astronomical Society of the Pacific Conference Series. p. 127
- Karakas et al. (2002) Karakas A. I., Lattanzio J. C., Pols O. R., 2002, PASA, 19, 515
- Kimura et al. (2002) Kimura H., Mann I., Biesecker D. A., Jessberger E. K., 2002, Icarus, 159, 529
- Klotz et al. (2013) Klotz D., Paladini C., Hron J., Aringer B., Sacuto S., Marigo P., Verhoelst T., 2013, ArXiv e-prints
- Knapp (1985) Knapp G. R., 1985, ApJ, 293, 273
- Kobayashi et al. (2011) Kobayashi H., Kimura H., Watanabe S.-I., Yamamoto T., Müller S., 2011, Earth, Planets, and Space, 63, 1067
- Kobayashi et al. (2009) Kobayashi H., Watanabe S.-I., Kimura H., Yamamoto T., 2009, Icarus, 201, 395
- Krueger et al. (1996) Krueger D., Patzer A. B. C., Sedlmayr E., 1996, A&A, 313, 891
- Lagadec et al. (2012) Lagadec E., Sloan G. C., Zijlstra A. A., Mauron N., Houck J. R., 2012, MNRAS, 427, 2588
- Lambert (1978) Lambert D. L., 1978, MNRAS, 182, 249
- Lambert et al. (1986) Lambert D. L., Gustafsson B., Eriksson K., Hinkle K. H., 1986, ApJS, 62, 373
- Lamers & Cassinelli (1999) Lamers H. J. G. L. M., Cassinelli J. P., 1999, Introduction to Stellar Winds
- Landolt-Börnstein (1968) Landolt-Börnstein 1968, In: Schäfer K. (ed.) Zahlenwerte und Funktionen.. No. v. 5b in Zahlenwerte und Funktionen, Springer-Verlag, Heidelberg
- Le Sidaner & Le Bertre (1996) Le Sidaner P., Le Bertre T., 1996, A&A, 314, 896
- Leksina & Penkina (1967) Leksina I., Penkina N., 1967, Fizik. Metall. Metalloved., 23, 344
- Lilly et al. (1999) Lilly S. J., Eales S. A., Gear W. K. P., Hammer F., Le Fèvre O., Crampton D., Bond J. R., Dunne L., 1999, ApJ, 518, 641
- Lodders & Fegley (1999) Lodders K., Fegley Jr. B., 1999, in Le Bertre T., Lèbre A., Waelkens C., eds, Asymptotic Giant Branch Stars Vol. 191 of IAU Symposium. p. 279
- Loup et al. (1993) Loup C., Forveille T., Omont A., Paul J. F., 1993, A&AS, 99, 291
- Lucy (1971) Lucy L. B., 1971, ApJ, 163, 95
- Lucy (1976) Lucy L. B., 1976, ApJ, 205, 482
- Maiolino et al. (2004) Maiolino R., Schneider R., Oliva E., Bianchi S., Ferrara A., Mannucci F., Pedani M., Roca Sogorb M., 2004, Nature, 431, 533
- Marchenko (2006) Marchenko S. V., 2006, in Lamers H. J. G. L. M., Langer N., Nugis T., Annuk K., eds, Stellar Evolution at Low Metallicity: Mass Loss, Explosions, Cosmology Vol. 353 of Astronomical Society of the Pacific Conference Series. p. 299
- Marigo (2002) Marigo P., 2002, A&A, 387, 507
- Marigo & Aringer (2009) Marigo P., Aringer B., 2009, A&A, 508, 1539
- Marigo et al. (1996) Marigo P., Bressan A., Chiosi C., 1996, A&A, 313, 545
- Marigo et al. (2013) Marigo P., Bressan A., Nanni A., Girardi L., Pumo M. L., 2013, ArXiv e-prints
- Marigo & Girardi (2007) Marigo P., Girardi L., 2007, A&A, 469, 239
- Marigo et al. (2008) Marigo P., Girardi L., Bressan A., Groenewegen M. A. T., Silva L., Granato G. L., 2008, A&A, 482, 883
- Marshall et al. (2004) Marshall J. R., van Loon J. T., Matsuura M., Wood P. R., Zijlstra A. A., Whitelock P. A., 2004, MNRAS, 355, 1348
- Massieon et al. (1993) Massieon C. C., Cutler A. H., Shadman F., 1993, Industrial and Engineering Chemistry Research, 32, 1239
- Mathis et al. (1977) Mathis J. S., Rumpl W., Nordsieck K. H., 1977, ApJ, 217, 425
- Matsuura et al. (2009) Matsuura M., Barlow M. J., Zijlstra A. A., Whitelock P. A., Cioni M.-R. L., Groenewegen M. A. T., Volk K., Kemper F., Kodama T., Lagadec E., Meixner M., Sloan G. C., Srinivasan S., 2009, MNRAS, 396, 918
- Matsuura et al. (2012) Matsuura M., Woods P. M., Owen P. J., 2012, MNRAS, p. 434
- Mattsson (2010) Mattsson L., 2010, A&A, 515, A68
- Mattsson et al. (2010) Mattsson L., Wahlin R., Höfner S., 2010, A&A, 509, A14
- Michałowski et al. (2011) Michałowski M. J., Murphy E. J., Hjorth J., Watson D., Gall C., Dunlop J. S., 2011, in Wang W., Lu J., Luo Z., Yang Z., Hua H., Chen Z., eds, Galaxy Evolution: Infrared to Millimeter Wavelength Perspective Vol. 446 of Astronomical Society of the Pacific Conference Series. p. 387
- Nagahara et al. (2009a) Nagahara H., Ogawa R., Ozawa K., Tamada S., Tachibana S., Chiba H., 2009a, in Henning T., Grün E., Steinacker J., eds, Cosmic Dust - Near and Far Vol. 414 of Astronomical Society of the Pacific Conference Series. p. 403
- Nagahara et al. (2009b) Nagahara H., Ogawa R., Ozawa K., Tamada S., Tachibana S., Chiba H., 2009b, in Henning T., Grün E., Steinacker J., eds, Cosmic Dust - Near and Far Vol. 414 of Astronomical Society of the Pacific Conference Series, Laboratory Condensation and Reaction of Silicate Dust. p. 403
- Nagahara & Ozawa (1996) Nagahara H., Ozawa K., 1996, Geochim. Cosmochim. Acta, 60, 1445
- Norris et al. (2012) Norris B. R. M., Tuthill P. G., Ireland M. J., Lacour S., Zijlstra A. A., Lykou F., Evans T. M., Stewart P., Bedding T. R., Guyon O., Martinache F., 2012, in Society of Photo-Optical Instrumentation Engineers (SPIE) Conference Series Vol. 8445 of Society of Photo-Optical Instrumentation Engineers (SPIE) Conference Series
- Nozawa et al. (2003) Nozawa T., Kozasa T., Umeda H., Maeda K., Nomoto K., 2003, ApJ, 598, 785
- Ossenkopf et al. (1992) Ossenkopf V., Henning T., Mathis J. S., 1992, A&A, 261, 567
- Pègouriè (1988) Pègouriè B., 1988, A&A, 194, 335
- Piovan et al. (2011a) Piovan L., Chiosi C., Merlin E., Grassi T., Tantalo R., Buonomo U., Cassarà L. P., 2011a, ArXiv e-prints
- Piovan et al. (2011b) Piovan L., Chiosi C., Merlin E., Grassi T., Tantalo R., Buonomo U., Cassarà L. P., 2011b, ArXiv e-prints
- Pipino et al. (2011) Pipino A., Fan X. L., Matteucci F., Calura F., Silva L., Granato G., Maiolino R., 2011, A&A, 525, A61
- Pipino & Matteucci (2011) Pipino A., Matteucci F., 2011, A&A, 530, A98
- Råback (1999) Råback P., 1999, Modeling of the Sublimation Growth of Silicon Carbide Crystals. CSC research reports: Centre for Scientific Computing, Center for Scientific Computing
- Robson et al. (2004) Robson I., Priddey R. S., Isaak K. G., McMahon R. G., 2004, MNRAS, 351, L29
- Sargent et al. (2010) Sargent B. A., Srinivasan S., Meixner M., Kemper F., Tielens A. G. G. M., Speck A. K., Matsuura M., Bernard J.-P., Hony S., Gordon K. D., Indebetouw R., Marengo M., Sloan G. C., Woods P. M., 2010, ApJ, 716, 878
- Schöier et al. (2013) Schöier F. L., Ramstedt S., Olofsson H., Lindqvist M., Bieging J. H., Marvel K. B., 2013, A&A, 550, A78
- Schröder & Cuntz (2005) Schröder K.-P., Cuntz M., 2005, ApJ, 630, L73
- Sharp & Huebner (1990) Sharp C. M., Huebner W. F., 1990, ApJS, 72, 417
- Siess (2010) Siess L., 2010, A&A, 512, A10
- Sloan et al. (2009) Sloan G. C., Matsuura M., Zijlstra A. A., Lagadec E., Groenewegen M. A. T., Wood P. R., Szyszka C., Bernard-Salas J., van Loon J. T., 2009, Science, 323, 353
- Sugerman et al. (2006) Sugerman B. E. K., Ercolano B., Barlow M. J., Tielens A. G. G. M., Clayton G. C., Zijlstra A. A., Meixner M., Speck A., Gledhill T. M., Panagia N., Cohen M., Gordon K. D., Meyer M., Fabbri J., Bowey J. E., Welch D. L., Regan M. W., Kennicutt R. C., 2006, Science, 313, 196
- Tachibana et al. (2002) Tachibana S., Tsuchiyama A., Nagahara H., 2002, Geochim. Cosmochim. Acta, 66, 713
- Tielens et al. (1998) Tielens A. G. G. M., Waters L. B. F. M., Molster F. J., Justtanont K., 1998, Ap&SS, 255, 415
- Todini & Ferrara (2001) Todini P., Ferrara A., 2001, MNRAS, 325, 726
- Tso & Pask (1982) Tso S. T., Pask J. A., 1982, Journal of the American Ceramic Society, 65, 457
- Valiante et al. (2009) Valiante R., Schneider R., Bianchi S., Andersen A. C., 2009, MNRAS, 397, 1661
- Valiante et al. (2011) Valiante R., Schneider R., Salvadori S., Bianchi S., 2011, MNRAS, 416, 1916
- van der Veen & Rugers (1989) van der Veen W. E. C. J., Rugers M., 1989, A&A, 226, 183
- van Loon (2000) van Loon J. T., 2000, A&A, 354, 125
- van Loon et al. (2005) van Loon J. T., Cioni M.-R. L., Zijlstra A. A., Loup C., 2005, A&A, 438, 273
- van Loon et al. (2008) van Loon J. T., Cohen M., Oliveira J. M., Matsuura M., McDonald I., Sloan G. C., Wood P. R., Zijlstra A. A., 2008, A&A, 487, 1055
- Vassiliadis & Wood (1993) Vassiliadis E., Wood P. R., 1993, ApJ, 413, 641
- Ventura et al. (2012a) Ventura P., Criscienzo M. D., Schneider R., Carini R., Valiante R., D’Antona F., Gallerani S., Maiolino R., Tornambé A., 2012a, MNRAS, 424, 2345
- Ventura et al. (2012b) Ventura P., Criscienzo M. D., Schneider R., Carini R., Valiante R., D’Antona F., Gallerani S., Maiolino R., Tornambé A., 2012b, MNRAS, 424, 2345
- Winters et al. (2000) Winters J. M., Le Bertre T., Jeong K. S., Helling C., Sedlmayr E., 2000, A&A, 361, 641
- Woitke (2006) Woitke P., 2006, A&A, 460, L9
- Woods et al. (2012) Woods P. M., Walsh C., Cordiner M. A., Kemper F., 2012, MNRAS, 426, 2689
- Yamasawa et al. (2011) Yamasawa D., Habe A., Kozasa T., Nozawa T., Hirashita H., Umeda H., Nomoto K., 2011, ApJ, 735, 44
- Zhukovska et al. (2008) Zhukovska S., Gail H.-P., Trieloff M., 2008, A&A, 479, 453