Galaxy Clusters in the Line of Sight to Background Quasars - III Multi-Object Spectroscopy1
Abstract
We present Gemini/GMOS-S multi-object spectroscopy of 31 galaxy cluster candidates at redshifts between 0.2 and 1.0 and centered on QSO sight-lines taken from López et al. (2008). The targets were selected based on the presence of a intervening Mg II absorption system at a similar redshift to that of a galaxy cluster candidate lying at a projected distance 2 Mpc from the QSO sight-line (a “photometric-hit”). The absorption systems span rest-frame equivalent widths between 0.015 and 2.028 Å. Our aim was 3-fold: 1) identify the absorbing galaxies and determine their impact parameters, 2) confirm the galaxy cluster candidates in the vicinity of each quasar sightline, and 3) determine whether the absorbing galaxies reside in galaxy clusters. In this way we are able to characterize the absorption systems associated with cluster members. Our main findings are: 1) the identification of 10 out of 24 absorbing galaxies with redshifts between , up to an impact parameter of kpc and a maximum velocity difference of km/s. 2) The spectroscopic confirmation of 20 out of 31 cluster/group candidates, with most of the confirmed clusters/groups at . This relatively low efficiency results from the fact that we centered our observations on the QSO location, and thus occasionally some of the cluster centers were outside the instrument FOV. 3) Following from the results above, the spectroscopic confirmation of 10 out of 14 photometric hits within 650 km/s from galaxy clusters/groups, in addition to 2 new ones related to galaxy group environments. These numbers imply efficiencies of 71% in finding such systems with MOS spectroscopy. This is a remarkable result since we defined a photometric hit as those cluster-absorber pairs having a redshift difference .
The general population of our confirmed absorbing galaxies have luminosities and mean rest-frame colors () typical of Scd galaxies. From this sample, absorbing cluster-galaxies hosting weak absorbers are consistent with lower star formation activity than the rest, which produce strong absorption and agree with typical Mg II absorbing galaxies found in the literature. Our spectroscopic confirmations lend support to the selection of photometric hits made in López et al. (2008).
Subject headings:
cosmology: observations—intergalactic medium—quasars: absorption lines1. INTRODUCTION
Galaxies hosting Mg II absorption systems seen in the spectra of background QSOs (hereafter Mg II absorbing galaxies) appear to be a quite heterogeneous sample at 1. They span a rather broad range of spectral types and brightness, but concentrate towards high luminosities () with colors and spectral features typical of Sb or Sc spiral field galaxies (e.g., Zibetti et al., 2007), lying at impact parameters 40–100 kpc from the quasar sight-line (Steidel, Dickinson & Persson, 1994; Lindner, Alvensleben & Fricke, 1996; Churchill et al., 2005; Kacprzak et al., 2005, 2007; Chen et al., 2010).
Models assuming that absorbing gas resides within galactic haloes are in general agreement with observable data available for Mg II absorbers (Steidel et al., 2002; Lin & Zou, 2001). However, the very origin of these absorption systems (e.g., whether the absorptions are specifically produced in the disk or halo, by SN II ejecta, gas accretion, stripped gas, stellar outflows, etc.) has not yet been well established.
Correlations between Mg II absorption strength and galactic halo masses (Bouché et al., 2006; Gauthier, Chen & Tinker, 2009) or galaxy type (Zibetti et al., 2007; Rubin et al., 2010; Ménard et al., 2011) have been thoroughly studied, and suggest a link between Mg II absorber intensities and the star formation in their host galaxies. However, such studies have mostly considered strong Mg II absorbers ( 1.0 Å). Thus, we are still lacking larger galaxy surveys that include weak Mg II absorption systems (i.e., 0.3 Å).
Furthermore, despite some Mg II systems having been found to populate galaxy group or cluster environments (Bechtold & Ellingson, 1992; Steidel & Dickinson, 1992; Bowen, Blades & Pettini, 1995; Churchill & Charlton, 1998; Chen et al., 2010; Gauthier, 2013), no studies have searched for galaxy group environments in a systematic fashion.
The Quasars behind Clusters project (QbC) (López et al., 2008, hereafter Paper I) is the first Mg II survey designed to specifically target galaxy cluster/group environments, Mg II systems are sought in lines-of-sight (LOS) towards quasars known to intersect galaxy cluster/group candidates at photometric redshifts 0.2–0.9 drawn from the Red-Sequence Cluster Survey 1 (RCS1, Gladders & Yee, 2000). Using a sample of 400 QSO-cluster pairs at cluster-centric projected distances 2 Mpc, López et al. (2008) detected differences between the number density of absorbers most probably located in galaxy cluster/group environments and those related to the field. While the strongest Mg II systems ( 2 Å) were found to be up to 10 times more abundant in clusters than those produced in the field, weak Mg II systems ( 0.3 Å) did not show a similar excess. The proposed explanation for this signal was that weak systems should occur in galactic haloes that have been truncated due to environmental effects, i.e. galaxy harassment or ram pressure stripping. This interpretation was later used by Padilla et al. (2009, PaperII) to put constraints on the sizes of baryonic haloes around cluster galaxies.
The association between Mg II absorptions and galaxy cluster/group candidates in Paper I is subject to uncertainties in the photometric redshifts of cluster/group candidates, from which the cluster redshift path of the survey was derived. Therefore it becomes necessary to reduce the photometric redshift uncertainties of the clusters, in order to establish better the relation between absorbers and their environment.
The work presented here is based on Gemini/GMOS - S MOS observations of 31 cluster candidates drawn from Paper I. Our aim is 3-fold: 1) find the Mg II absorbing galaxies and calculate their LOS impact parameters, 2) verify the overabundance of galaxies in the vicinity of each quasar sight-line due to the presence of clusters of galaxies and 3) determine whether the absorbing galaxies reside in galaxy clusters or not.
This paper is organized as follows: in section 2 we describe our data and the details of the spectroscopic observations and reduction steps for a sample of 23 Mg II systems. Results are given in 3, specifically the detection of absorbing galaxies and a general view of their properties is presented in 3.1; the spectroscopic confirmation of cluster/group candidates is detailed in 3.2 (with the caveat of having a QSO in the middle of the field limits the ability of confirming clusters); the confirmation of spectroscopic hits is presented in 3.3. A discussion of our results and their implications is given in 4; our concluding remarks are outlined in 5. The cosmological parameters adopted in this study are 0.27, 0.73 and 71 km s Mpc-1.
2. DATA
In Paper I, the matching of a Mg II system to the presence of a galaxy cluster candidate, was termed a photometric hit. Explicitly, for a Mg II absorbing system at , a photometric hit was defined as where and , the photometric redshift of a RCS1 cluster/group candidate with a redshift uncertainty . We set , except where . is the minimum redshift at which a system with 0.05 Å could be detected as a 3 detection; in these cases was set to .
The spectroscopic confirmation of RCS1 cluster/group candidates leads to a new definition of a spectroscopic hit. By definition, a spectroscopic hit corresponds to a Mg II absorption (assumed to originate in a galactic halo) located in the environment of a spectroscopically confirmed galaxy cluster.
2.1. Region selection
Our data consist of multi-object spectroscopy covering 9 fields centered on different quasar sight-lines, each one presenting one or more photometric hits.
These LOS were drawn from a list of photometric hits presented in Paper I, detected in high resolution spectroscopic data using MIKE echelle spectrograph mounted on the 6.5m Magellan telescope at Las Campanas Observatory. In this sample, Mg II absorption systems were detected at a 3 detection level in both doublet lines and have an uncertainty 10-4 (see Paper I for further details). Spanning a wide range of absorption redshifts (0.2507 1.0951) and rest-frame equivalent widths (0.015 2.028 Å), they are representative of the high resolution sample in Paper I.
The sample of galaxy cluster/group candidates lying at cluster-centric projected distances 2 Mpc from the quasar sight-lines consists of 31 candidates with photometric redshifts between 0.173 1.032 and richness parameters 1037 (with a mean value 346; more details in 3.2). These fields were available for observations during the second semester of 2008.
Table 1 shows the Mg II absorption systems and the number of RCS1 cluster/group candidates lying at a cluster-centric impact parameter 2 Mpc from each LOS studied in this work. The LOS to the quasar HE21492745A, also included in the analysis presented in Paper I, was taken from the literature and is outside the field covered by the RCS1 and SDSS (Williams et al. 2006, hereafter W06; Momcheva et al. 2006, hereafter M06). Absorption line redshifts were redefined with respect to paper I to match the strongest MgII velocity component.
Our analysis makes use of photometric data from both RCS1 galaxy cluster and object catalogs, where the latter provided () and magnitudes for all extended sources in our fields down to limiting magnitudes 24.1 and 23.1 (Gladders & Yee, 2000; Yee, 1991).
In the following, all apparent magnitudes are given in the AB system and are corrected for galactic extinction according to the dust maps of Schlegel, Finkbeiner & Davis (1998).
2.2. MOS Observations
Our spectroscopic data were obtained with the Gemini Multi-Object Spectrograph (GMOS) at Gemini South Telescope in Cerro Pachón, Chile. The GMOS field-of-view (5.5 5.5) is wide enough to probe Mpc-scale projected distances at various redshifts. This is necessary since we consider cluster/group candidates at cluster-centric impact parameters 2 Mpc from the LOS at photometric redshifts 0.2–1 (which translate to angular separations of 10 – 4 , respectively). The spectroscopic data were acquired in queue mode between July 2008 and December 2008 (program ID: GS-2008A-Q-10; PI: S. López). In order to obtain good S/N ratio of the spectra and maximize spectroscopic completeness, two masks per field were designed: for faint targets ( 21) an exposure time of 2 3 000 s was chosen, whereas for brighter ones ( 21) the exposure time was 2 1 800 s.
Since the goals of the MOS observations were to identify Mg II absorbing galaxies and confirm galaxy clusters, masks were centered on QSO LOS and position angles chosen to maximize the number of cluster candidates (i.e. their cluster centers) within the field-of-view.
The 400 lines/mm grating (R400-G5325) was chosen and two central wavelengths were used (670 nm and 695 nm) —one for each of the two sets of exposures— in order to combine two spectra of the same object, avoiding the loss of information falling into the gaps between the three CCDs of Gemini mosaic detector. The slit width for all targets was set to 1, while the slit length varied from 7 to 10 to ensure sufficient sky counts for good sky subtraction.
Target selection for each mask focussed mainly on sources near the LOS of the background quasars, with the purpose of detecting absorbing galaxies. More specifically, galaxies at an impact parameter 150 kpc from the LOS (measured at the absorption redshift ) were categorized as first priority targets in the selection algorithm. This limit permits comparison with impact parameters found in studies of the halo cross sections of Mg II absorbing galaxies in the field (Churchill et al. 2005, ref. therein; Chen et al. 2010). Within this study we emphasize that [kpc] refers to galaxy impact parameters to the LOS, whilst [Mpc] refers to cluster-centric impact parameters to the LOS.
Based on the and color magnitude diagram for galaxy-type objects around the cluster/group candidate coordinates (Gladders & Yee, 2005), in addition to already known color magnitude relations derived from composite clusters of galaxies (Gilbank et al., 2008), we selected objects of second priority in order to detect potential brightest cluster members. Second priority objects with an impact parameter 150 kpc from the LOS (at ) were re-categorized as first priority objects.
Finally, third priority targets were chosen by performing a visual inspection of objects not selected as potential cluster members. The bias in this category towards bright/bluer galaxies permits the selection of galaxies in the outer regions of the clusters potentially exhibiting bluer colors.
The total number of selected targets was 440. Table 2 lists the number of spectroscopic sources selected in each field (), and those at an impact parameter 150 kpc from the respective LOS () with a magnitude , where is the magnitude of the faintest object inside this region.
2.3. MOS data reduction
Data reduction was performed using the GEMINI IRAF package version 1.9, following standard IRAF v2.14 reduction procedures. The dispersion solution was found using 40 to 45 spectral lines of the CuAr arc lamp distributed among the whole wavelength range. A 4th or 5th order Chebyshev polynomial was fitted to the data and the resulting r.m.s. of the fits ranged between 0.15 to 0.22 Å. The resulting wavelength interval starts at 4000–4500Å for some spectra, ending at 8500–9000Å in others; the exact wavelength range depends on the position of the slit in the pre-image. The final data had a dispersion of 1.365 Å/pixel with a resolution element of FWHM 7 Å ( 1000) equivalent to 350 km/s at 6000Å.
The final signal-to-noise ratio of our spectra ranged between 5–20 per pixel at 6000Å. Flux spectra were not calibrated as we were only interested in obtaining galaxy redshifts. We were able to use 88% of the reduced spectra, the rest suffered from low , artifacts or fringing.
We measured redshifts by fitting gaussian profiles to the spectral features (using the task rvidlines in the NOAO.RV IRAF package), and through visual inspection of the 2D spectra whenever necessary. Air-to-vacuum and heliocentric corrections were applied to each spectrum.
For early type galaxies, redshifts were measured primarily with the lines Ca II H, Ca II K and the G band absorption lines. For late type galaxies, the Hβ, [O III] 4959Å and/or [O III] 5007Å were used. Whenever possible, [N II] 6548Å, Hα 6563Å, [N II] 6583Å, [S II] 6716Å and/or [S II] 6731Å emission features were also considered. Nearly 55% of the galaxies show spectral features typical of early type galaxies, of which 63% also show [O II] 3727Å emission. Galaxies showing late type features comprise 45% of the entire sample.
The mean redshift uncertainty of our galaxy catalog was 0.0005, equivalent to 100 km/s at 0.55. All redshifts were classified as type 1, type 2 or type 3 according to the reliability of our measurements, with type 1 the most reliable, type 3 the least reliable. Galaxies with type 1 redshifts have spectra with two or more clear spectral features that could be modeled using Gaussian profiles. Redshifts of type 2 were measured using only one or two detectable spectral lines alongside the possible presence of weaker ones, in such a way that those redshifts are still dependable. Those redshifts obtained by using only one (predominantly [O II] 3727Å) or two spectral lines of poor signal-to-noise were classified as type 3. In total, 55% of our galaxies were assigned type 1 redshifts, 23% have type 2 redshifts, and the remaining 22% have type 3 redshifts.
In order to increase the total number of galaxies with spectroscopic redshifts, a search for Luminous Red Galaxies and spectroscopic targets from the DR7 SDSS was performed, increasing our spectroscopic sample by 47, adding an average of 1 and 3 galaxies per field respectively (without considering HE21492745A which is outside the SDSS area). Of these, approximately 10% had spectroscopy from both our Gemini data and the SDSS database yielding redshift agreements of 10-4 even for our less reliable class 3 redshifts. We also searched for objects in the NASA/IPAC Extragalactic Database adding 420 more redshifts to our data. The total number of galaxies with redshifts from all available sources is 43 from SDSS, 420 from NED, and 383 from our Gemini survey.
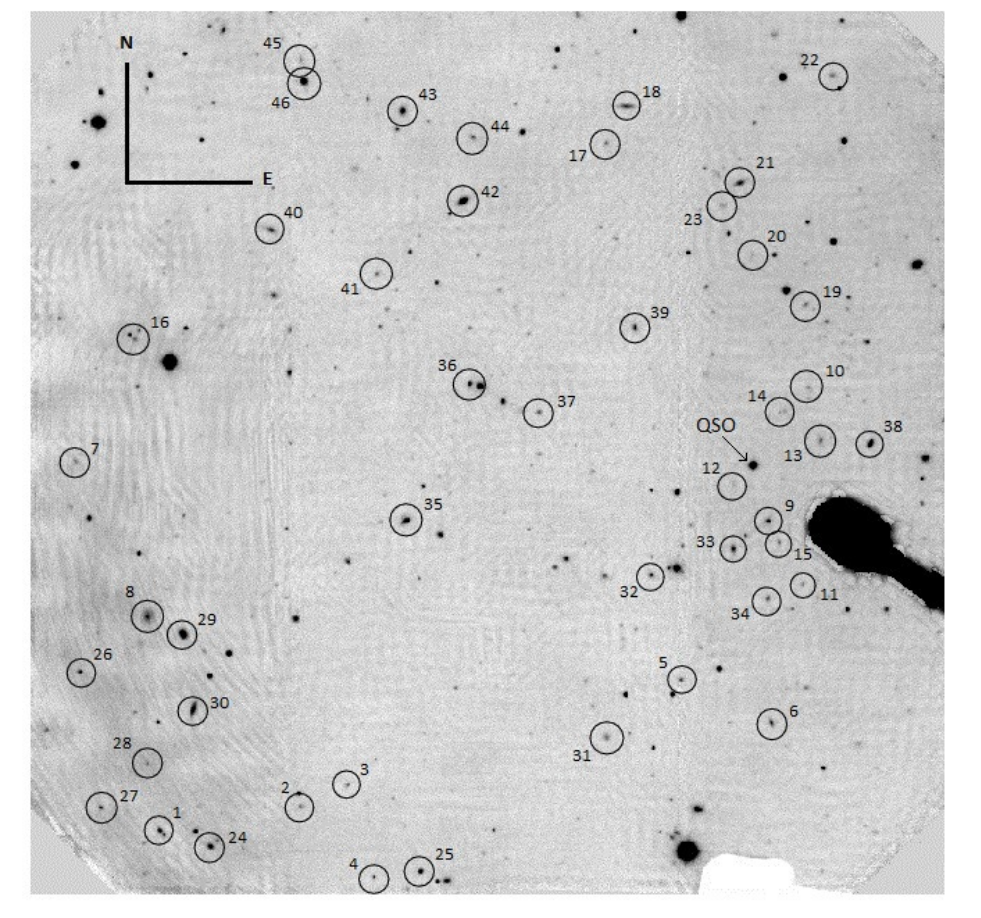
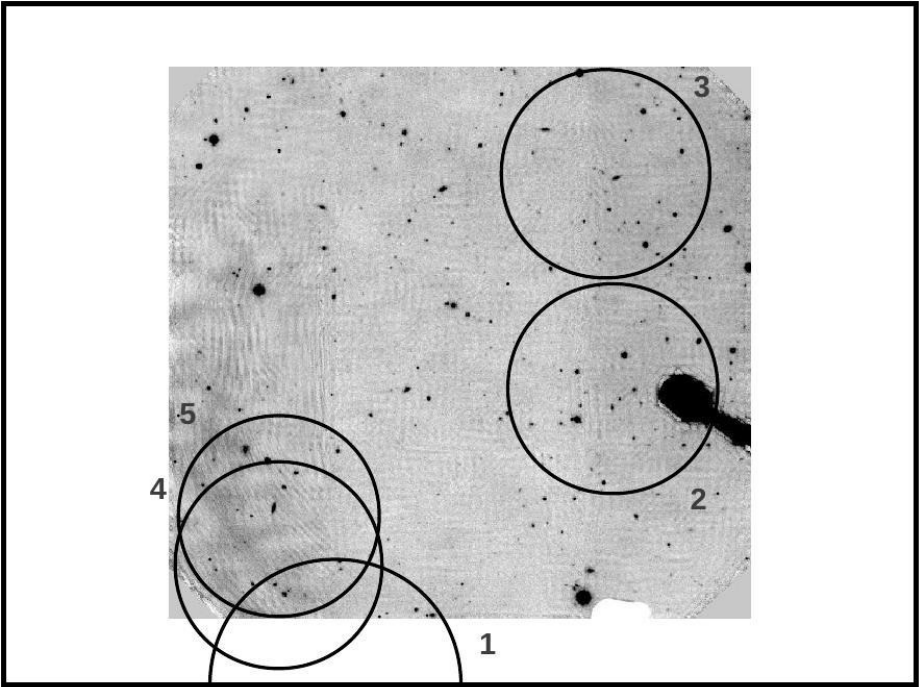
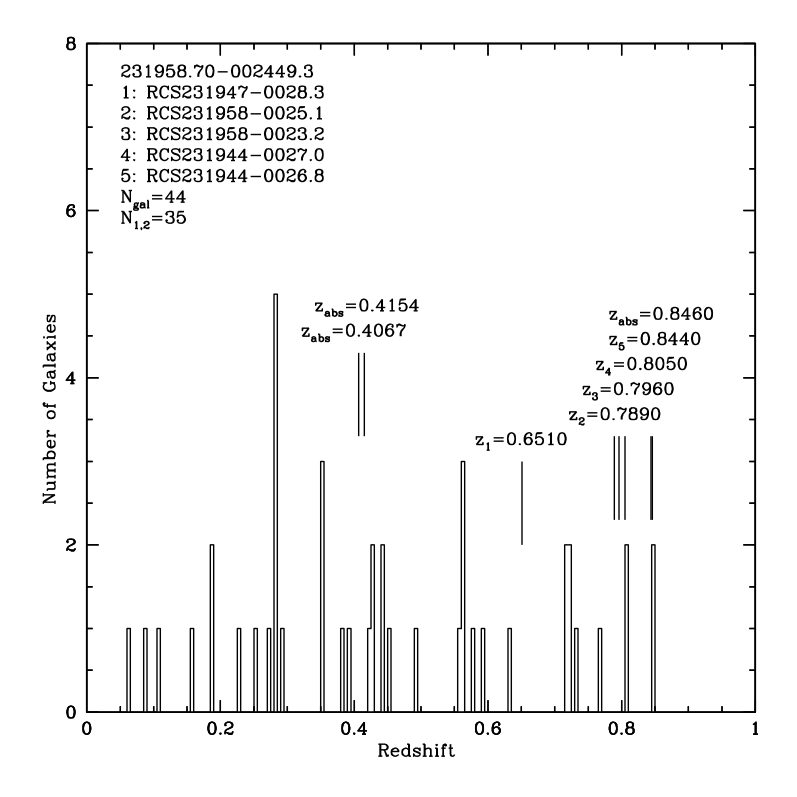
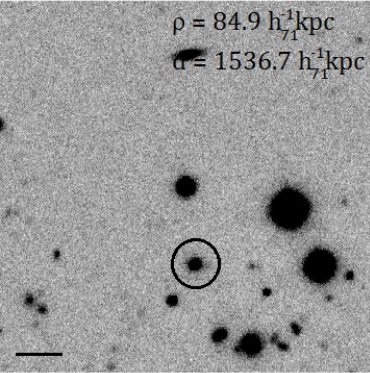
In even numbered Figures between 6 and 22, we show a snapshot of each 5.5 5.5 pre-image field observed with GMOS. Targets have been marked with a circle and are identified with a number. Moreover a small snapshot of each field is shown in the lower parts of these figures, indicating the center positions of the galaxy cluster/group candidates lying at 2 Mpc from the quasar sight-lines. Their center positions are shown in circles indicating a physical radius of 0.5 Mpc from the cluster center positions. The redshift histograms (odd numbered Figures 7–23) show all available redshifts for each field (see more in 3.2). The vertical lines in these plots indicate the absorption redshifts and the photometric redshifts of galaxy cluster/group candidates present in the fields. Tables 6–14 specify the number and redshift of each target, the redshift reliability classifier, and magnitudes.
3. RESULTS
3.1. Mg II Absorbing Galaxies
We define an absorbing galaxy as the closest galaxy to the LOS, observed with GMOS as having a redshift within typical galactic stellar velocity dispersions ( 300 km/s) from a Mg II absorption system (see e.g., Steidel, Dickinson & Persson, 1994; Le Brun et al., 1997). Previous surveys have found absorption galaxies at a few times kpc. Our selection of targets for spectroscopic observations primarily focused on galaxies residing at impact parameters 150 kpc from the LOS and having -band magnitudes brighter than 23.5 in GMOS pre-images.
The exposure time (see 2.2) and bright wings of the quasar spatial profile restricted the search for Mg II absorbing galaxies to objects typically brighter than 20 (at 0.6) and at impact parameters 2 equivalent to 8 kpc at 0.25 and 16 kpc from the LOS at 1.
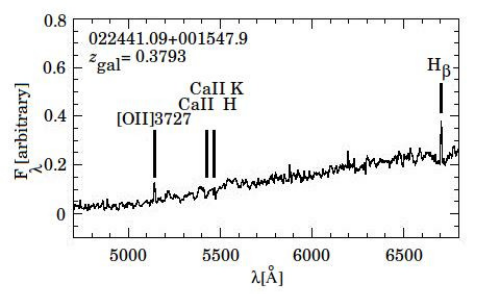
Table 3 summarizes the Mg II absorbing galaxies detected in our sample. The table lists the absorption systems of each LOS; their rest-frame equivalent widths [Å] and errors [Å], the redshift at which the Mg II absorbing galaxy was found , its impact parameter to the LOS [kpc], if the absorption was considered a photometric hit in this work, the spectral features used to determine its redshift; and the absolute magnitude corrected for k-dimming according to Fukugita et al. (1995). These -corrections have been computed by matching the observed galaxy colors and those for a wide range of galaxies SED at the measured redshift. Absorbing galaxies in the field centered on HE21492745A lack RCS1 and SDSS photometry, and as such no absolute magnitudes can be determined for them.
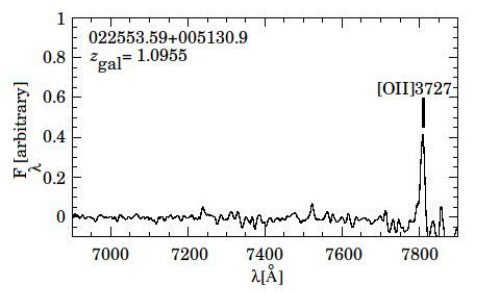
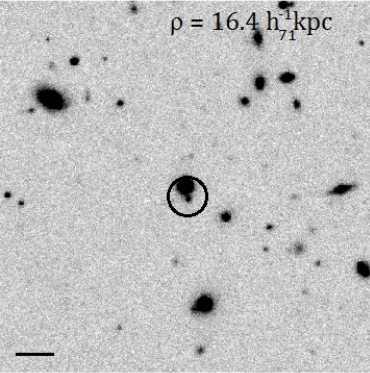
Out of a total of 24 absorption systems, Mg II absorbing galaxies were identified in 10 cases: 9 with our spectroscopic search and 1 from the literature, leading to a success rate of 41.7%. These galaxies have redshifts between 0.2509 1.0955 ( 0.55). Detection of galaxies at 1 was unlikely because the typical [O II] 3 727 Å emission feature reaches 7 500 Å, a region of the spectra contaminated by fringing. The one high- galaxy we detected, a very bright source with 20.21 (see Figures 2 and 10), shows a clear [O II] 3727Å emission feature in its spectrum. A characterization of these absorbing galaxies is detailed in section 3.4.
The median velocity difference is 50 km/s spanning a range between 280 and 57 km/s, and being consistent with galactic kinematics (e.g., Steidel et al., 2002). Despite these small velocity differences indicating genuine matches, we cannot exclude absorption from galaxies below our detection limit.
The low success rate results from observational design. Slit lengths are an important constraint when trying to observe all objects within a certain region using multi-object spectrographs. This, combined with low S/N sources and fringing, did not allow us to obtain redshifts for all objects within 150 kpc from the LOS. Consequently, the missing absorbing galaxies may: lie at lower impact parameters to the LOS, be hidden behind bright/large foreground objects within the region (see for example Figures 8 and 12), or are too faint for reliable detection. Further and deeper spectroscopic observations must be planned to identify more absorbing systems and improve the number of matches to galaxy counterparts.
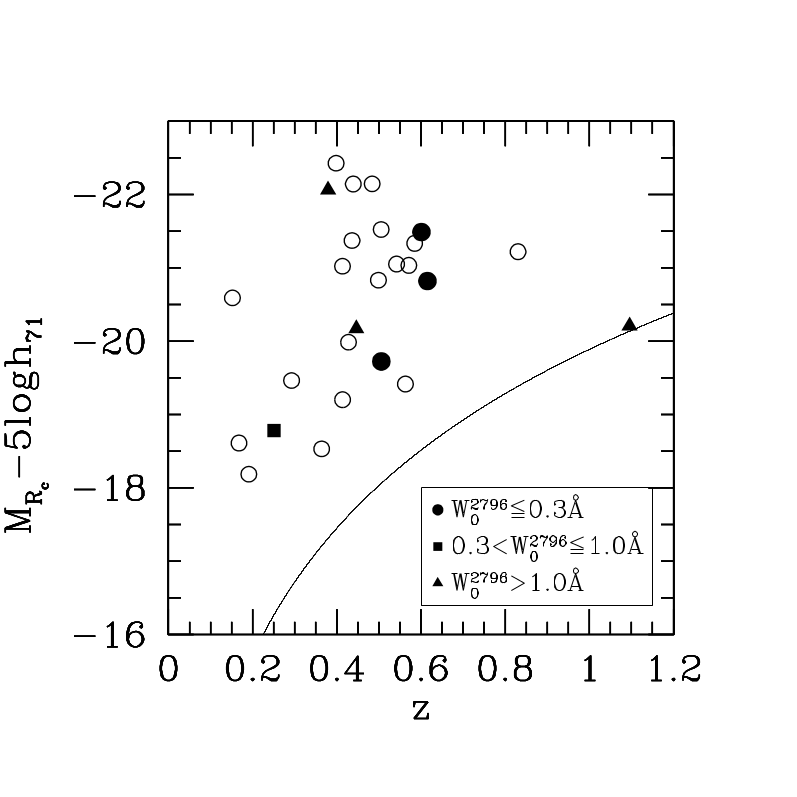
Figure 1 presents the -band absolute magnitude versus redshift for our absorbing galaxies and interlopers, i.e., galaxies near the LOS that do not produce any Mg II absorption detectable in the quasar spectra. The survey is complete down to () for galaxies to .
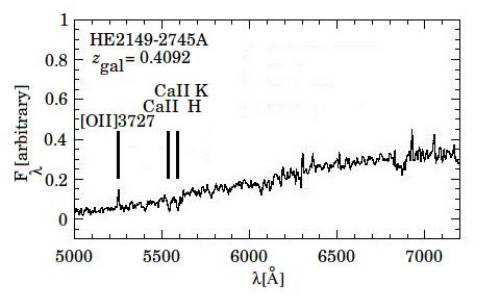
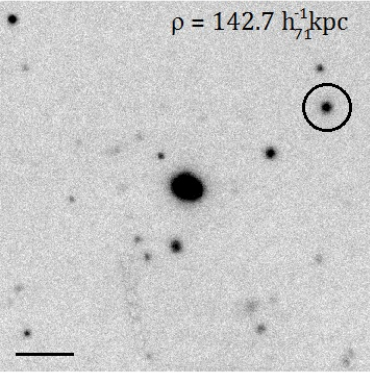
Our absorbing galaxies have absolute magnitudes spanning a range between 518.78 ( 0.2509, 0.732 Å) to 22.07 ( 0.3793, 1.181 Å), with a median value of 20.21 comparable to of present day galaxies (Blanton et al., 2001). Moreover, interlopers show similar magnitude ranges and are also comparable to galaxies. Thus no difference in brightness can be distinguished between Mg II absorbing galaxies and interlopers. The median impact parameter of our ten absorbing galaxies is 63.5 kpc. The highest redshift Mg II absorbing galaxy in our sample ( 1.0955, 1.685 Å) has an impact parameter at the minimum distance probed by our spectroscopic campaign (16.4 kpc), while the largest impact parameter, 142.7 kpc ( 0.4092, 0.228 Å), is approximately 43 km/s away from the absorption redshift.
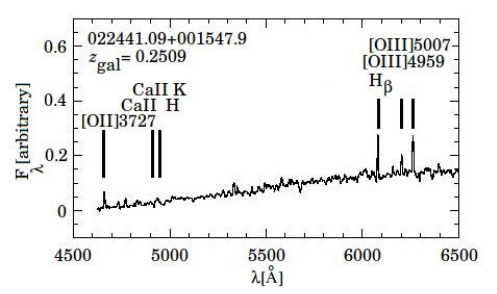
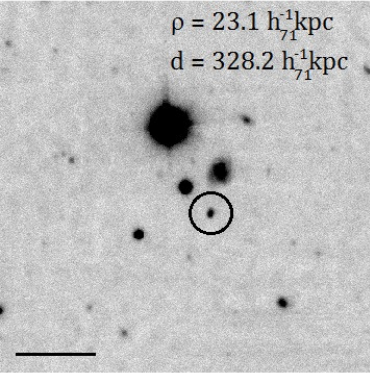
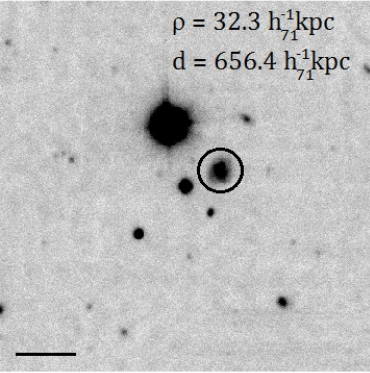
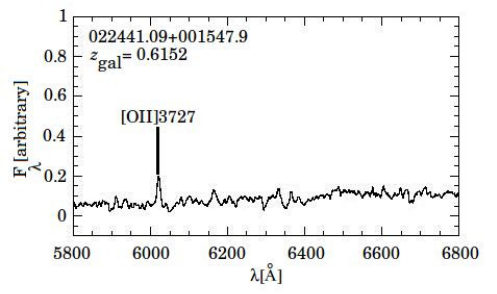
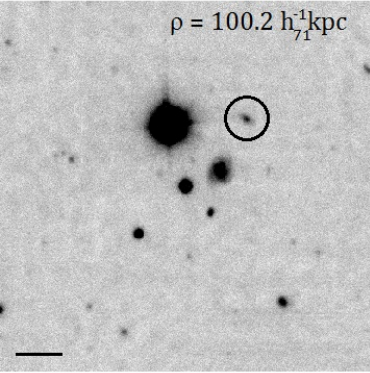
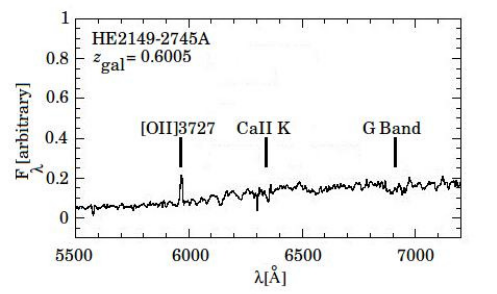
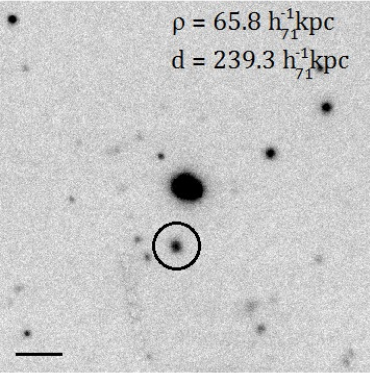
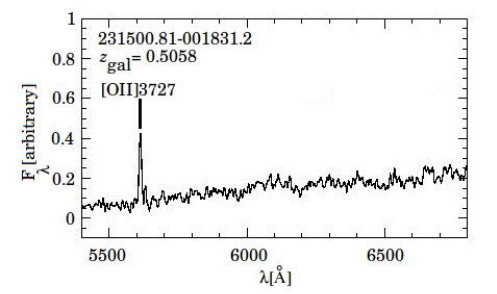
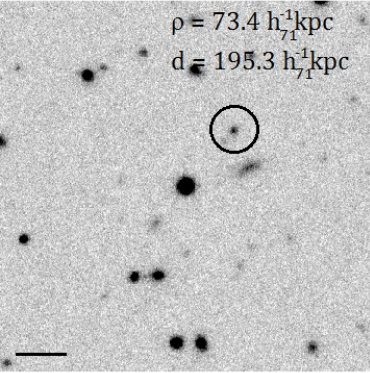
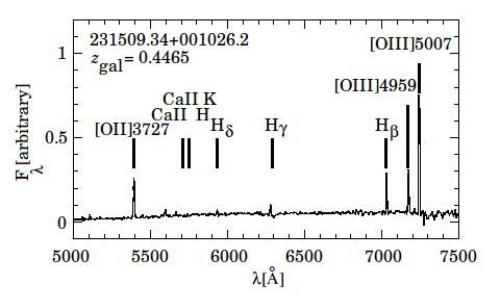
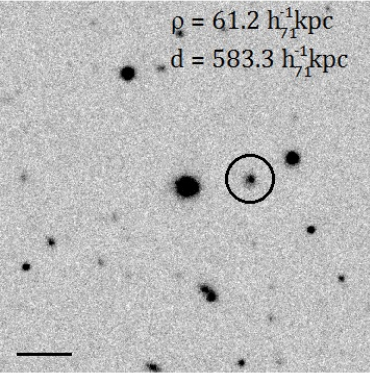
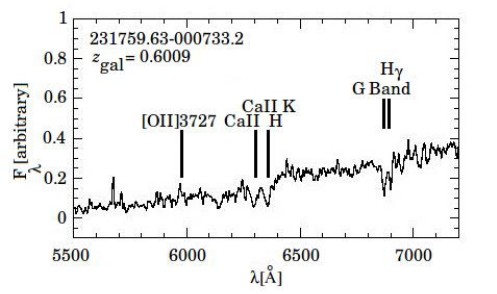
Spectra of the absorbing galaxies are shown in Figure 2. We do not show the galaxy at 0.6030 responsible for the weak absorption of 0.015 Å seen in the spectrum of the gravitationally lensed quasar HE21492745A (Wisotzki et al., 1996). This galaxy, taken from the literature, appears to be the lensing galaxy of the system as published in Eigenbrod et al. (2007). Despite no Mg II absorption was reported in that case, Paper I did detect an absorption with 0.015 Å(the weakest in our sample) by analyzing a high resolution spectrum of the QSO.
Three out of the ten galaxies show only emission lines, and more than half have Ca II K, Ca II H and G band absorption transitions among their spectral features. With the exception of the lensing galaxy, a common feature within our absorbing galaxies is the presence of the [O II] 3727Å emission line, denoting some level of recent star formation activity (see Table 3). Complementary to this, the mean () color of our galaxies is 0.57, typical of Sbc-Scd galaxies at 0.55 (Fukugita et al., 1995).
3.2. Galaxy Clusters
The second goal of this work is to reduce the photometric redshift uncertainty of RCS1 cluster group/candidates ( 0.1) by confirming them spectroscopically. This will allow us to properly establish the possible connection between Mg II absorbers and galaxy overdensities.
As mentioned before, the sample contains 31 galaxy cluster/group candidates from which 30 are from the RCS1 and 1 is taken from the literature. The RCS1 galaxy cluster/group candidates were detected with a significance 3 and are mostly poor: 27 have richness parameters 800 and only 3 have 800 1100 (Yee & López-Cruz, 1999), corresponding to clusters with Abell 0–1 richness classes (Yee & López-Cruz, 1999).
The confirmation algorithm we adopted is divided in three steps: 1) detect overdensities in redshift space, 2) associate galaxy cluster candidates (i.e., those without spectroscopic redshifts) with observed redshift overdensities, and 3) define cluster membership to estimate cluster redshifts and rest-frame velocity dispersions [km/s].
We detect redshift overdensities by looking at redshift histograms for each field. Odd numbered Figures 7–23 show redshift histograms, using all redshift classes, with a bin size of 0.005. At 0.173 and 1.032 (the minimum and maximum photometric redshifts of our cluster/group candidate sample) this bin translates to velocity bin widths of 1 280 and 740 km/s respectively.
To define the extent of the redshift overdensities, we focus on 1 000 km/s, centered on each redshift peak identified in the redshift histograms, with a rest-frame bin width of 250 km/s. We concentrated specifically on peaks near the photometric redshifts of RCS1 cluster/group candidates. Since our survey strategy was designed to spectroscopically confirm an average of 3 clusters per field, and —as a result of the spectroscopic mask design procedure— we observed 50 objects per field, then a more conservative approach had to be adopted when stating the considerable number of members to obtain a reliable estimate of . Consequently, peaks of more than 15 members were considered sufficient to identify a cluster of galaxies.
The association of cluster/group candidates with observed redshift overdensities was established once the redshift of central galaxies was obtained, i.e. early type galaxies located at projected distances 500 kpc from the cluster/group candidate center coordinates given by the RCS1, with similar redshifts ( 1 000 km/s) to the galaxy cluster/group candidate photometric redshifts and within their photometric redshift uncertainty ( 0.1), and showing colors and magnitudes following a red sequence in () vs , built by including all extended sources at 500 kpc from the cluster center as defined by the RCS1 photometric object catalog (Gladders & Yee, 2000). To obtain these color magnitude relations, we performed rough color cuts in the color magnitude diagrams, we fitted a linear regression () , and we obtained the standard uncertainties of the constants and .
The conditions described above are satisfied in most cases where RCS1 cluster/group centers reside within the pre-image field-of-view. However, as 32% of our cluster/group candidate centers fall outside, a different approach had to be applied in order to establish the association between the RCS1 candidates and the redshift overdensities. For these cases, at least two of the following conditions had to be fulfilled: galaxies residing at a cluster-centric projected distance 2 Mpc, having similar redshifts ( 1 000 km/s) near the galaxy cluster/group candidate photometric redshifts and within their photometric redshift uncertainty ( 0.1), and/or falling at less than 3 from the color magnitude relation that includes all photometric extended sources at 500 kpc from the cluster/group candidate center, taking into account, at large cluster-centric distances, that galaxies tend to be morphologically different and have bluer colors (Dressler, 1980). In the last criterion, to mitigate against fore- and background contamination, we additionally require that first two conditions are also satisfied.
One special case is the field centered on HE21492745A. Here, the overdensity found at 0.6 (see histogram in Figure 15) is consistent with the galaxy cluster detection of M06 and W06, who detected a red-sequence at a photometric redshift 0.590 and that was then spectroscopically confirmed at 0.6030. Additionally, we find two more overdensities in the field at 0.2768 and 0.7395. Whilst the former has already been identified by M06, the latter is reported here for the first time due to the depth of our observations.
To assign cluster members, we followed the procedure of Fadda et al. (1996) and Blindert (2006), where galaxies at 4000 km/s from each redshift peak (for all redshift flags) are subjected to an interloper rejection scheme using both galaxy angular position and cluster-centric radial velocity. More specifically, this technique utilizes overlapping and shifting cluster-centric distance bins of size (or larger) so that each bin contains at least galaxies. For each bin, a velocity fixed-gap rejection scheme is applied to discard galaxies at km/s from their neighbors. Here, the values of , and were chosen to be 10, 0.5 Mpc and 1000 km/s respectively, motivated by the small number of input redshifts per cluster and small range of cluster richness.
Cluster redshifts, , and velocity dispersions [km/s] were determined with biweight estimators of location and scale from Beers et al. (1990). Uncertainties in were obtained using the jackknife method, and were corrected to the rest-frame.
Table 4 provides a summary of the results concerning the confirmation of RCS1 cluster/group candidates in our sample. All 31 cluster/group candidates lying at an impact parameter 2 Mpc from each LOS are listed, as well as their photometric redshifts , spectroscopic redshifts and rest-frame velocity dispersion estimates [km/s] (both measured irrespective of redshift reliability flag). The final column includes comments about each galaxy cluster confirmation.
From a total of 31 cluster/group candidates 20 were spectroscopically confirmed spanning a redshift range 0.2659 1.0152. Of these, 10 have a significant number of members (N 15). Among clusters confirmed with fewer members, 7 are based on the detection of central galaxies (see comments in Table 4). For these, cluster redshift estimates are considered to be quantitatively reliable, while velocity dispersions should be considered as qualitative estimates only. Out of the final three confirmed clusters, two (in the field 231500.8001831.2) were considered blended at the same redshift as it is not possible to separate them in photometric redshift and distance to the QSO LOS (see below). The remainder has a significant number of member galaxies but the center lies out of the field.
Our spectroscopic survey proved more effective in detecting galaxies (and hence, galaxy overdensities) at 0.7. Out of 21 low- galaxy cluster/group candidates ( 0.7) we recovered 18, whilst from a total of 10 high- galaxy cluster/group candidates, we were able to confirm only 2, thanks to the redshifts retrieved from NED.
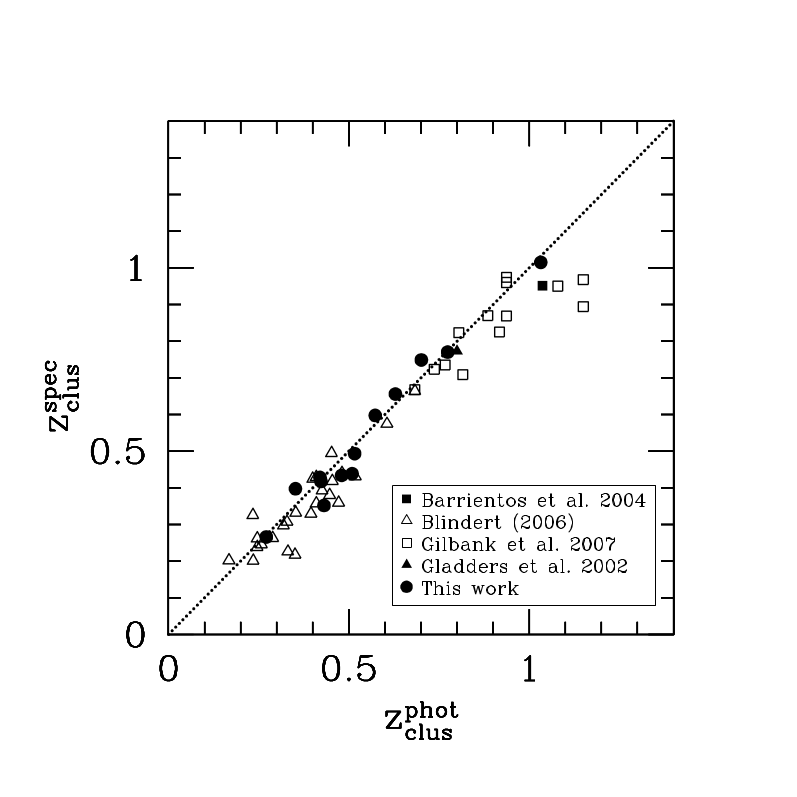
The redshifts of the confirmed clusters can be compared against those estimated photometrically, as shown in Figure 3. Also shown are the RCS1 galaxy cluster redshifts calculated in Barrientos et al. (2004), Blindert (2006), Gilbank et al. (2007) and Gladders et al. (2002). We exclude all cluster redshifts found in the field 231500.81001831.2 because we were unable to confirm the different cluster candidates individually. The resulting redshift differences range between 0.004 0.079 for our confirmed clusters with N 15 members, and 0.070 for those with N 15; both following the one-to-one relation (dotted line) and within typical values obtained in studies at similar redshift ranges (Blindert, 2006; Gladders et al., 2002).
Taking into account past investigations shown in Figure 3, and data we present here (including our confirmations), we find an average redshift offset of 0.036 0.032 (Wittman et al., 2001; Gilbank et al., 2007). This estimate implies 0.06 at 0.5–0.7, reinforcing the empirical difficulty in confirming the overlapping clusters in the LOS 231500.81001831.2 and 231958.70002449.3 fields.
We also estimate cluster masses and radii by using the virial theorem (Carlberg et al., 1997). The mean virial radius of our clusters confirmed with N 15 members is 1.57 0.58 Mpc and the mass enclosed within it is . These values should be considered qualitatively. Thus, our sample of confirmed clusters appears to have mean masses consistent with typical of clusters of low-intermediate mass (Yee & Ellingson, 2003).
Comments on the individual cluster detections can be found on the Appendix.
3.3. Spectroscopic Hits
Combining the results from 3.1 and 3.2, we are now able to correlate Mg II absorbers to cluster/group environments, i.e., confirm photometric hits.
According to our definition in 1, a spectroscopic hit is detected whenever either a Mg II absorption or an absorbing galaxy is found to reside in a spectroscopically confirmed galaxy cluster/group environment. More specifically, when (or , if possible) falls within 1000 km/s of , the confirmed cluster/group redshift.
Despite in some cases either being unable to confirm RCS1 cluster/group candidates or not expecting to find any, we did detect an agglomeration of few galaxies (N 10) with similar redshifts ( 1000 km/s) separated at projected distances 0.5 Mpc from each other. We consider these kind of systems as groups of galaxies; absorbers inhabiting at such redshifts and closeness in space are identified as group absorbers: spectroscopic hits associated to groups instead of clusters of galaxies.
We emphasize this distinction between group and cluster absorbers since galaxies in clusters may be affected by a history of extreme events, while the haloes of galaxies in our newly defined groups of galaxies may experience less aggressive (ongoing) interactions. Thus, it is important to distinguish them from those galaxies that, according to our follow-up, appear completely isolated.
All spectroscopic hits detected in our sample are listed in Table 5. The table shows the cluster/group redshift , rest-frame velocity dispersion [km/s], rest-frame velocity difference [km/s] (between the redshift of the Mg II absorbing galaxy and the absorption redshift ), and the rest-frame velocity difference [km/s] (between the cluster redshift and the absorber at or absorbing galaxy at , if found).
From a total of 24 absorption systems, only 14 are considered as photo-hits. From these 14 Mg II-cluster pair candidates, 8 are confirmed as spectroscopic hits associated to galaxy clusters, and 2 to galaxy groups. This makes a total of 10 confirmations out of 14, corresponding to a 71% success rate in spectroscopically confirming photometric hits as Mg II absorbers in clusters/groups of galaxies. Additionally, 2 new spectroscopic hits were not classified as photometric hits as they were not matched to RCS1 clusters near . Based on our spectroscopic survey of galaxies, we hypothesize they are likely related to galaxy groups. Of the 12 absorption systems associated to galaxy clusters/groups, 10 are found at .
From the four photo-hits that could not be confirmed, we find two of those are at the redshift boundaries of the survey, one at and the other one at (where the RCS1 cluster catalog is incomplete). The other two remaining could not be assigned clusters. If we considered these last two absorbers as contaminants in our Mg II-cluster pair study, then we have a contamination of 29% (or 43% if the group absorbers are not considered as spectroscopic hits). Similarly, if we exclude the photo-hits in redshift boundaries were RCS1 is highly incomplete, the contamination is only 17% (33% if the group absorbers are not considered hits).
The median redshift of Mg II absorbers associated to galaxy cluster environments was 0.60, and for those in galaxy group environments, 0.62. The mean velocity difference of the whole sample of spectroscopic hits is 22.46 km/s and spans a range between 468.16 and 656.25 km/s, consistent with typical cluster velocity dispersions.
The 10 absorbers in Table 5 that are not considered as photometric hits exhibit a wide redshift distribution, with four at , where the RCS1 cluster catalog is highly incomplete, and assignment therefore unreliable.
3.4. Characterization of Mg II Absorbers Associated with Cluster Galaxies
Several studies have investigated the so-called ”standard model of absorbers” established by the work of Steidel (1995). According to this model, the gaseous extent of a galaxy can be described by a Holmberg luminosity scaling relation of the form . In the sample of Steidel (1995), all Mg II absorbing galaxies fell below the relation, while non-absorbing galaxies fell above the relation. This result led Steidel (1995) to conclude that all normal galaxies with luminosities 0.05 should have Mg II gaseous haloes. However, other studies (Churchill, Steidel & Kacprzak, 2004) have found otherwise, due to the presence of interlopers and misidentified absorbing galaxies within the original sample used by Steidel (1995).
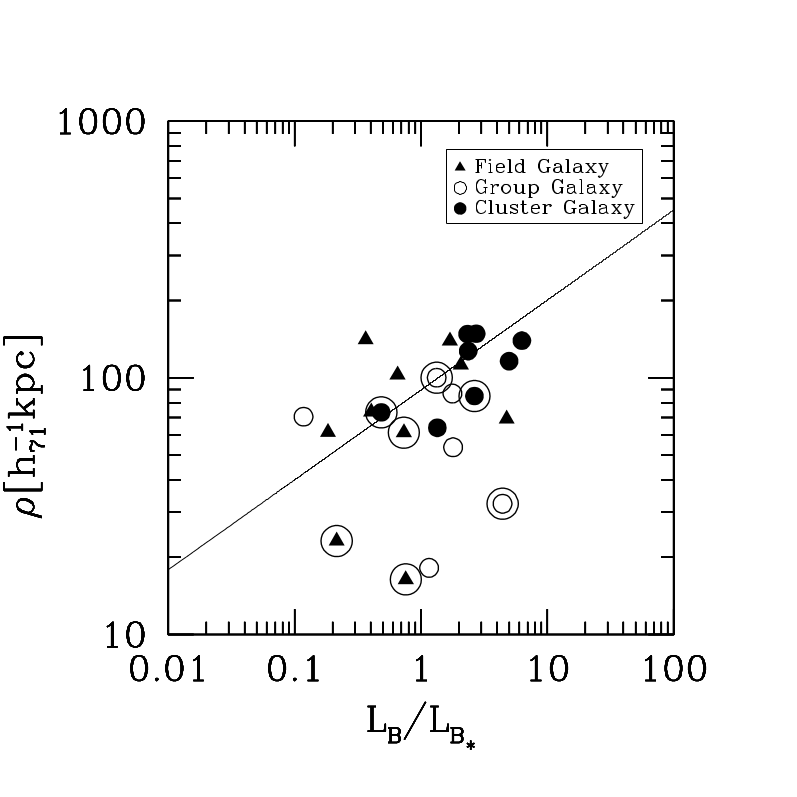
Figure 4 shows the observed impact parameter versus -band luminosity for our absorbing galaxies (enclosed in a large open circle) and interlopers, associated to the field (filled triangles), galaxy groups (open circles) and galaxy clusters (filled circles). -band magnitudes were obtained by converting SDSS photometry with the transformation given in Windhorst et al. (1991). We show only 7 absorbing galaxies because we do not have photometry for the 3 absorbing galaxies found in the field centered on the LOS to HE21492745A.
We adopted the Holmberg relation determined by Chen & Tinker (2008) with 89 kpc and 0.35 for absorbing field-galaxies. Figure 4 shows that bright galaxies generally tend to have larger Mg II halo sizes than fainter ones. Our data (regardless of environment) do not follow the standard model since there are seven interlopers lying below the line indicating that the covering factor of Mg II haloes is less than unity, which can also be deduced from the large number of interlopers seen in our sample (see also Figure 1). However, in general, most absorbing galaxies confirmed in this work lie below the Holmberg relation derived in Chen & Tinker (2008), with interlopers falling above the line. Most importantly, all our absorbing galaxies confirmed in the field lie below the relation and most field interlopers lie above it. That our two absorbing cluster-galaxies lie above the relation may indicate the environment modifies the relation between galaxy luminosity and Mg II halo sizes.
Given the aforementioned contamination of Steidel (1995) data and the lack of additional information regarding their assignment to groups or clusters, it would be interesting to test the standard model with a larger sample of confirmed Mg II absorbers and interlopers inhabiting cluster/group/field environments.
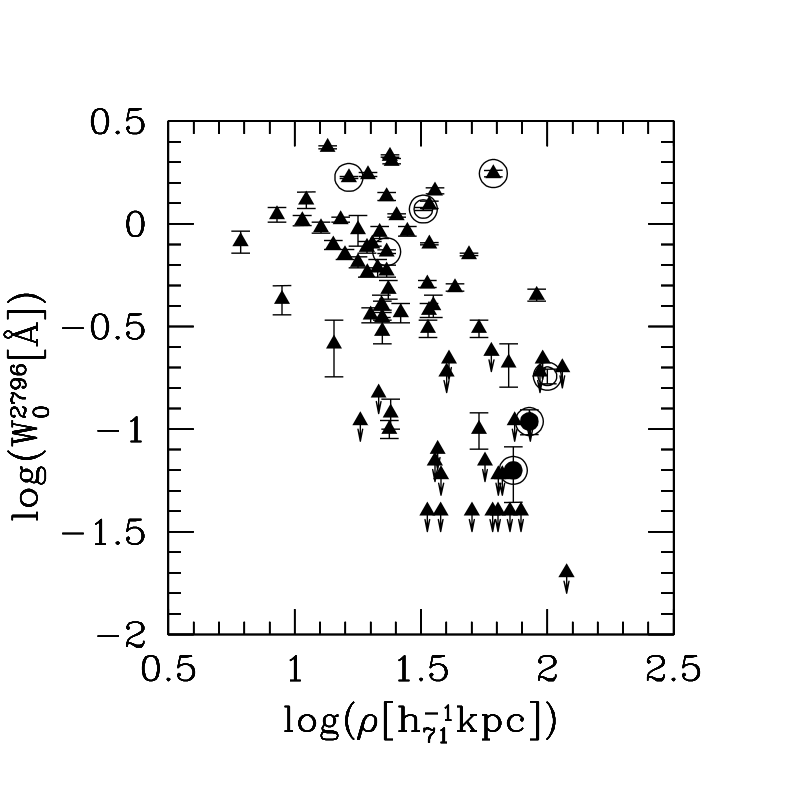
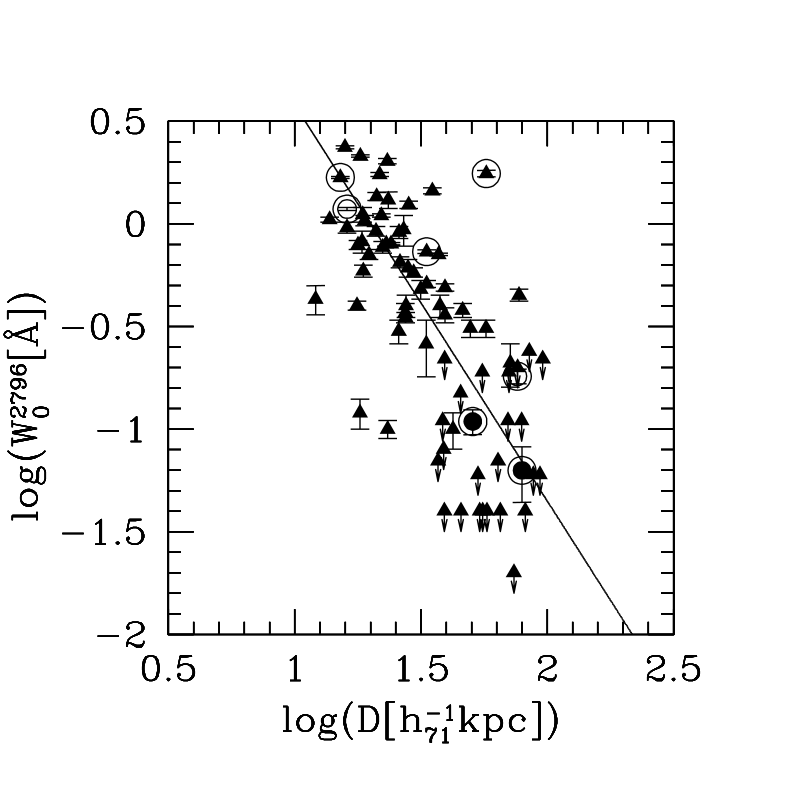
Figure 5 (left panel) shows the rest-frame equivalent width of the Mg II absorptions against the impact parameter to the LOS of our absorbing galaxies (enclosed in a large open circle) confirmed in the field, groups of galaxies and clusters of galaxies (the symbols are the same as shown in Figure 4). We also plot the sample of absorbing field-galaxies published in the work of Chen et al. (2010) as a reference. From this figure we can see that regardless of their environment, our sample of absorbing galaxies appears to follow the anti-correlation tendency found for absorbing galaxies in the field (e.g., Chen et al., 2010).
Chen et al. (2010) found that the large scatter in this anti-correlation could be diminished when parametrizing the galaxy impact parameter and the -band luminosity of absorbing field-galaxies in a scaling relation (D kpc). The right panel of Figure 5 shows the absorption rest-frame equivalent width [Å] versus the luminosity-weighted impact parameter D [kpc]. This plot shows our data (enclosed by a large open circle) compared to that of Chen et al. (2010). The symbols are the same as shown in the left panel. Of our three field points (filled triangles), one falls at 3 from the anti-correlation found by Chen et al. (2010) (solid line). This outlier, from the 231509.34001026.2 field, is the second strongest absorber in our sample( 1.758 Å), situated 61.19 kpc from the LOS, and appears to be the closest galaxy to the quasar sight-line up to the RCS1 limiting magnitude.
Our small sample of absorbing galaxies does not allow us to determine if a tight anti-correlation is valid for absorbing galaxies in clusters or groups of galaxies. When neglecting environment, they appear to follow the anti-correlation found for absorbing galaxies in the field (solid line). However a maximum likelihood method applied to a larger catalogue of absorbers would be useful to establish a specific scaling relation between [kpc] and galaxy luminosity for absorbing cluster/group-galaxies; the scaling relation found for absorbing field-galaxies (D [kpc]) does not necessarily hold for galaxies in clusters/groups. Applying this scaling relation could therefore be misleading when trying to define an analogous anti-correlation for absorbing cluster/group-galaxies.
Until a large sample of absorbing cluster/group-galaxies is available, the linear relation between both variables remains valid for isolated Mg II absorbing galaxies, yet remains unknown for those in clusters/groups.
4. Discussion
In our search for Mg II absorbers inhabiting dense environments, we detected 8 in clusters of galaxies and 2 in groups of galaxies, at a mean redshift 0.55. This corresponds to a success rate of 71% in confirming spectroscopically photometric hits associated to clusters/groups of galaxies. Two additional Mg II absorbers have been associated to new groups identified in this study.
We also confirmed Mg II absorbing galaxies from which 4 appear to belong to clusters of galaxies, 3 to our newly-defined groups of galaxies, and 3 to the field (i.e. isolated Mg II absorbing galaxies unconnected to groups of galaxies nearby).
Whilst the definition of absorbing galaxies we adopt is usually used in surveys searching for absorbing galaxies (e.g., Steidel, Dickinson & Persson, 1994), some caveats must be stated about the reliability of our considerations.
The absorbing galaxies we report here may not be the only ones at and 150 kpc from the quasar sight-lines, and as such some of them may be misidentifications. In such cases, we would be dealing with at least a pair or a group of galaxies near the LOS in the foreground of the respective quasar. This would add more candidates to our sample of Mg II-group pairs.
Instead of absorbers residing in galaxies, some may have been expelled from the galactic halo, thus exhibiting relatively large impact parameters ( 100 kpc). In these cases, we would be tracing warm-cold gas reservoirs in the intergalactic medium or intracluster medium should the absorber reside in a cluster/group of galaxies. Despite this, we are not particularly interested in studying specifically where the absorption takes place within a galaxy. We merely state the assignment of the absorber to a specific overdensity in order to build a sample of confirmed cluster/group absorbers.
The results of our survey also have some redshift dependence that is strong for the confirmation of galaxy hosts, but mild (if any) for the confirmation of absorber-cluster pairs. From the original 24 absorbers in the 9 LOS presented here, one third are at , while for the confirmed hosts only 1 of 10 is at . On the other hand, 2 out of 12 confirmed cluster-absorber pairs are at , while we had 3 out of 14 candidates in the same redshift regime. This difference is not surprising since it is easier to confirm a cluster of galaxies using spectra from their bright members than to identify one fainter galaxy responsible for the Mg II absorption.
4.1. Are The Absorbing Galaxies Typical Cluster/Group/Field Galaxies?
When comparing the restframe color of our identified absorbing galaxies to those given in Fukugita et al. (1995), out of the 4 we confirmed we found one with a color consistent with an Sbc galaxy ( 0.6013, 0.109 Å). Another has a color consistent with an irregular/star-forming galaxy, and is also associated to a weak absorption system ( 0.5058, 0.063 Å). Since the field where the latter is located shows a clear overdensity of galaxies at its redshift, it could be an infalling galaxy yet to lose a large amount of gas. Finally, for the remaining two confirmed absorbing galaxies (near the LOS to HE21492745A) we do not have photometry, yet their spectra characteristics (see our Figure 2 and see Figure 12 in Eigenbrod et al. 2007) are consistent with relatively early type galaxies, with both hosting weak absorbers ( 0.015 and 0.175 Å).
Thus in general all of these galaxies host weak absorbers, they appear as cluster galaxies undergoing some level of ongoing star formation at 0.60 (as shown by the presence of [O II] 3 727 Å emission feature in their spectra); and lie at projected distances lower than 250 kpc from the cluster centre coordinates, with the exception of the absorbing galaxy associated to the cluster RCS2317550011.3 where the projected distance is 1.6 Mpc.
On the other hand, two of our absorbing group-members appear disk-like and irregular, respectively producing absorptions of 1.181 Å and 0.181 Å (see Table 3); unlike absorbing galaxies in clusters they do not appear deficient in gas. Unfortunately we lack -band photometry to secure magnitudes for the other absorbing galaxy found in a group of galaxies (at 0.4092), though this target similarly shows properties consistent with those of a star forming galaxy (see Figure 2).
Moreover, our small sample of isolated absorbing galaxies are bright and have a color consistent with disk galaxies. They all produce strong absorptions between 0.732 Å and 1.758 Å, and appear as typical Mg II absorbing galaxies found in the field, as supported by previous works (Zibetti et al., 2007; Steidel, Dickinson & Persson, 1994; Lindner, Alvensleben & Fricke, 1996; Churchill et al., 2005; Kacprzak et al., 2005, 2007; Chen et al., 2010; Kacprzak et al., 2010).
The fact that absorbing group-galaxies and field-galaxies are indistinguishable from those found in RCS1 clusters may reflect the inclusion of small groups in our field sample. This potential cross-contamination must be investigated once further analysis is performed on those systems.
For now we can conclude, independent of the environment, absorbing galaxies reside in, that our catalogue heterogeneously samples the population of absorbing galaxies and is consistent with past findings. However, in considering environmental effects we find a dichotomy between our absorbing cluster-galaxies and those confirmed in the field. While the former show generally weak ( 0.3 Å) absorptions and consistently with early type galaxies, the latter produce strong absorptions and are consistent with bright star forming galaxies typically encountered in the field.
Although relations between Mg II absorption strength and galactic halo masses (Bouché et al., 2006; Gauthier, Chen & Tinker, 2009) or galaxy type (Zibetti et al., 2007) have already been studied, these works do not probe rest-frame equivalent widths as weak as those found in Paper I and used in this work.
4.2. Implications For Papers I and II
The sample originally presented in Paper I and studied here includes a total of 11 photometric hits, so defined at 0.9 with absorption systems having rest-frame equivalent widths 0.05 Å. Table 5 shows we recovered 8 of these as spectroscopic hits, suggesting a 73 % efficiency in the program. A closer look at these results finds that of 3 strong photometric hits ( 1.0 Å), 2 are recovered as spectroscopic hits, i.e. 2/3 of the strong Mg II system cluster member candidates genuinely reside in clusters.
In Paper I we defined the weak systems as those having 1.0 Å, and these show a in clusters consistent with what is expected for the field. Now, in order to deal with the small number statistics we classify weak systems as those having 0.3 Å, and strong systems for 0.3 Å. We see that of the 6 photometric hits for strong systems, we recover only 3 as spectroscopic hits, whereas for the weak systems we recover 5 out of 5.
Although the overall numbers are consistent with expectations from Paper I, their proposed interpretation is not supported by these new data. Here, we find that all weak absorbers are associated to clusters while this is true only for a fraction of the strong systems. The interpretation of the statistics in Paper I is that galaxies falling into the potential wells of clusters/groups loose their external shells where most of the weak systems are produced, and only the strong systems survive the interaction with the cluster. Here we see that all the weak systems are associated with clusters and only some of the strong systems. Despite dealing with small sample sizes, the results are at odds.
Regarding the analysis of halo sizes performed in Paper II, our sample of photometric hits confirmed in clusters of galaxies (for which field and group absorbers should be considered contaminants) shows that, in general, Paper II accounts for field contamination (their Table 1) in a manner consistent with our findings here (28%), particularly when considering cluster-centric impact parameters between [0.5,1.0] Mpc. In this regime their field absorber fraction agrees with our findings when we also include photometric hits that could not be confirmed in the field or were unclassified. Therefore, the results of Paper II on baryonic halo sizes of gas in RCS1 clusters remain valid.
All these numbers can be increased by including additional systems identified within this study. For instance, a new analysis of the LOS to the quasar HE21492745A indicates we should have included the absorption system at as a photometric hit, since M06 and W06 detected a red-sequence at a photometric redshift of , later confirmed spectroscopically as 0.4465. By including this system, the statistics remain similar.
5. Summary of Results
We have performed Gemini multi-object spectroscopy of fields around 9 distant background quasars, in whose spectra Mg II absorptions had previously been detected with rest-frame equivalent widths between 0.015 2.028 Å. Our project sought to build a sample of Mg II absorbers in dense environments such as clusters or groups of galaxies. To achieve this, we use our spectroscopic survey to search for absorbing galaxies near the LOS and confirm RCS1 cluster/group candidates within the 9 fields ( 2 Mpc from the LOS) in order to analyze the environment where the Mg II absorbers and their galactic counterparts are located. In this study we include the analysis of spectra for 846 galaxies, 43 obtained from the SDSS database, 420 from NED and 383 from our own GMOS observations. The highest priority for our spectroscopic observations was to detect the absorbing galaxies and then to detect the cluster galaxies. A total of 39 slits were devoted to identify the absorbing galaxies.
The main results of this work are summarized below:
Regarding our primary objective of identifying the absorbing galaxy:
-
•
The identification of 10 out of 24 absorbing galaxies with redshifts between , up to an impact parameter of kpc and a maximum velocity difference of km/s.
-
•
Our small sample of isolated absorbing galaxies appear as bright disk galaxies, exhibiting strong absorptions, consistent with typical Mg II absorbing galaxies in the field, as stated by previous works.
-
•
Regardless of the environment, we have found a heterogeneous sample of absorbing galaxies, in agreement with previous searches published in the literature.
Regarding our objective of confirming the galaxy clusters at a maximum impact parameter of 2 Mpc from the QSO LOS:
-
•
From a sample of 31 cluster/group candidates, we confirmed 20 spanning a redshift range 0.2659 1.0152 with a mean mass consistent with typical of low-intermediate mass clusters. Non-confirmations of galaxy clusters/groups occurred mainly because we prioritized the detection of absorbing galaxies over the confirmation of galaxy cluster candidates.
Regarding the confirmation of our photometric hits and therefore confirming that the absorber galaxy belongs to the galaxy cluster:
-
•
We successfully determined the environment within which 12 of the absorbers reside: 8 inhabit clusters of galaxies and 4 appear in galaxy groups. Absorbers in this bound systems appear to lie between 468.16 and 656.25 km/s away from their cluster/group spectroscopic redshifts. This high success rate lends support to the results of paper I.
-
•
We applied our results to determine the degree of contamination due to field absorbers within the sample of Mg II absorbers matched to galaxy cluster/group environments. After spectroscopically confirming the systems, we found a contamination fraction of 17–29% due to field absorbers, increasing to 33–46% if we also classify group absorbers as contaminants.
-
•
We did not confirm any cluster of galaxies in fields where no candidate at the absorber redshift was expected to be present.
-
•
We found two group absorbers where no cluster of galaxies had been previously detected within the RCS1 survey. Hence, including these absorbers adds two more non-isolated absorbers to our sample.
To conclude, we prove the sample of photometric hits from Paper I is robust. Even though field absorbers may contaminate the sample (mostly due to misidentification of low redshift clusters, and instances where two absorptions fall within the photometric redshift uncertainty of the same cluster), they have a minimal impact on the sample of photometric hits in Paper I . However for future work they should be taken into account.
6. Acknowledgments
We would like to thank Franz Bauer, Cédric Ledoux and David Murphy for important suggestions included in the manuscript. SL, LFB, PL and NP were partly supported by the Chilean Centro de Astrofísica FONDAP No. 15010003. HA was supported by Proyecto CONICYT-ALMA 31070001 and Beca Magíster CONICYT; SL was supported by FONDECYT grant No. 1100214; LFB was supported by FONDECYT grants No. 1085286 and 1120676; NDP was also supported by a FONDECYT grant No. 1110328; and IL was supported by MECESUP. The RCS project is supported by grants to H. Y. from the National Science and Engineering Research Council of Canada and the Canada Research Chair Program. This research has made use of the NASA/IPAC Extragalactic Database (NED), which is operated by the Jet Propulsion Laboratory, California Institute of Technology, under contract with the National Aeronautics and Space Administration. Funding for the SDSS and SDSS-II has been provided by the Alfred P. Sloan Foundation, the Participating Institutions, the National Science Foundation, the US Department of Energy, the National Aeronautics and Space Administration, the Japanese Monbukagakusho, the Max-Planck Society and the Higher Education Funding Council for England. The SDSS web site is http://www.sdss.org/.
References
- Barrientos et al. (2004) Barrientos, L. F., Gladders, M. D., Yee, H. K. C., Infante, L., Ellingson, E., Hall, P. B., & Hertling, G. 2004, ApJ, 617, L17
- Bechtold & Ellingson (1992) Bechtold, J. & Ellingson, E., 1992, ApJ, 396, 20
- Beers et al. (1990) Beers, T. C., Flynn, K., & Gebhardt, K. 1990, AJ, 100, 32
- Blanton et al. (2001) Blanton, M. R., et al. 2001, AJ, 121, 2358
- Blindert (2006) Blindert, K. 2006, Ph.D. Thesis. University of Toronto, Canada
- Bouché et al. (2006) Bouché, N., Murphy, M. T., Péroux, C., Csabai, I., Wild, V. 2006, MNRAS, 371, 495
- Bowen, Blades & Pettini (1995) Bowen, D. V., Blades, J. C., Pettini, M. 1995, ApJ, 448, 634
- Carlberg et al. (1997) Carlberg R. G., Yee H. K. C., Ellingson E. 1997, ApJ, 478, 462
- Chen et al. (2010) Chen, H.-W., Helsby, J. E., Gauthier, J.-R., Shectman, S. A., Thompson, I. B., Tinker, J. L. 2010, ApJ, 714, 1521
- Chen & Tinker (2008) Chen, H.-W., & Tinker, J. L. 2008, ApJ, 687, 745
- Churchill & Charlton (1998) Churchill, C. W., Charlton, J. C. 1998, ASPC, 136, 187C
- Churchill, Steidel & Kacprzak (2004) Churchill C., Steidel C., Kacprzak G., In Workshop on Extraplanar Gas, ed. R. Braun, ASP proceedings 331, 2004
- Churchill et al. (2005) Churchill, C. W., Steidel, C. C., Kacprzak, G. G. 2005 in Astronomical Society of the Pacific Conference Series, Vol. 331, Extra-Planar Gas, ed. R. Braun, 387
- Coleman et al. (1980) Coleman, G. D., Wu, C. C., & Weedman, D. W. 1980, ApJS, 43, 393
- Dressler (1980) Dressler, A. 1980, ApJS, 42, 565
- Eigenbrod et al. (2007) Eigenbrod, A., Courbin, F., Meylan, G. 2007, A&A, 465, 51
- Fadda et al. (1996) Fadda D., Girardi M., Giuricin G., et al. 1996, ApJ, 473, 670
- Faure et al. (2004) Faure, C., Alloin, D., Kneib, J. P., & Courbin, F. 2004, A&A, 428, 741
- Fukugita et al. (1995) Fukugita, M., Shimasaku, K., & Ichikawa, T. 1995, PASP, 107, 945
- Gauthier, Chen & Tinker (2009) Gauthier, J.-R., Chen, H.-W., Tinker, J. L. 2009, ApJ, 702, 50
- Gauthier (2013) Gauthier, J.-R. 2013, MNRAS, 432, 1444
- Gerke et al. (2005) Gerke, B. F. et al. 2005, ApJ, 625, 6
- Gilbank et al. (2007) Gilbank, D. G., Yee, H. K. C., Ellingson, E., Gladders, M. D., Barrientos, L. F., Blindert, K. 2007, AJ, 134, 282
- Gilbank et al. (2008) Gilbank, D. G., et al. 2008, ApJ, 673, 742
- Gladders et al. (2002) Gladders, M. D., Yee, H. K. C., & Ellingson, E. 2002, AJ, 123, 1
- Gladders & Yee (2000) Gladders, M. D., Yee, H. K. C. 2000, AJ, 120, 2148
- Gladders & Yee (2005) Gladders, M. D., Yee, H. K. C. 2005, ApJS, 157, 1
- Goto et al. (2002) Goto, T., Sekiguchi, M., Nichol, R. C., et al. 2002, AJ, 123, 1807
- Kacprzak et al. (2005) Kacprzak, G. G., Churchill, C. W., Steidel, C. C. 2005, in P.R. Williams, C. Shu, B. Ménard (eds.), Probing Galaxies through Quasar Absorption Lines, (IAU), vol. 199
- Kacprzak et al. (2007) Kacprzak, G. G., Churchill, C. W., Steidel, C. C., Murphy, M. T., Evans, J. L. 2007, ApJ, 662, 909
- Kacprzak et al. (2010) Kacprzak, G. G., Murphy, M. T., & Churchill, C. W. 2010, MNRAS, 406, 445
- Le Brun et al. (1997) Le Brun, V., Bergeron, J., & Deharveng, J. M. 1997, A&A, 321, 733
- Lin & Zou (2001) Lin, W.-P., Zou, Z.-L. 2001, ChjAA, 1, 21
- Lindner, Alvensleben & Fricke (1996) Lindner, U., Alvensleben, U., Fricke, K. J. 1996, A&A, 316, 123
- López et al. (2008) López, S., Barrientos, L. F., Lira, P., Padilla, N., Gilbank, D. G., Gladders, M. D., Maza, J., Tejos, N., Vidal, M., Yee, H. K. C. 2008, ApJ, 679, 1144 (Paper I)
- Maller & Bullock (2004) Maller, A. H., & Bullock, J. S. 2004, MNRAS, 355, 694
- Ménard et al. (2011) Ménard, B., Wild, V., Nestor, D., Quider, A., Zibetti, S., Rao, S., & Turnshek, D. 2011, MNRAS, 417, 801
- Momcheva et al. (2006) Momcheva, I., Williams, K. A., Keeton, C. R., et al. 2006, ApJ, 641, 169
- Padilla et al. (2009) Padilla, N., Lacerna, I., López, S., Barrientos, L. F., Lira, P., Andrews, H., & Tejos, N. 2009, MNRAS, 395, 1135
- Rubin et al. (2010) Rubin, K. H. R., Prochaska, J. X., Koo, D. C., Phillips, A. C., & Weiner, B. J. 2010, ApJ, 712, 574
- Schlegel, Finkbeiner & Davis (1998) Schlegel, D. J., Finkbeiner, D. P., Davis, M. 1998, ApJ, 500, 525
- Steidel (1995) Steidel, C., C. 1995, in QSO Absorption Lines, Proceedings of the ESO Workshop Held at Garching, Germany, 21-24 November 1994, ed. G. Meylan. Springer-Verlag Berlin Heidelberg, New York, 139
- Steidel & Dickinson (1992) Steidel, C. C., Dickinson, M. 1992, ApJ, 394, 81
- Steidel, Dickinson & Persson (1994) Steidel, C. C., Dickinson, M., Persson, S. E. 1994, ApJ, L 75
- Steidel et al. (2002) Steidel, C. C., Kollmeier, J. A., Shapley, A. E., Churchill, C. W., Dickinson, M., & Pettini, M. 2002, ApJ, 570, 526
- Williams et al. (2006) Williams, K. A., Momcheva, I., Keeton, C. R., et al. 2006, ApJ, 646, 85
- Wilman et al. (2005) Wilman, D. J., Balogh, M. L., Bower, R. G., Mulchaey, J. S., Oemler, A., Carlberg, R. G., Morris, S. L., & Whitaker, R. J. 2005, MNRAS, 358, 71
- Windhorst et al. (1991) Windhorst, R. A., Burstein, D., Mathis, D. F., Neuschaefer, L. W., Bertola, F., Buson, L. M., Koo, D. C., Matthews, K., Barthel, P. D., Chambers, K. C. 1991, ApJ, 380, 362
- Wisotzki et al. (1996) Wisotzki, L., Koehler, T., López, S., Reimers, D. 1996, A&A, 315, L 405
- Wittman et al. (2001) Wittman, D., Tyson, J. A., Margoniner, V. E., Cohen, J. G., & Dell’Antonio, I. P. 2001, ApJ, 557, L89
- Yee (1991) Yee, H. K. C. 1991, PASP, 103, 396
- Yee & Ellingson (2003) Yee, H. K. C., & Ellingson, E. 2003, ApJ, 585, 215
- Yee & López-Cruz (1999) Yee, H. K. C., López-Cruz, O. 1999, AJ, 117, 1985
- Zibetti et al. (2005) Zibetti, S., White, S. D. M., Schneider, D. P., Brinkmann, J. 2005, MNRAS, 358, 949
- Zibetti et al. (2007) Zibetti, S., Ménard, B., Nestor, D. B., Quider, A. M., Rao, S. M., Turnshek, D. A. 2007, ApJ, 658, 161
Appendix A Special Remarks
A.1. On Individual Clusters
LOS 231500.81001831.2: As seen in Table 4, the field around the LOS 231500.81001831.2 presents 6 RCS1 cluster/group candidates that are spectroscopically confirmed by two cluster redshifts, one at 0.5040 and the other at 0.5870. All these RCS1 cluster/group candidates present low richness values ( 600) and low detection significance ( 3.3), excepting RCS2315060018.1 and RCS2315150015.8) indicating that these candidates are much less likely to be confirmed with limited follow-up spectroscopy per se. Also, since this survey is constrained by the number of slits we can observe, and our first priority was to find the absorbing galaxies, then it was not possible to put slits near all the cluster centers (see Figure 16). Moreover, all candidates appear superimposed in redshift (as seen in Figure 17), color and angular space (see Table 11 and Figure 16), which did not allow us to distinguish them individually. We observe a concentration of galaxies between redshifts 0.502 and 0.507, centered on a notorious peak at 0.504 (see Figure 17). These galaxies have () colors between 0.6 and 1.0, and occupy similar locations in the color magnitude diagrams built from considering objects at a projected distance 0.5 Mpc from each cluster center. Therefore, it is not easy to discriminate between the different candidates. This, however, it is not a major issue since we are mostly interested in determining the velocity difference between the cluster redshift estimate and the absorption redshift, in order to establish whether the absorber resides in a cluster environment or not, and here the presence of a galaxy cluster in terms of redshift overdensity, color and angular coverage is clear.
LOS 022441.09001547.9: Among the 3 low- cluster/group candidates that were not confirmed, one is at 0.173 near the LOS 022441.09001547.9. This galaxy cluster candidate may be a false positive detection as suggested by its low richness value 167 (3.25), and the fact that no redshift overdensity is observed in Figure 9, and a color magnitude relation is barely detected (and heavily polluted by galaxies at 0.3–0.4) considering all extended sources within 500 kpc from the cluster center (near object No. 14, see Figure 8). A possible explanation for such misidentification relies on the fact that RCS1 red-sequence finding algorithm works as long as (6 500 Å) and (9 100 Å) bands sample the 4 000 Å break, being more effective at isolating the red-sequence at 0.4 (Gladders & Yee, 2000, 2005), where the 4 000 Å break is entering the band ( 5 600 Å).
LOS to 022441.09001547.9 and LOS to 231958.70002449.3): About the other two unconfirmed low- cluster/group candidates ( 0.511, LOS to 022441.09001547.9; 0.651, LOS to 231958.70002449.3) though their richness ( 400) and detection significance values ( 3.6) support their presence, the number of redshifts available for those fields did not allow a proper confirmation of the systems. This is mainly because we prioritized to observe the objects near the LOS, instead of observing the objects near the cluster center positions.
LOS to 022839.32004623.0: Among the 10 cluster/group candidates at 0.7, only two were confirmed (the two high- cluster/group candidates near the LOS to 022839.32004623.0, see Table 4) and this was only possible due to the redshifts taken from NED database.
LOS 022441.09001547.9: The problem encountered with the low- cluster candidate in the field around 022441.09001547.9, is also found when looking at the redshift histogram of the field 022300.41005250.0. In this field, we can see a redshift overdensity at 0.19 (see Figure 7), that it is considered as a galaxy cluster at a photometric redshift 0.1973 by Goto et al. (2002). The RCS1 did not detect the presence of a significant red-sequence at such redshift, probably because of its finding algorithm. However it does not matter for the purpose of this work, since the photometric hits we expect to confirm are at 0.2.
RCS0228290045.8: Gerke et al. (2005) found a group of galaxies at a spectroscopic redshift 0.7700 that we detected at 0.7702 as the cluster redshift of RCS0228290045.8. Though center positions differ ( 1.5 Mpc), the population of galaxies at such redshift is seen throughout the entire GMOS pre-image field-of-view.
A.2. On Confirmed Photometric Hits
LOS 231500.81001831.2: There are two photometric hits confirmed with the same cluster environment in the field around the LOS 231500.81001831.2 (see Tables 4 and 5). As mentioned in 3.2, not being able to confirm individually superimposed galaxy cluster/group candidates in a single field is not a relevant problem in this case, because we are interested in highlighting that the environment where the absorption process took place was not that of an isolated galaxy, but a galaxy subjected to extreme events happening in clusters or groups of galaxies.
It should be noticed that even if the RCS1 detected different color magnitude relations, the overlap in color and angular space of several galaxies could be due to the presence of merging events or a filamentary structure just along the LOS where warm gas produced the absorption. If this were the case, the Mg II absorptions would be related to a dense environment too.
LOS 231958.70002449.3: One of the photometric hits detected in a group of galaxies is observed in the field centered on the LOS 231958.70002449.3. There are 5 cluster/group candidates that could not be distinguished individually based on redshift information only. This field is crowded with high- galaxies ( 0.7–0.8) quite red in color (() 1.0) and sufficiently faint ( 20.5), so that these galaxies may have been overlooked in the target selection algorithm or were observed but the S/N were not enough to retrieve a redshift from their spectra. Since the RCS1 cluster finding method has proven to work quite well at 0.7–0.8 (Gilbank et al., 2007), then the pair of galaxies at 0.8486 (No. 10 and 11, see Table 14 and Figure 22) could be tracing the external regions of the cluster candidate RCS2319440026.8 at 0.8440 ( 1.9–2 Mpc). This galaxy cluster candidate happens to be near the Mg II absorption redshift at 0.8463. Therefore, this system is now classified as a spectroscopic hit most probably associated with a group of galaxies. The unidentified Mg II absorbing galaxy could be located at the outskirts of this cluster/group of galaxies.
LOS 022441.09001547.9: The other spectroscopic hit in a group of galaxies was detected in the field 022441.09001547.9 at 0.3813 (see Table 5). Here the RCS1 cluster/group candidate near the absorption redshift 0.3791 was the cluster RCS0224430017.6. This one was finally confirmed based on color, redshift and angular space information at 0.3518 with 17 members (see the redshift histogram in Figure 9 and Table 4). However, the absorbing galaxy appears to have a companion (see Figure 8), both in the background 5 000 km/s from the confirmed cluster.
A.3. On Unconfirmed Photometric Hits
Out of the 4 unconfirmed photometric hits, one is at a high redshift ( 0.9) and we were unable to classify it, mostly because our spectroscopic survey turned out to be much more effective in detecting galaxies at 0.7, and not to such high redshifts.
Among the other 3 photometric hits reported in Paper I, one remains unconfirmed and two are no longer valid according to our spectroscopic survey of the fields.
LOS 022553.59005130.9: This field presents two Mg II absorption systems ( 0.6821 and 0.7500) that were associated to the same cluster/group candidate RCS0225580051.8 at 0.701 0.1 (see Table 4). This degeneracy is now broken because the galaxy cluster candidate was confirmed at 0.7489, becoming a spectroscopic hit with the absorption at 0.7500. Since, no other RCS1 galaxy cluster candidate is expected to be found near 0.6821, and no overdensity of galaxies is seen in redshift nor angular space at that absorption redshift, we conclude its designation as a photometric hit does not longer apply. However, the existence of a group of galaxies cannot be ruled out considering the spectroscopic depth of this survey. Thus, this photometric hit remains unconfirmed.
LOS to 022441.09001547.9: The photometric hit of the cluster RCS0224360014.2 at 0.173 with the absorption system at 0.2507 in the LOS to 022441.09001547.9, is now considered as a (confirmed) field absorber since this cluster/group candidate is most likely a false detection. Only 3 galaxies were detected within the cluster candidate photometric redshift uncertainty ( 0.2240 and 0.2730, see Paper I) at 0.2377, more than 3 000 km/s from the absorber redshift.
LOS to 231509.34001026.2: The last unconfirmed photometric hit is now classified as a (confirmed) field absorber in the LOS to 231509.34001026.2. Here we confirmed the (only) RCS1 cluster/group candidate near the LOS at 0.4282, 3 000 km/s away from the absorbing galaxy (at 0.4465). No overdensity of galaxies was found at the absorber redshift.
A.4. On Absorption Systems Not Classified As Photometric Hits
From a total of 9 absorption systems that are not classified as photometric hits in Paper I, we found 2 related to groups of galaxies and none associated to clusters of galaxies, which is consistent with their classification as “not photometric hits”.
One Mg II absorber found at a redshift consistent with that of a group of galaxies is in the LOS HE21492745A at 0.4090. Although no notorious redshift peak is found at this redshift (see Figure 15), the fact that it has a companion may be inducing some modification in its halo size.
The other spectroscopic hit related to a group of galaxies is in the field around the LOS 022441.09001547.9 at 0.6127. Even though this group of galaxies is undetected by the RCS1 color-based cluster finding algorithm, it does not mean that such group does not exist, recalling that the common definition of a group of galaxies primarily involves a high number density contrast with respect to the field; while the usual definition of a cluster admits the presence of a color magnitude relation for the brightest cluster members due to their coeval evolution since early times.
Among the other 7 absorption systems, we did not find clusters or groups of galaxies at the absorption redshifts. Four of these absorption systems are at high redshift 0.9 and as mentioned before, galaxies at these redshifts were difficult to observe with our spectroscopic survey. The other 3 systems are at redshifts 0.6, where our survey would have been able to detect galaxy overdensities. In fact in some cases we detected groups of galaxies, but all of them quite far from the absorber redshifts.
Therefore it is quite likely that these 7 systems are actually field absorbers consistent with their classification given in Paper I. In other words, this small sample is not contaminated by cluster absorbers. Nevertheless, there are 2 spectroscopic hits in groups that require further spectroscopy.
| The Sample | |||||||
|---|---|---|---|---|---|---|---|
| LOS | aaRedshift of the QSO. | NclusbbNumber of RCS1 cluster/group candidates lying at 2 Mpc from the LOS. | ccAbsorption redshift with 10-4. | [Å]ddRest-frame equivalent width determined in Paper I. | [Å] | Photo-hit eeAbsorption system that is considered as a photometric hit or not according to Tables 2 and 3 from Paper I, except for ∗ which corresponds to a new photo-hit. These are used in the analysis of the present work. | Photo-hit I ffAbsorption system that is considered as a photometric hit used in the analysis of Paper I, that is those having and Å |
| 022300.41005250.0 | 1.248 | 2 | 0.9500 | 0.043 | 0.010 | yes | no |
| 022441.09001547.9 | 1.201 | 5 | 0.2507 | 0.732 | 0.037 | yes | yes |
| 0.3791 | 1.181 | 0.043 | yes | yes | |||
| 0.6152 | 0.181 | 0.016 | no | no | |||
| 0.9402 | 0.080 | 0.020 | no | no | |||
| 1.0560 | 0.881 | 0.036 | no | no | |||
| 022553.59005130.9 | 1.815 | 5 | 0.6821 | 0.333 | 0.019 | yes | yes |
| 0.7500 | 0.159 | 0.015 | yes | yes | |||
| 1.0951 | 1.685 | 0.065 | no | no | |||
| 1.2258 | 0.177 | 0.032 | no | no | |||
| 022839.32004623.0 | 1.288 | 5 | 0.6548 | 0.597 | 0.016 | yes | yes |
| HE21492745A | 2.030 | 1 | 0.4090 | 0.228 | 0.008 | no | no |
| 0.4464 | 0.016 | 0.005 | yes∗ | no | |||
| 0.5144 | 0.028 | 0.003 | no | no | |||
| 0.6012 | 0.175 | 0.006 | yes | yes | |||
| 0.6032 | 0.015 | 0.004 | yes | no | |||
| 1.0189 | 0.219 | 0.013 | no | no | |||
| 231500.81001831.2 | 1.324 | 6 | 0.5043 | 0.148 | 0.009 | yes | yes |
| 0.5072 | 0.063 | 0.009 | yes | yes | |||
| 231509.34001026.2 | 0.848 | 1 | 0.4473 | 1.758 | 0.009 | yes | yes |
| 231759.63000733.2 | 1.148 | 1 | 0.6013 | 0.109 | 0.016 | yes | yes |
| 231958.70002449.3 | 1.891 | 5 | 0.4071 | 0.151 | 0.017 | no | no |
| 0.4158 | 0.192 | 0.021 | no | no | |||
| 0.8463 | 2.028 | 0.024 | yes | yes | |||
| The Sample | |||
|---|---|---|---|
| LOS | aaNumber of GMOS targets per field. A total of 440 slits (439 objects) were observed with GMOS. | bbNumber of GMOS targets at an impact parameter 150 kpc from the LOS. | ccMagnitude of the faintest target at an impact parameter 150 kpc from the LOS. |
| 022300.41005250.0 | 43 | 3 | 24.75 |
| 022441.09001547.9 | 51 | 8 | 23.64 |
| 022553.59005130.9 | 48 | 2 | 22.30 |
| 022839.32004623.0 | 50 | 3 | 23.00 |
| HE21492745A | 49 | 4 | |
| 231500.81001831.2 | 55 | 7 | 22.67 |
| 231509.34001026.2 | 49 | 6 | 22.91 |
| 231759.63000733.2 | 49 | 2 | 21.96 |
| 231958.70002449.3 | 46 | 4 | 25.73 |
| The Sample | ||||||||||
|---|---|---|---|---|---|---|---|---|---|---|
| LOS | [Å] | [Å] | aaRedshift of the absorbing galaxy. | [km s-1] | [kpc]bbGalaxy impact parameter to the LOS. | Photo-hit | Spectral Lines | |||
| 022300.41005250.0 | 0.9500 | 0.043 | 0.010 | yes | ||||||
| 022441.09001547.9 | 0.2507 | 0.732 | 0.037 | 0.2509 | 0.0001 | 48 | 23.13 | yes | [O II] 3727,Ca II K,Ca II H,Hγ,Hβ, | 18.78 |
| [O III] 4959,[O III] 5007,[N II] 6548–6583,Hα,[S II] 6716–6730 | ||||||||||
| 0.3791 | 1.181 | 0.043 | 0.3793 | 0.0001 | 44 | 32.31 | yes | [O II] 3727,Ca II K,Ca II H,Hδ,Hβ | 22.07 | |
| 0.6152 | 0.181 | 0.016 | 0.6152 | 0.0008 | 0 | 100.17 | no | [O II] 3727,Ca II K,Ca II H | 20.82 | |
| 0.9402 | 0.080 | 0.020 | no | |||||||
| 1.0560 | 0.881 | 0.036 | no | |||||||
| 022553.59005130.9 | 0.6821 | 0.333 | 0.019 | yes | ||||||
| 0.7500 | 0.159 | 0.015 | yes | |||||||
| 1.0951 | 1.685 | 0.065 | 1.0955 | 0.0008 | 57 | 16.38 | no | [O II] 3727 | 20.21 | |
| 1.2258 | 0.177 | 0.032 | no | |||||||
| 022839.32004623.0 | 0.6548 | 0.597 | 0.016 | yes | ||||||
| HE21492745A | 0.4090 | 0.228 | 0.008 | 0.4092 | 0.0001 | 43 | 142.71 | no | [O II] 3727,Ca II K,Ca II H,G band | |
| 0.4464 | 0.016 | 0.005 | yes | |||||||
| 0.5144 | 0.028 | 0.003 | no | |||||||
| 0.6012 | 0.175 | 0.006 | 0.6005 | 0.0002 | 131 | 65.78 | yes | [O II] 3727,Ca II K,Ca II H,G band | ||
| 0.6032 | 0.015 | 0.004 | 0.6030 | 0.0010 | 37 | 5.72 | yes | Ca II K,Ca II H,G band | ||
| 1.0189 | 0.219 | 0.013 | no | |||||||
| 231500.81001831.2 | 0.5043 | 0.148 | 0.009 | yes | ||||||
| 0.5072 | 0.063 | 0.009 | 0.5058 | 0.0008 | 279 | 73.36 | yes | [O II] 3727,Ca II K,Ca II H | 19.72 | |
| 231509.34001026.2 | 0.4473 | 1.758 | 0.009 | 0.4465 | 0.0008 | 166 | 61.19 | yes | [O II] 3727,Hδ,Hγ,Hβ,[O III] 4959, | 20.17 |
| [O III] 5007 | ||||||||||
| 231759.63000733.2 | 0.6013 | 0.109 | 0.016 | 0.6009 | 0.0002 | 75 | 84.92 | yes | [O II] 3727,Ca II K,Ca II H,G band | 21.49 |
| 231958.70002449.3 | 0.4071 | 0.151 | 0.017 | no | ||||||
| 0.4158 | 0.192 | 0.021 | no | |||||||
| 0.8463 | 2.028 | 0.024 | yes | |||||||
Note. — The LOS to the QSO 022553.59005130.9 also presents a high redshift absorption at 1.2258 as shown in Table 1. However, at such high redshift no absorbing galaxy could have been detected due to problems encountered with our observations. Therefore in the following it is removed from our sample (see 3.1).
| The Sample | ||||||
|---|---|---|---|---|---|---|
| Field | Cluster/Group | [km/s] | NaaNumber of galaxy cluster members. | Comments | ||
| 022300.41005250.0 | RCS0223020052.9 | 0.509 | 0.4386 | 300 90 | 8 | Central galaxies. There is a group at 0.4740 but do not follow a red-sequence. |
| RCS0222530055.1 | 0.939 | |||||
| 022441.09001547.9 | RCS0224360014.2 | 0.173 | Possible false positive detection. | |||
| RCS0224430017.6 | 0.431 | 0.3518 | 646 93 | 17 | Central galaxies. | |
| RCS0224310018.0 | 0.480 | 0.4338 | 234 73 | 8 | Central galaxies. Confirmation possible because of SDSS data. | |
| RCS0224540013.3 | 0.511 | |||||
| RCS0224490016.2 | 0.818 | There is one early type galaxy at at 1 Mpc from the cluster center. | ||||
| 022553.59005130.9 | RCS0226020055.5 | 0.352 | 0.3974 | 606 40 | 31 | Center outside field-of-view. Galaxies are at 1 Mpc from the cluster center. |
| RCS0225530052.5 | 0.423 | 0.4172 | 965 38 | 25 | Central galaxies. Immersed in the background of galaxies at 0.3956. | |
| RCS0225580051.8 | 0.701 | 0.7489 | 833 48 | 5 | Central galaxies. Galaxies follow a red-sequence. | |
| RCS0225460050.0 | 0.873 | |||||
| RCS0225560052.7 | 0.928 | |||||
| 022839.32004623.0 | RCS0228410044.9 | 0.271 | 0.2659 | 944 80 | 6 | Central galaxies. Confirmation possible because of SDSS data. |
| RCS0228440047.7 | 0.516 | 0.4934 | 314 49 | 5 | Central galaxies. | |
| RCS0228320046.5 | 0.629 | 0.6559 | 319 67 | 19 | We found one galaxy at the cluster center. | |
| RCS0228290045.8 | 0.774 | 0.7702 | 560 86 | 23 | Center outside field-of-view. These are at 1.5–2 Mpc from the cluster center. | |
| RCS0228280044.9 | 1.032 | 1.0152 | 742 57 | 22 | Confirmation possible because of NED data. | |
| HE21492745A | Group/Cluster | 0.603 | 0.6030 | 287 69 | 9 | Central galaxies. In agreement with M06. According to W06 these galaxies follow a red-sequence. |
| 231500.81001831.2 | RCS2315150015.8 | 0.496 | 0.5040 | 214 58 | 16 | Center outside field-of-view. |
| RCS2315120020.1 | 0.517 | 0.5040 | 214 58 | 16 | Center outside field-of-view. | |
| RCS2314590018.9 | 0.522 | 0.5040 | 214 58 | 16 | This is a preliminary result. | |
| RCS2315010013.6 | 0.557 | 0.5870 | 699 42 | 14 | The groups at 0.5040 and 0.5925 also could confirm this cluster. | |
| RCS2315060018.1 | 0.560 | 0.5040 | 214 58 | 16 | We may have detected the central galaxy at 0.5046. | |
| RCS2315150015.6 | 0.566 | 0.5870 | 699 42 | 14 | The groups at 0.5040 and 0.5925 also could confirm this cluster. | |
| 231509.34001028.2 | RCS2315100012.1 | 0.420 | 0.4282 | 735 46 | 10 | Central Galaxies. There is a group of galaxies with 0.3726 and 0.2 mag bluer in color. |
| 231759.63000733.2 | RCS2317550011.3 | 0.573 | 0.5974 | 631 25 | 12 | Center outside field-of-view. There is a group of galaxies at 0.4730 but do not follow a red-sequence. |
| 231958.70002449.3 | RCS2319470028.3 | 0.651 | There is a group of galaxies at 0.5614 near the cluster center. | |||
| RCS2319580025.1 | 0.789 | There are two galaxies at 0.7196. We may have observed central galaxies. | ||||
| RCS2319580023.2 | 0.796 | The groups at 0.8092 or 0.7194 may also confirm it. | ||||
| RCS2319440027.0 | 0.805 | There are two galaxies at 0.8090. | ||||
| RCS2319440026.8 | 0.844 | Center outside field-of-view. There are two galaxies at 0.8486 and 1.5 Mpc from the LOS. | ||||
Note. — The field centered on HE21492745A could not be studied photometrically. However, according to M06 and W06 there appear to be photometrically and spectroscopically two clusters of galaxies at 0.6030 and 0.4465.
| Field | [Å] | [Å] | [km s-1] | [kpc] | Photo-hit | Photo-hit I | [km/s] | N | [km/s] | ||||
|---|---|---|---|---|---|---|---|---|---|---|---|---|---|
| 022300.41005250.0 | 0.9500 | 0.043 | 0.010 | yes | no | ||||||||
| 022441.09001547.9 | 0.2507aaAs mentioned in 3.2, the galaxy cluster at 0.173 in the field 022441.09001547.9 (Table 4) seems to be a misidentification and as such its association to the absorption at 0.2507 as a photometric hit is no longer valid. Only 3 galaxies were detected within the cluster candidate photometric redshift uncertainty ( 0.2240 and 0.2730, see Paper I) at 0.2377 at a rest-frame velocity 3 000 km/s from the absorber redshift. | 0.732 | 0.037 | 0.2509 | 0.0001 | 48 | 23.13 | yes | yes | ||||
| 0.3791 | 1.181 | 0.043 | 0.3793 | 0.0001 | 44 | 32.31 | yes | yes | 0.3791∗ | ccNo velocity dispersion estimate is given in this case as there are only 2–3 group members. | 2 | 43.50 | |
| 0.6152 | 0.181 | 0.016 | 0.6152 | 0.0008 | 0 | 100.17 | no | no | 0.6127∗ | ccNo velocity dispersion estimate is given in this case as there are only 2–3 group members. | 3 | 473.36 | |
| 0.9402 | 0.080 | 0.020 | no | no | |||||||||
| 1.0560 | 0.881 | 0.036 | no | no | |||||||||
| 022553.59005130.9 | 0.6821 | 0.333 | 0.019 | yes | yes | ||||||||
| 0.7500 | 0.159 | 0.015 | yes | yes | 0.7489 | 833 48 | 5 | 188.63 | |||||
| 1.0951 | 1.685 | 0.065 | 1.0955 | 0.0008 | 57 | 16.38 | no | no | |||||
| 1.2258 | 0.177 | 0.032 | no | no | |||||||||
| 022839.32004623.0 | 0.6548 | 0.597 | 0.016 | yes | yes | 0.6559 | 319 67 | 19 | 199.35 | ||||
| HE21492745A | 0.4090 | 0.228 | 0.008 | 0.4092 | 0.0001 | 43 | 142.71 | no | no | 0.4095∗ | ccNo velocity dispersion estimate is given in this case as there are only 2–3 group members. | 2 | 59.60 |
| 0.4464 | 0.016 | 0.005 | yesbbA red-sequence at 0.40 was detected by W06 and later spectroscopically confirmed in M06 at 0.4465. Here we consider it as a spectroscopic hit associated with a cluster of galaxies, even though we did not detect a considerable overdensity expected at that redshift. | no | 0.4482 | 292 32 | 5 | 373.11 | |||||
| 0.5144 | 0.028 | 0.003 | no | no | |||||||||
| 0.6012 | 0.175 | 0.006 | 0.6005 | 0.0002 | 131 | 65.78 | yes | yes | 0.6030 | 287 69 | 9 | 468.24 | |
| 0.6032 | 0.015 | 0.004 | 0.6030 | 0.0010 | 37 | 5.72 | yes | no | 0.6030 | 287 69 | 9 | 37.43 | |
| 1.0189 | 0.219 | 0.013 | no | no | |||||||||
| 231500.81001831.2 | 0.5043 | 0.148 | 0.009 | yes | yes | 0.5040 | 214 58 | 16 | 59.83 | ||||
| 0.5072 | 0.063 | 0.009 | 0.5058 | 0.0008 | 279 | 73.36 | yes | yes | 0.5040 | 214 58 | 16 | 358.83 | |
| 231509.34001026.2 | 0.4473 | 1.758 | 0.009 | 0.4465 | 0.0008 | 166 | 61.19 | yes | yes | ||||
| 231759.63000733.2 | 0.6013 | 0.109 | 0.016 | 0.6009 | 0.0002 | 75 | 84.92 | yes | yes | 0.5974 | 631 25 | 12 | 656.60 |
| 231958.70002449.3 | 0.4071 | 0.151 | 0.017 | no | no | ||||||||
| 0.4158 | 0.192 | 0.021 | no | no | |||||||||
| 0.8463 | 2.028 | 0.024 | yes | yes | 0.8486∗ | ccNo velocity dispersion estimate is given in this case as there are only 2–3 group members. | 2 | 373.49 |
Note. — All spectroscopic hits most probably associated with a galaxy group are denoted by symbols.
| No. | RA(J2000) | DEC(J2000) | FlagaaRedshift reliability classifier. | - | Comments | |||
|---|---|---|---|---|---|---|---|---|
| 1 | 02 22 56.77 | 00 54 57.56 | 0.43834 | 0.00007 | 1 | 20.26 | 0.81 | CaII H,CaII K |
| 2 | 02 22 51.75 | 00 55 10.67 | 0.19624 | 0.00057 | 3 | 18.72 | 0.63 | MgI 5176,Na D 5892 |
| 3 | 02 22 57.55 | 00 54 19.48 | 0.47211 | 0.00010 | 1 | 19.00 | 0.55 | [OII]3727,CaII H,CaII K,Hβ |
| 4 | 02 23 03.31 | 00 54 01.04 | 0.41877 | 0.00012 | 2 | 21.72 | 0.50 | [OII]3727,Hβ,[OIII]5007 |
| 5 | 02 22 52.92 | 00 53 53.23 | 0.29379 | 0.00005 | 1 | 21.28 | 0.24 | Hγ,Hβ,[OIII]4959,[OIII]5007 |
| 6 | 02 22 59.48 | 00 53 40.52 | 0 | 20.72 | 1.84 | |||
| 7 | 02 22 59.34 | 00 53 34.01 | 0 | 21.51 | 1.54 | |||
| 8 | 02 23 02.07 | 00 53 15.97 | 0.43740 | 0.00007 | 1 | 20.18 | 0.83 | CaII H,CaII K |
| 9 | 02 23 01.56 | 00 52 57.65 | 0 | 23.29 | 1.20 | |||
| 10 | 02 23 00.02 | 00 53 03.73 | 0.83062 | 0.00080 | 3 | 22.17 | 1.29 | [OII]3727 |
| 11 | 02 23 00.18 | 00 52 44.47 | 0 | 22.76 | 0.49 | |||
| 12 | 02 22 58.99 | 00 52 30.83 | 0 | 20.16 | 1.46 | |||
| 13 | 02 23 09.71 | 00 51 55.22 | 0.70911 | 0.00012 | 1 | 21.21 | 1.00 | [OII]3727,CaII H,CaII K |
| 14 | 02 22 59.61 | 00 52 05.38 | 0.24733 | 0.00005 | 1 | 21.63 | 0.15 | Hβ,[OIII]4959,[OIII]5007,Hα |
| 15 | 02 22 57.32 | 00 52 14.20 | 0.48234 | 0.00010 | 1 | 20.41 | 0.64 | [OII]3727,CaII H,Hβ,[OIII]5007 |
| 16 | 02 23 09.31 | 00 50 56.22 | 0.30679 | 0.00010 | 1 | 20.19 | 0.32 | CaII H,Hβ,[OIII]4959,[OIII]5007 |
| 17 | 02 23 08.63 | 00 50 31.06 | 0.82949 | 0.00085 | 2 | 20.80 | 1.28 | [OII]3727,CaII H |
| 18 | 02 23 06.60 | 00 51 06.01 | 0.31065 | 0.00010 | 1 | 20.87 | 0.37 | [OII]3727,[SII]4068,[OIII]4959,[OIII]5007 |
| 19 | 02 23 06.42 | 00 51 30.28 | 0.19584 | 0.00012 | 2 | 21.02 | 0.42 | Hβ,[OIII]4959,[OIII]5007 |
| 20 | 02 22 50.39 | 00 50 39.98 | 0.19500 | 0.00007 | 1 | 20.81 | 0.31 | Hβ,[OIII]5007 |
| 21 | 02 22 52.79 | 00 51 45.54 | 0.61172 | 0.00021 | 3 | 19.00 | 0.46 | Hβ,[OIII]4959 |
| 22 | 02 22 50.60 | 00 51 14.26 | 0.08511 | 0.00004 | 1 | 19.14 | 0.24 | HeI5875,[NII]6548,Hα,[NII]6583,[SII]6716,[SII]6730 |
| 23 | 02 22 56.34 | 00 50 15.50 | 0.19658 | 0.00006 | 1 | 20.88 | 0.29 | Hβ,[OIII]5007,Hα |
| 24 | 02 23 09.66 | 00 55 06.56 | 0.42789 | 0.00006 | 1 | 19.52 | 0.69 | CaII H,CaII K,G band |
| 25 | 02 23 04.30 | 00 54 28.26 | 0.42024 | 0.00012 | 1 | 20.46 | 0.41 | [OII]3727,[OIII]4959,[OIII]5007 |
| 26 | 02 23 03.39 | 00 54 49.18 | 0.47211 | 0.00009 | 1 | 19.79 | 0.79 | [OII]3727,CaII H,CaII K,Hδ,G band |
| 27 | 02 22 57.08 | 00 54 38.34 | 0.44022 | 0.00009 | 1 | 18.92 | 0.64 | [OII]3727,CaII H,CaII K,Hβ,[OIII]5007 |
| 28 | 02 22 50.15 | 00 54 19.26 | 0.19301 | 0.00042 | 2 | 18.37 | 0.59 | MgI 5176,Na D 5892 |
| 29 | 02 22 54.17 | 00 55 21.11 | 0.38917 | 0.00012 | 1 | 20.20 | 0.64 | CaII H,CaII K,G band |
| 30 | 02 23 06.04 | 00 53 52.08 | 0.12877 | 0.00003 | 1 | 17.93 | 0.58 | [NII]6548,[NII]6583,Hα,[SII]6716 |
| 31 | 02 23 09.74 | 00 53 17.81 | 0.12794 | 0.00004 | 1 | 18.35 | 0.58 | [OII]3727,Hβ,[OIII]5007,[NII]6548,Hα,[NII]6583,[SII]6716 |
| 32 | 02 23 04.57 | 00 53 34.40 | 0.42039 | 0.00014 | 2 | 19.12 | 0.60 | [OII]3727,CaII K |
| 33 | 02 23 04.60 | 00 52 01.31 | 0.47146 | 0.00006 | 1 | 20.32 | 0.87 | CaII H,CaII K,G band |
| 34 | 02 23 02.57 | 00 52 32.66 | 0.43393 | 0.00012 | 1 | 19.65 | 0.81 | CaII H,CaII K,G band |
| 35 | 02 23 02.00 | 00 53 03.30 | 0.43615 | 0.00012 | 1 | 19.97 | 0.81 | CaII H,CaII K,G band |
| 36 | 02 23 01.78 | 00 52 44.69 | 0.43908 | 0.00012 | 1 | 19.16 | 0.87 | CaII H,CaII K,G band |
| 37 | 02 22 52.30 | 00 52 19.52 | 0.12706 | 0.00057 | 2 | 16.44 | 0.59 | MgI 5176,Na D 5892 |
| 38 | 02 23 00.43 | 00 51 36.79 | 0.43924 | 0.00012 | 1 | 19.83 | 0.85 | CaII H,CaII K,G band |
| 39 | 02 22 53.21 | 00 51 20.84 | 0.19601 | 0.00049 | 3 | 18.33 | 0.61 | MgI 5176,Na D 5892 |
| 40 | 02 22 59.56 | 00 51 03.46 | 0.43909 | 0.00005 | 1 | 20.19 | 0.61 | [OII]3727,CaII H,CaII K,Hβ |
| 41 | 02 22 53.76 | 00 50 54.85 | 0.61774 | 0.00040 | 2 | 20.11 | 0.80 | [OII]3727,CaII H,CaII K |
| 42 | 02 23 09.89 | 00 50 39.52 | 0.19435 | 0.00007 | 1 | 18.60 | 0.66 | CaII H,CaII K |
| 43 | 02 23 08.45 | 00 50 22.31 | 0.47197 | 0.00007 | 2 | 20.47 | 0.82 | [OII]3727,CaII K |
Note. — Whenever information could not be obtained for a specific target, a symbol ’…’ is used. Stars found in our data have zero redshift.
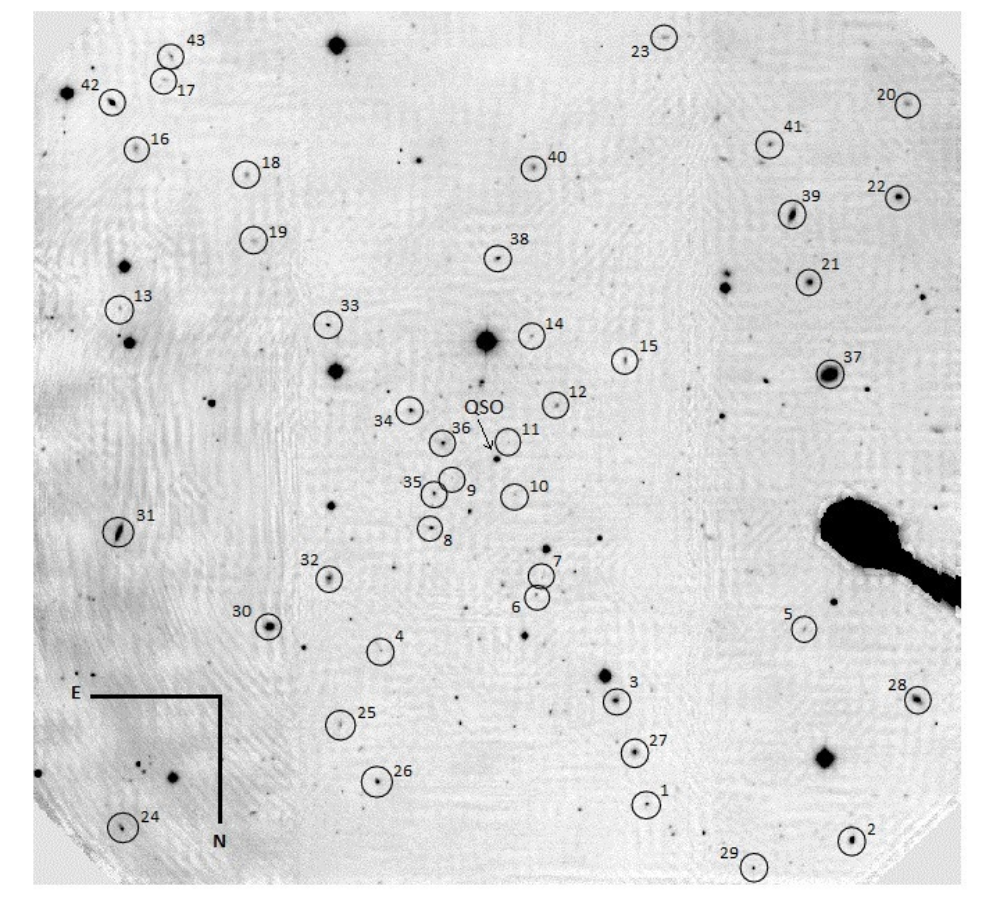
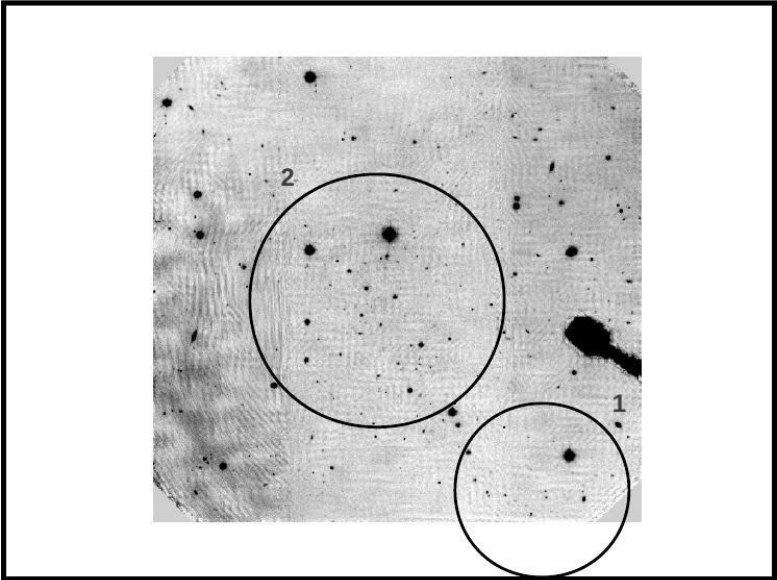
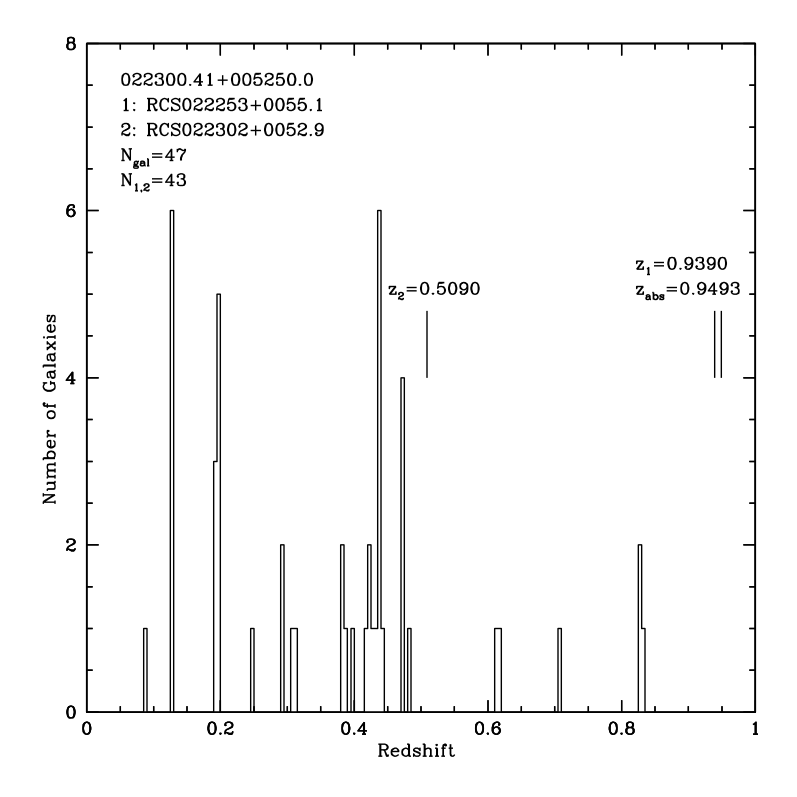
| No. | RA(J2000) | DEC(J2000) | FlagaaRedshift reliability classifier. | - | Comments | |||
|---|---|---|---|---|---|---|---|---|
| 1 | 02 24 31.66 | 00 15 45.32 | 0.35485 | 0.00005 | 2 | 18.63 | 0.70 | CaII H,CaII K,G band,Hγ |
| 2 | 02 24 31.02 | 00 15 40.36 | 0.35510 | 0.00022 | 3 | 20.78 | 0.70 | CaII H,CaII K,G band |
| 3 | 02 24 34.25 | 00 15 11.77 | 0.64546 | 0.00010 | 1 | 20.72 | 0.66 | [OII]3727,CaII H,CaII K,Hδ |
| 4 | 02 24 35.04 | 00 14 37.57 | 0.38374 | 0.00010 | 1 | 20.94 | 0.54 | Hβ,[OIII]5007,Hα,[NII]6583 |
| 5 | 02 24 32.44 | 00 13 32.30 | 0.63028 | 0.00033 | 3 | 23.40 | 0.25 | [OII]3727,[OIII]5007 |
| 6 | 02 24 33.33 | 00 13 55.92 | 0.35481 | 0.00012 | 1 | 21.67 | 0.51 | Hβ,[OIII]4959,[OIII]5007 |
| 7 | 02 24 39.05 | 00 17 33.97 | 0.56784 | 0.00021 | 3 | 22.39 | 0.63 | [OII]3727,CaII H |
| 8 | 02 24 39.78 | 00 16 19.31 | 0.81839 | 0.00016 | 2 | 20.35 | 1.66 | CaII H,CaII K |
| 9 | 02 24 41.41 | 00 16 07.39 | 0.93172 | 0.00080 | 3 | 23.41 | 0.17 | [OII]3727 |
| 10 | 02 24 37.07 | 00 15 46.76 | 0.35191 | 0.00022 | 3 | 21.72 | 0.47 | [OII]3727,CaII H,CaII K,Hβ,[OIII]5007 |
| 11 | 02 24 40.83 | 00 15 44.68 | 0.25088 | 0.00011 | 1 | 21.23 | 0.50 | [OII]3727,Hγ,Hβ,[OIII]4959,[OIII]5007,Hα,[NII]6583 |
| 12 | 02 24 36.50 | 00 15 28.44 | 0.35217 | 0.00009 | 1 | 20.35 | 0.65 | [OII]3727,CaII H,CaII K,Hβ,[OIII]5007 |
| 13 | 02 24 42.07 | 00 15 13.46 | 0.68534 | 0.00005 | 2 | 22.06 | 0.67 | CaII H,CaII K,[OII]3727,Hδ |
| 14 | 02 24 37.82 | 00 14 23.68 | 0.43117 | 0.00002 | 1 | 21.35 | 0.42 | [OII]3727,CaII H,CaII K,Hβ,[OIII]5007 |
| 15 | 02 24 38.27 | 00 14 23.75 | 0.77796 | 0.00080 | 2 | 21.18 | 0.45 | [OII]3727 |
| 16 | 02 24 40.27 | 00 13 55.70 | 0 | 20.47 | 0.51 | |||
| 17 | 02 24 43.87 | 00 17 27.38 | 0 | 21.72 | 0.49 | |||
| 18 | 02 24 43.13 | 00 15 10.01 | 0.98009 | 0.00080 | 2 | 22.12 | 0.90 | [OII]3727 |
| 19 | 02 24 46.16 | 00 18 03.06 | 0.10770 | 0.00012 | 1 | 21.31 | 0.13 | Hβ,[OIII]5007,Hα |
| 20 | 02 24 45.53 | 00 14 38.94 | 0.36228 | 0.00003 | 1 | 20.99 | 0.31 | Hγ,Hβ,[OIII]4959,[OIII]5007 |
| 21 | 02 24 47.76 | 00 17 25.66 | 1.22330 | 0.00018 | 1 | 23.67 | 0.16 | FeII23742382,MnII2576,FeII2586,MnII2594,FeII2600 |
| 22 | 02 24 46.76 | 00 17 09.28 | 0.34656 | 0.00013 | 1 | 20.83 | 0.62 | [OII]3727,CaII H,CaII K,Hβ,[OIII]5007 |
| 23 | 02 24 48.50 | 00 16 20.78 | 0.37887 | 0.00006 | 1 | 21.28 | 0.31 | [OII]3727,CaII H,CaII K,Hβ,[OIII]5007,Hγ |
| 24 | 02 24 50.62 | 00 16 02.06 | 0.61225 | 0.00080 | 2 | 20.82 | 0.80 | [OII]3727 |
| 25 | 02 24 49.69 | 00 15 32.40 | 0.30797 | 0.00012 | 1 | 20.41 | 0.37 | [OII]3727,CaII K,Hβ,[OIII]5007 |
| 26 | 02 24 51.31 | 00 14 19.57 | 0.38888 | 0.00006 | 1 | 21.97 | 0.49 | Hβ,[OIII]5007,Hα |
| 27 | 02 24 31.89 | 00 17 49.09 | 0.43430 | 0.00021 | 2 | 19.19 | 0.83 | CaII H,CaII K |
| 28 | 02 24 31.19 | 00 14 49.38 | 0.39753 | 0.00007 | 1 | 20.76 | 0.56 | [OII]3727,[OIII]5007 |
| 29 | 02 24 35.35 | 00 14 37.57 | 0.20110 | 0.00042 | 3 | 20.94 | 0.54 | [OIII]4959,[OIII]5007 |
| 30 | 02 24 34.54 | 00 14 36.78 | 0.34920 | 0.00020 | 3 | 20.46 | 0.75 | CaII H,CaII K |
| 31 | 02 24 33.68 | 00 13 43.86 | 0.74531 | 0.00060 | 3 | 20.72 | 0.80 | [OII]3727 |
| 32 | 02 24 32.86 | 00 13 38.35 | 0.75270 | 0.00014 | 3 | 20.35 | 1.51 | [OII]3727,CaII H |
| 33 | 02 24 36.21 | 00 13 56.06 | 0.77845 | 0.00080 | 3 | 20.66 | 0.95 | [OII]3727 |
| 34 | 02 24 38.89 | 00 16 46.52 | 0.35460 | 0.00035 | 3 | 19.77 | 0.69 | CaII H,CaII K,G band |
| 35 | 02 24 41.29 | 00 15 43.09 | 0.37929 | 0.00012 | 1 | 19.00 | 0.51 | [OII]3727,Hβ,Hδ |
| 36 | 02 24 41.85 | 00 15 38.81 | 0.61516 | 0.00080 | 3 | 21.42 | 0.52 | [OII]3727 |
| 37 | 02 24 42.38 | 00 15 18.94 | 0.68548 | 0.00080 | 3 | 21.86 | 0.80 | [OII]3727 |
| 38 | 02 24 40.62 | 00 15 12.02 | 0.55876 | 0.00010 | 1 | 20.46 | 0.59 | [OII]3727,CaII H,CaII K |
| 39 | 02 24 40.01 | 00 15 11.20 | 0.35013 | 0.00015 | 1 | 19.84 | 0.78 | CaII H,CaII K,G band,Hγ |
| 40 | 02 24 37.90 | 00 14 49.70 | 0.35554 | 0.00012 | 3 | 20.19 | 0.53 | Hβ,[OIII]4959,[OIII]5007 |
| 41 | 02 24 45.98 | 00 17 54.02 | 0.35270 | 0.00023 | 2 | 19.49 | 0.73 | CaII H,CaII K,G band |
| 42 | 02 24 44.13 | 00 17 45.60 | 0.35144 | 0.00004 | 1 | 16.68 | 0.75 | CaII H,CaII K,Hδ,G band,Hβ,MgI5175 |
| 43 | 02 24 46.39 | 00 17 35.77 | 0.68621 | 0.00023 | 2 | 19.54 | 1.30 | CaII H,CaII K |
| 44 | 02 24 49.54 | 00 17 23.53 | 0.34470 | 0.00042 | 3 | 19.61 | 0.69 | CaII K,G band |
| 45 | 02 24 45.15 | 00 13 52.86 | 0 | 20.26 | 0.77 | |||
| 46 | 02 24 48.87 | 00 16 13.44 | 0.61090 | 0.00076 | 2 | 20.51 | 1.25 | CaII H,CaII K,G band |
| 47 | 02 24 48.36 | 00 16 11.89 | 0.61190 | 0.00080 | 3 | 20.20 | 1.35 | CaII K |
| 48 | 02 24 47.70 | 00 13 47.78 | 0.43289 | 0.00013 | 1 | 18.75 | 0.62 | CaII H,CaII K,G band,Hδ,Hβ |
| 49 | 02 24 51.37 | 00 17 20.54 | 0.77240 | 0.00064 | 3 | 23.75 | 0.92 | [OII]3727,Hγ |
| 50 | 02 24 50.76 | 00 17 17.38 | 0.43410 | 0.00030 | 3 | 20.35 | 0.56 | [OII]3727,Hβ |
| 51 | 02 24 50.11 | 00 15 31.00 | 0.43202 | 0.00006 | 1 | 21.07 | 0.38 | [OII]3727,Hβ,[OIII]5007 |
Note. — Whenever information could not be obtained for a specific target, a symbol ’…’ is used. Stars found in our data have zero redshift.
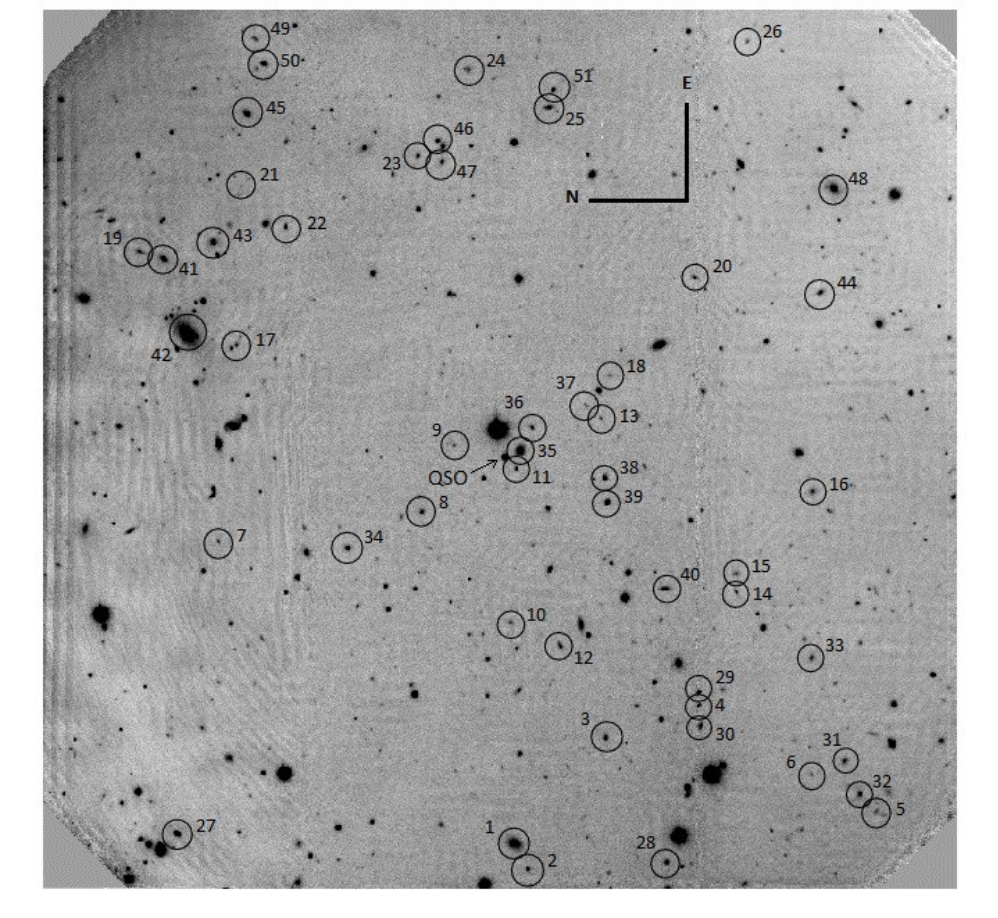
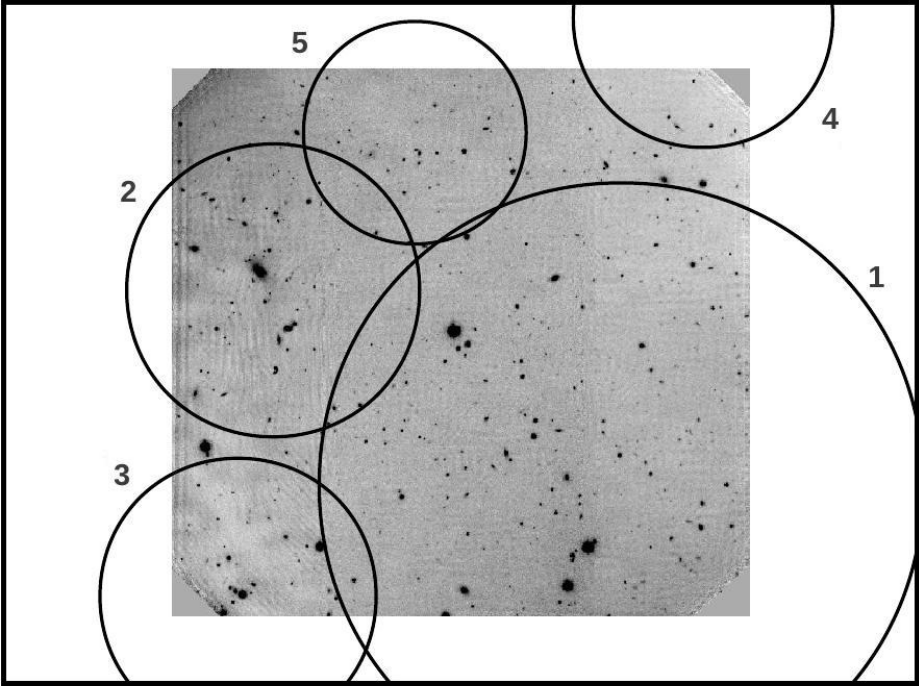
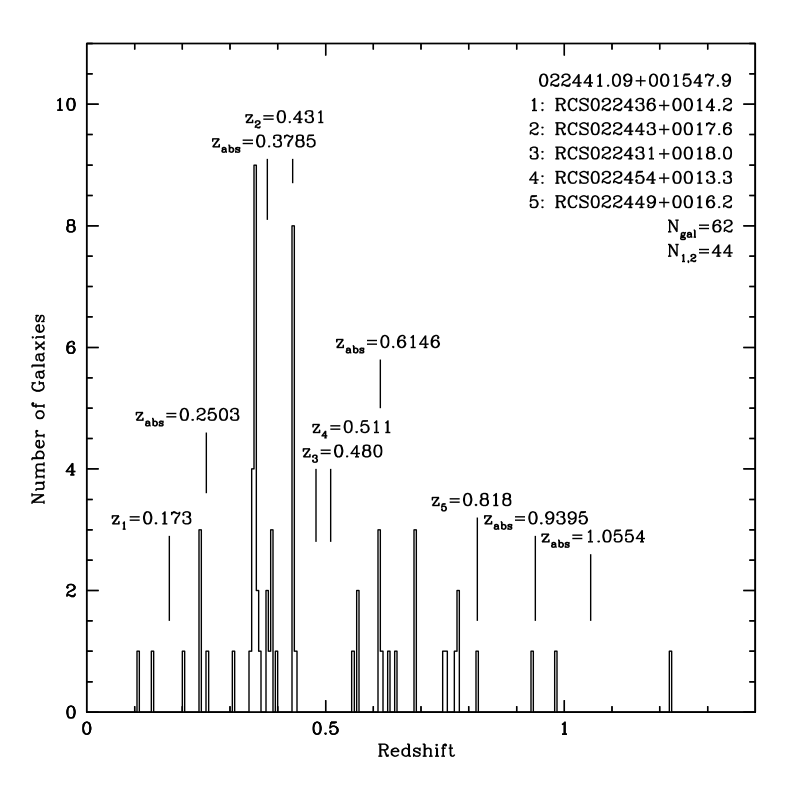
| No. | RA(J2000) | DEC(J2000) | FlagaaRedshift reliability classifier. | - | Comments | |||
|---|---|---|---|---|---|---|---|---|
| 1 | 02 25 50.89 | 00 49 08.83 | 0.40633 | 0.00011 | 1 | 20.36 | 0.53 | [OII]3727,CaII K,Hβ,[OIII]5007 |
| 2 | 02 25 54.06 | 00 49 01.42 | 0.39400 | 0.00008 | 1 | 21.80 | 0.26 | [OII]3727,Hβ,[OIII]4959,[OIII]5007 |
| 3 | 02 25 57.11 | 00 49 30.68 | 0.27039 | 0.00007 | 1 | 21.13 | 0.27 | [OII]3727,Hβ,[OIII]4959,[OIII]5007 |
| 4 | 02 25 57.42 | 00 49 59.84 | 0.51153 | 0.00007 | 1 | 21.96 | 1.00 | [OII]3727,Hγ,Hβ,[OIII]5007 |
| 5 | 02 25 44.97 | 00 49 54.80 | 0.09798 | 0.00004 | 1 | 19.52 | 0.21 | [OII]3727,Hβ,[OIII]4959,[OIII]5007,Hα,[NII]6583,[SII]6716,[SII]6730 |
| 6 | 02 25 46.36 | 00 49 32.16 | 0.43080 | 0.00045 | 3 | 21.40 | 0.75 | CaII H,CaII K |
| 7 | 02 25 46.48 | 00 50 14.71 | 0.19232 | 0.00011 | 1 | 21.05 | 0.13 | [OII]3727,Hβ,[OIII]4959,[OIII]5007 |
| 8 | 02 25 47.47 | 00 50 31.96 | 0.58654 | 0.00018 | 1 | 20.31 | 1.15 | [OII]3727,CaII H,CaII K |
| 9 | 02 25 50.06 | 00 49 39.65 | 0.09824 | 0.00022 | 1 | 22.39 | 0.33 | Hβ,[OIII]4959,[OIII]5007 |
| 10 | 02 25 52.69 | 00 50 25.22 | 0.74548 | 0.00080 | 2 | 21.51 | 0.80 | [OII]3727 |
| 11 | 02 25 54.12 | 00 51 28.22 | 0.57103 | 0.00035 | 1 | 21.01 | 1.01 | CaII H,CaII K |
| 12 | 02 25 55.72 | 00 51 27.58 | 0.68241 | 0.00012 | 1 | 20.68 | 0.63 | [OII]3727,CaII H,CaII K |
| 13 | 02 25 59.99 | 00 52 09.52 | 0.39532 | 0.00003 | 1 | 20.27 | 0.37 | Hγ,Hβ,[OIII]4959,[OIII]5007 |
| 14 | 02 25 43.39 | 00 51 03.13 | 0.40418 | 0.00008 | 1 | 19.58 | 0.55 | [OII]3727,CaII H,CaII K,Hδ |
| 15 | 02 25 49.06 | 00 52 23.74 | 0.19824 | 0.00006 | 1 | 20.48 | 0.24 | [OII]3727,Hβ,[OIII]4959,[OIII]5007 |
| 16 | 02 25 53.77 | 00 52 21.36 | 0.39449 | 0.00005 | 1 | 20.09 | 0.71 | [OII]3727,Hβ,[OIII]4959,[OIII]5007 |
| 17 | 02 25 53.60 | 00 52 30.86 | 0.74775 | 0.00080 | 3 | 21.79 | 0.91 | [OII]3727 |
| 18 | 02 25 54.17 | 00 52 41.99 | 0.53291 | 0.00006 | 1 | 19.72 | 0.79 | [OII]3727,CaII H,CaII K,Hγ |
| 19 | 02 25 55.54 | 00 52 19.49 | 0.23591 | 0.00006 | 1 | 20.93 | 0.32 | Hγ,Hβ,[OIII]4959,[OIII]5007,Hα,[NII]6583 |
| 20 | 02 25 57.39 | 00 52 06.49 | 0.39743 | 0.00013 | 1 | 20.29 | 0.59 | CaII H,CaII K,Hδ,G band |
| 21 | 02 25 43.42 | 00 52 34.86 | 0.40693 | 0.00012 | 1 | 21.02 | 0.59 | [OII]3727,Hβ,[OIII]5007 |
| 22 | 02 25 44.82 | 00 52 20.71 | 0.42169 | 0.00008 | 1 | 21.91 | -0.21 | [OII]3727,Hγ,Hβ,[OIII]4959,[OIII]5007 |
| 23 | 02 25 44.49 | 00 53 24.58 | 0.13893 | 0.00004 | 1 | 21.86 | 0.59 | Hβ,[OIII]4959,[OIII]5007,Hα |
| 24 | 02 25 47.02 | 00 53 03.62 | 0.40838 | 0.00034 | 1 | 20.62 | 0.68 | [OII]3727,Hδ,Hγ,Hβ,[OIII]5007 |
| 25 | 02 25 48.33 | 00 53 25.15 | 0.12931 | 0.00005 | 1 | 21.27 | 0.53 | Hγ,Hβ,[OIII]4959,[OIII]5007,Hα |
| 26 | 02 25 50.75 | 00 53 03.98 | 0.73801 | 0.00023 | 1 | 20.94 | 1.45 | [OII]3727,CaII H,CaII K |
| 27 | 02 25 53.60 | 00 54 03.31 | 0.66596 | 0.00004 | 1 | 24.94 | -0.30 | [OII]3727,Hγ,Hβ,[OIII]4959 |
| 28 | 02 25 49.29 | 00 48 29.16 | 0.29930 | 0.00085 | 2 | 19.98 | 0.82 | CaII K,G band |
| 29 | 02 25 49.18 | 00 48 56.09 | 0.75676 | 0.00025 | 3 | 21.16 | 1.12 | [OII]3727,CaII K |
| 30 | 02 25 47.58 | 00 49 07.97 | 0.56685 | 0.00010 | 1 | 20.22 | 0.34 | [OII]3727,CaII H,CaII K |
| 31 | 02 25 48.28 | 00 49 39.54 | 0.31383 | 0.00012 | 1 | 19.83 | 0.64 | CaII H,CaII K,G band |
| 32 | 02 25 48.09 | 00 49 48.61 | 0.40926 | 0.00019 | 1 | 20.61 | 0.73 | [OII]3727,CaII H,CaII K,Hδ,Hβ |
| 33 | 02 25 48.37 | 00 50 03.44 | 0.41511 | 0.00009 | 1 | 20.02 | 0.67 | [OII]3727,CaII H,CaII K,Hδ,Hβ |
| 34 | 02 25 48.18 | 00 50 40.42 | 0.41906 | 0.00022 | 1 | 19.62 | 0.74 | [OII]3727,CaII H,CaII K |
| 35 | 02 25 50.78 | 00 50 36.74 | 0.16005 | 0.00013 | 1 | 16.95 | 0.54 | [OII]3727,CaII H,CaII K,Hδ,Hβ,[OIII]5007 |
| 36 | 02 25 53.67 | 00 51 28.91 | 1.09550 | 0.00080 | 1 | 23.72 | 0.83 | [OII]3727 |
| 37 | 02 25 59.22 | 00 51 50.72 | 0.56748 | 0.00012 | 1 | 19.86 | 0.69 | [OII]3727,CaII H,CaII K |
| 38 | 02 25 51.90 | 00 51 36.72 | 0.39817 | 0.00009 | 1 | 18.81 | 0.64 | [OII]3727,CaII H,CaII K,Hδ,Hβ |
| 39 | 02 25 50.75 | 00 52 26.76 | 0.42031 | 0.00017 | 1 | 19.84 | 0.85 | [OII]3727,CaII H,CaII K,G band |
| 40 | 02 25 53.79 | 00 51 57.49 | 0.56961 | 0.00014 | 1 | 20.67 | 1.02 | [OII]3727,CaII H,CaII K |
| 41 | 02 25 52.54 | 00 52 59.84 | 0.46596 | 0.00005 | 2 | 21.20 | 0.69 | [OII]3727,CaII K |
| 42 | 02 25 53.04 | 00 52 51.92 | 0.75386 | 0.00029 | 2 | 20.84 | 1.33 | [OII]3727,CaII H,CaII K |
| 43 | 02 25 54.32 | 00 52 16.68 | 0.39518 | 0.00013 | 1 | 18.50 | 0.54 | [OII]3727,CaII H,CaII K,Hγ,Hβ,[OIII]4959,[OIII]5007 |
| 44 | 02 25 54.08 | 00 52 32.38 | 0.39510 | 0.00010 | 1 | 19.81 | 0.76 | CaII H,CaII K |
| 45 | 02 25 54.54 | 00 53 38.54 | 0.39550 | 0.00047 | 2 | 20.75 | 0.50 | [OII]3727,CaII H,CaII K |
| 46 | 02 25 56.98 | 00 53 36.60 | 0.41939 | 0.00002 | 1 | 20.19 | 0.48 | Hβ,[OIII]5007 |
| 47 | 02 25 47.15 | 00 53 30.19 | 0.40621 | 0.00004 | 1 | 19.29 | 0.68 | [OII]3727,CaII H,Hβ,[OIII]4959,[OIII]5007 |
| 48 | 02 25 47.49 | 00 53 17.84 | 0.56936 | 0.00046 | 2 | 20.17 | 1.20 | CaII H,CaII K,G band |
Note. — Whenever information could not be obtained for a specific target, a symbol ’…’ is used. Stars found in our data have zero redshift.
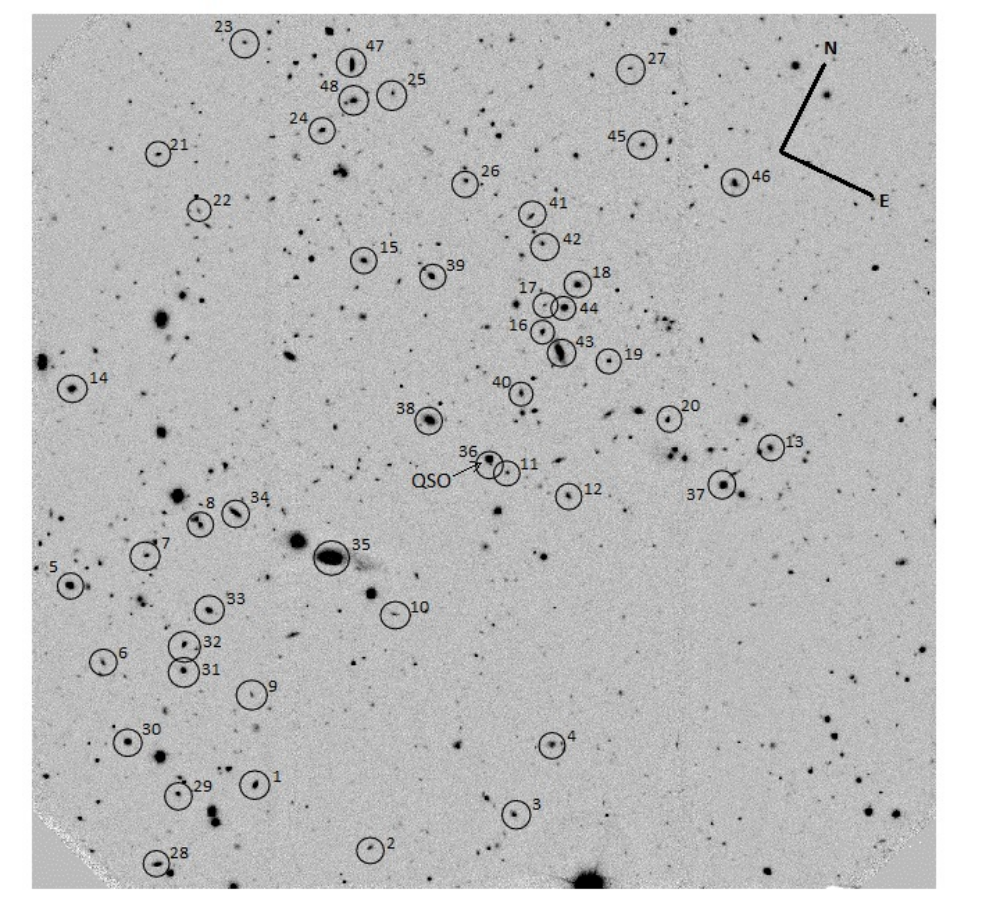
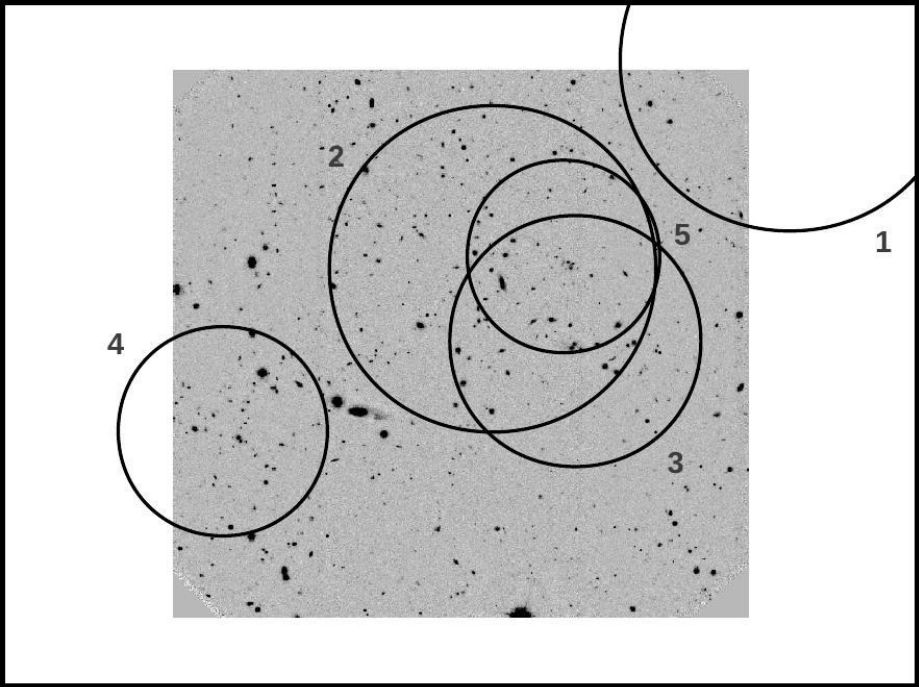
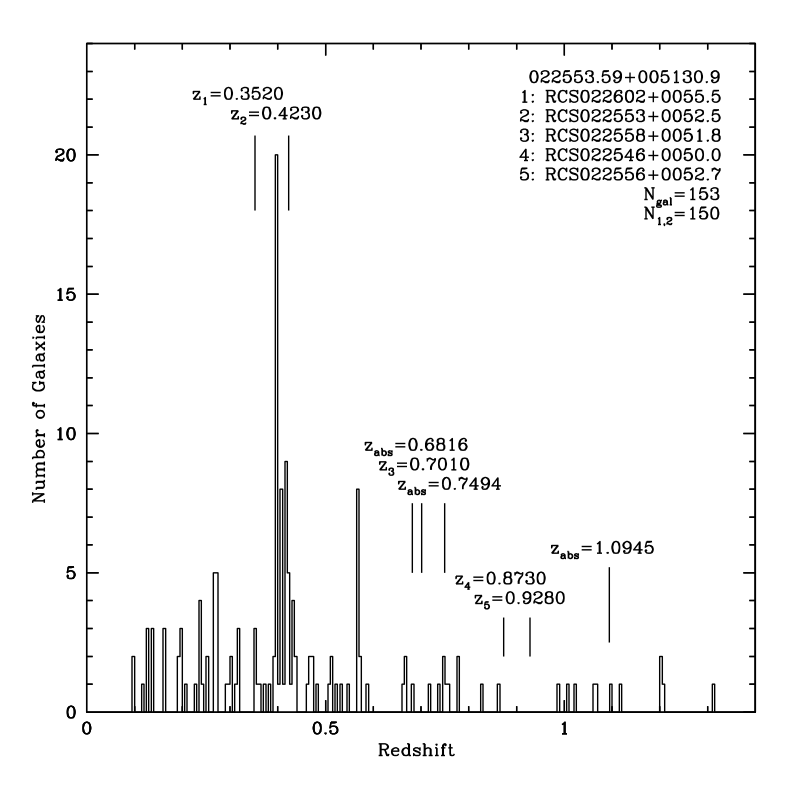
| No. | RA(J2000) | DEC(J2000) | FlagaaRedshift reliability classifier. | - | Comments | |||
|---|---|---|---|---|---|---|---|---|
| 1 | 02 28 34.14 | 00 43 00.59 | 0.68320 | 0.00020 | 2 | 21.41 | 0.49 | [OII]3727,CaII H,CaII K |
| 2 | 02 28 41.27 | 00 43 16.68 | 0.41586 | 0.00004 | 1 | 22.45 | 0.02 | [OII]3727,Hγ,Hβ,[OIII]4959,[OIII]5007 |
| 3 | 02 28 36.23 | 00 43 28.96 | 0.65169 | 0.00002 | 3 | 20.97 | 0.92 | [OII]3727,CaII H |
| 4 | 02 28 36.72 | 00 43 21.00 | 0.46362 | 0.00010 | 1 | 20.47 | 0.96 | CaII H,CaII K |
| 5 | 02 28 33.25 | 00 43 41.48 | 0 | 21.54 | 1.49 | |||
| 6 | 02 28 34.94 | 00 43 35.80 | 0.56726 | 0.00015 | 1 | 21.14 | 0.50 | [OII]3727,Hγ |
| 7 | 02 28 33.28 | 00 44 12.91 | 0.66299 | 0.00025 | 3 | 21.60 | 1.33 | CaII H,CaII K |
| 8 | 02 28 33.49 | 00 44 22.42 | 0.80617 | 0.00080 | 2 | 22.19 | 0.53 | [OII]3727 |
| 9 | 02 28 37.79 | 00 44 46.28 | 0.56164 | 0.00005 | 3 | 21.88 | 0.43 | [OII]3727,[OIII]5007 |
| 10 | 02 28 42.37 | 00 44 38.69 | 0.26592 | 0.00003 | 1 | 18.86 | 0.71 | CaII H,CaII K,G band |
| 11 | 02 28 31.84 | 00 44 36.49 | 0.32159 | 0.00008 | 1 | 19.09 | 0.68 | [OII]3727,CaII H,CaII K,G band,Hβ,[OIII]4959,[OIII]5007 |
| 12 | 02 28 36.29 | 00 45 31.03 | 0.13341 | 0.00005 | 1 | 21.76 | 0.27 | Hβ,[OIII]4959,[OIII]5007,Hα |
| 13 | 02 28 36.98 | 00 45 23.04 | 0.65660 | 0.00080 | 3 | 21.10 | 1.12 | Ca3933 |
| 14 | 02 28 36.90 | 00 45 43.34 | 0.67060 | 0.00080 | 3 | 22.52 | 0.20 | [OII]3727 |
| 15 | 02 28 37.60 | 00 45 12.49 | 0 | 21.40 | 0.85 | |||
| 16 | 02 28 37.08 | 00 46 02.39 | 0.65371 | 0.00017 | 1 | 20.88 | 0.77 | [OII]3727,CaII H,CaII K |
| 17 | 02 28 39.79 | 00 46 32.41 | 0.36409 | 0.00006 | 1 | 23.80 | -1.07 | [OII]3727,[OIII]4959,[OIII]5007 |
| 18 | 02 28 47.11 | 00 47 10.18 | 0.77262 | 0.00045 | 3 | 20.63 | 1.28 | CaII H,CaII K |
| 19 | 02 28 45.00 | 00 46 42.20 | 0.76862 | 0.00080 | 3 | 22.78 | 0.36 | [OII]3727 |
| 20 | 02 28 34.72 | 00 46 43.28 | 0.25626 | 0.00006 | 1 | 19.95 | 0.42 | [OII]3727,CaII K,Hβ,[OIII]4959,[OIII]5007 |
| 21 | 02 28 44.25 | 00 47 34.58 | 0.46480 | 0.00030 | 3 | 20.37 | 0.87 | CaII H,CaII K |
| 22 | 02 28 45.04 | 00 47 10.10 | 0.77258 | 0.00080 | 3 | 22.00 | 0.68 | [OII]3727 |
| 23 | 02 28 29.02 | 00 46 52.28 | 0 | 20.81 | 1.79 | |||
| 24 | 02 28 35.75 | 00 47 38.94 | 0.65156 | 0.00027 | 3 | 22.22 | 0.24 | [OII]3727,CaII H,CaII K |
| 25 | 02 28 43.61 | 00 47 59.21 | 0.30259 | 0.00003 | 1 | 20.40 | 0.42 | Hβ,[OIII]4959,[OIII]5007 |
| 26 | 02 28 36.26 | 00 48 08.75 | 0 | 21.68 | 0.74 | |||
| 27 | 02 28 46.67 | 00 48 33.19 | 0.91790 | 0.00080 | 3 | 21.31 | 0.95 | [OII]3727 |
| 28 | 02 28 39.72 | 00 43 32.74 | 0.26685 | 0.00008 | 1 | 20.40 | 0.44 | [OII]3727,CaII H,CaII K,Hβ |
| 29 | 02 28 44.84 | 00 44 03.26 | 0.30669 | 0.00007 | 1 | 18.71 | 0.66 | CaII H,CaII K,G band,Hγ |
| 30 | 02 28 49.61 | 00 44 00.96 | 0.21074 | 0.00015 | 1 | 19.32 | 0.39 | Hβ,[OIII]4959,[OIII]5007 |
| 31 | 02 28 48.07 | 00 43 42.17 | 0.12718 | 0.00005 | 1 | 20.78 | 0.22 | Hβ,[OIII]4959,[OIII]5007,Hα,[NII]6583,[SII]6716,[SII]6730 |
| 32 | 02 28 40.92 | 00 44 10.57 | 0.65726 | 0.00015 | 2 | 21.25 | 1.27 | CaII H,CaII K |
| 33 | 02 28 49.42 | 00 44 33.22 | 0.49164 | 0.00031 | 3 | 21.13 | 0.29 | HeII3781,[OIII]4959,[OIII]5007 |
| 34 | 02 28 37.46 | 00 44 30.26 | 0.25637 | 0.00006 | 1 | 19.95 | 0.32 | [OII]3727,Hδ,Hγ,Hβ,[OIII]4959,[OIII]5007 |
| 35 | 02 28 40.95 | 00 44 55.14 | 0.77796 | 0.00080 | 2 | 24.59 | -0.49 | [OII]3727 |
| 36 | 02 28 43.33 | 00 44 42.11 | 0.26799 | 0.00015 | 3 | 19.03 | 0.92 | CaII H,CaII K |
| 37 | 02 28 34.75 | 00 44 44.77 | 0.65924 | 0.00025 | 2 | 19.78 | 1.23 | [OII]3727,CaII H |
| 38 | 02 28 38.33 | 00 45 17.06 | 0.25622 | 0.00006 | 1 | 24.22 | 0.55 | [OII]3727,Hγ,Hβ,[OIII]4959,[OIII]5007 |
| 39 | 02 28 30.42 | 00 45 23.80 | 0.62621 | 0.00080 | 2 | 21.79 | 0.10 | [OII]3727 |
| 40 | 02 28 32.65 | 00 45 15.59 | 0.18719 | 0.00006 | 1 | 17.80 | 0.52 | [OII]3727,CaII H,CaII K,Hβ,[OIII]5007,[NII]6548,Hα,[NII]6583 |
| 41 | 02 28 30.57 | 00 46 43.18 | 0.65553 | 0.00055 | 1 | 20.26 | 1.02 | [OII]3727,CaII H,CaII K |
| 42 | 02 28 31.72 | 00 47 28.10 | 0.65552 | 0.00080 | 2 | 21.25 | 0.80 | [OII]3727 |
| 43 | 02 28 33.58 | 00 47 26.56 | 0.16356 | 0.00007 | 3 | 19.77 | 0.50 | [OIII]5007,Hα |
| 44 | 02 28 35.27 | 00 46 47.14 | 0.16276 | 0.00006 | 1 | 19.49 | 0.42 | [OII]3727,Hγ,Hβ,[OIII]4959,[OIII]5007 |
| 45 | 02 28 36.41 | 00 46 35.18 | 0.30340 | 0.00011 | 1 | 19.67 | 0.43 | [OII]3727,CaII H,CaII K,Hβ,[OIII]5007 |
| 46 | 02 28 39.08 | 00 46 27.91 | 0.15198 | 0.00008 | 1 | 18.14 | 0.62 | Hβ,[NII]6548,Hα,[NII]6583 |
| 47 | 02 28 39.72 | 00 46 17.94 | 0 | 19.62 | 0.43 | |||
| 48 | 02 28 43.85 | 00 47 45.67 | 0.46858 | 0.00019 | 1 | 19.19 | 0.90 | [OII]3727,CaII H,CaII K,G band |
| 49 | 02 28 46.64 | 00 48 07.16 | 0 | 21.16 | 1.38 | |||
| 50 | 02 28 39.84 | 00 48 09.32 | 0.25590 | 0.00028 | 3 | 19.79 | 0.38 | CaII K,G band |
Note. — Whenever information could not be obtained for a specific target, a symbol ’…’ is used. Stars found in our data have zero redshift.
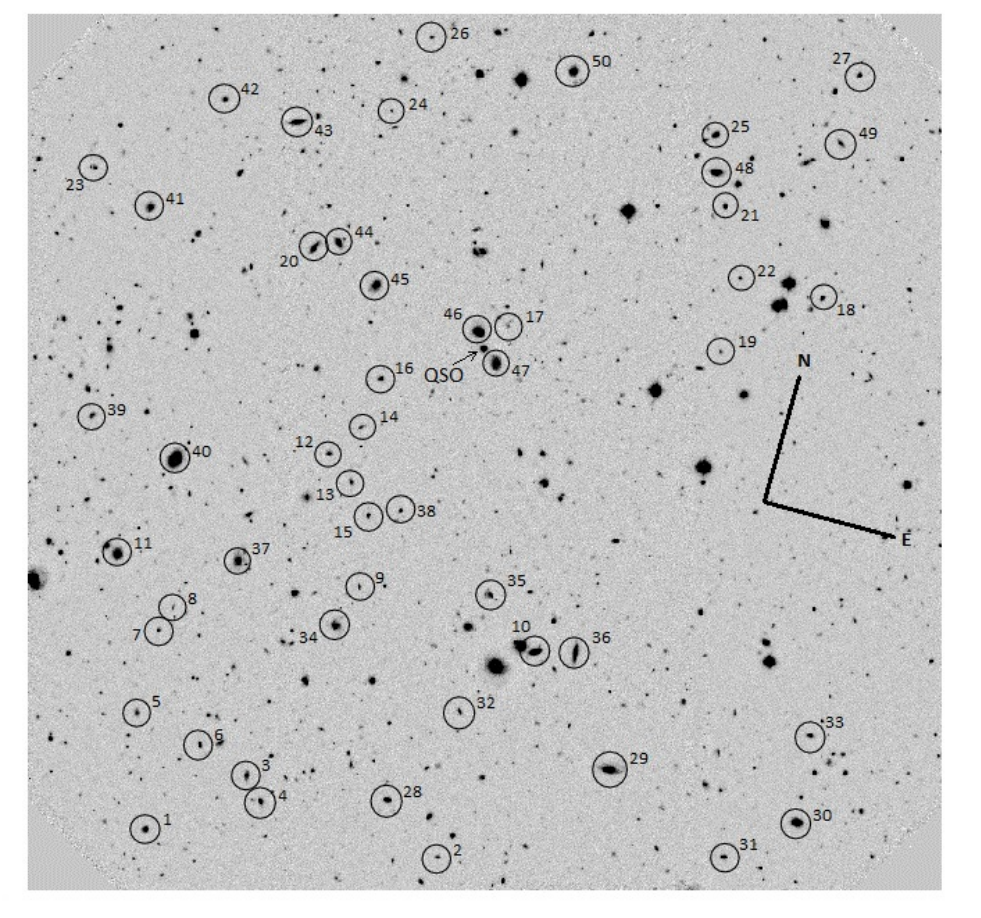
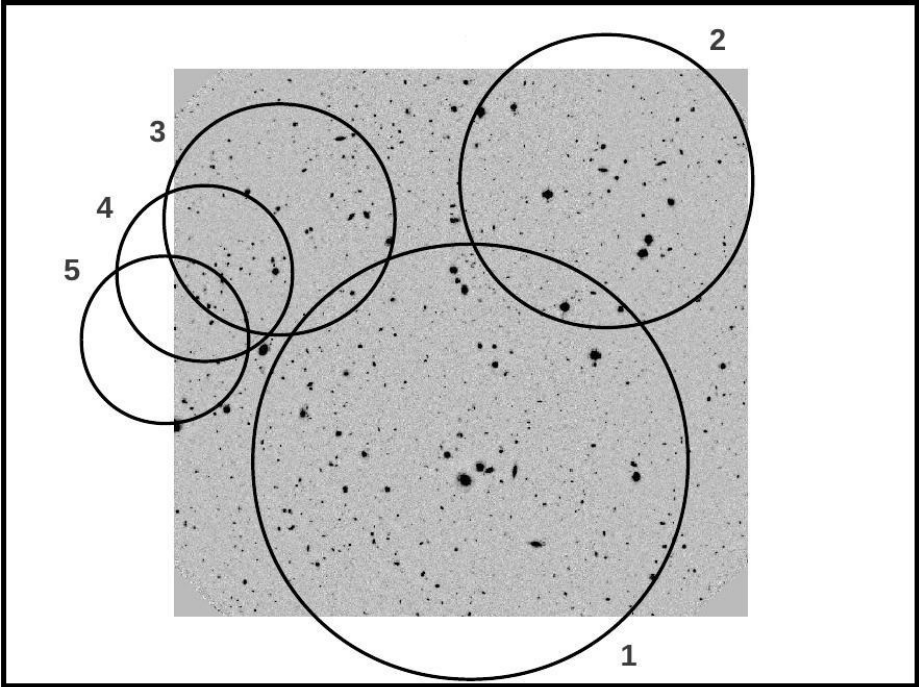
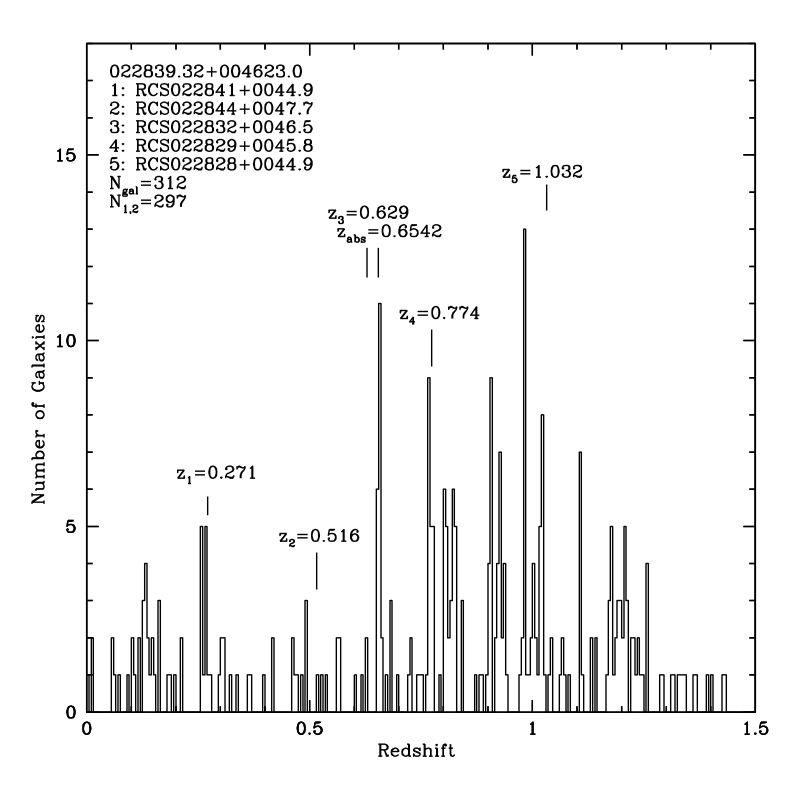
| No. | RA(J2000) | DEC(J2000) | FlagaaRedshift reliability classifier. | - | Comments | |||
|---|---|---|---|---|---|---|---|---|
| 1 | 21 52 19.30 | 27 30 19.29 | 2.59530 | 0.00474 | 3 | CIV 1550,CIII 1909 | ||
| 2 | 21 52 18.44 | 27 30 09.25 | 0.00000 | 0.00000 | 0 | |||
| 3 | 21 52 15.07 | 27 31 23.88 | 0.73932 | 0.00012 | 2 | [OII]3727,CaII K,G band | ||
| 4 | 21 52 15.74 | 27 31 19.20 | 0.73952 | 0.00040 | 2 | CaII H,CaII K,G band | ||
| 5 | 21 52 12.88 | 27 33 03.71 | 0.00000 | 0.00000 | 0 | |||
| 6 | 21 52 14.57 | 27 30 02.92 | 0.00000 | 0.00000 | 0 | |||
| 7 | 21 52 10.51 | 27 33 47.38 | 0 | |||||
| 8 | 21 52 09.02 | 27 32 40.88 | 0.49600 | 0.00006 | 2 | [OII]3727,CaII H,CaII K | ||
| 9 | 21 52 08.91 | 27 32 20.11 | 0.00000 | 0.00000 | 0 | |||
| 10 | 21 52 10.34 | 27 32 02.94 | 0.81198 | 0.00006 | 1 | [OII]3727,CaII H,CaII K | ||
| 11 | 21 52 04.90 | 27 32 19.93 | 0.59416 | 0.00021 | 1 | [OII]3727,Hγ | ||
| 12 | 21 52 08.23 | 27 31 58.62 | 0 | |||||
| 13 | 21 52 07.05 | 27 31 53.58 | 0 | |||||
| 14 | 21 52 06.33 | 27 31 25.36 | 0.60271 | 0.00006 | 2 | [OII]3727,CaII H,CaII K | ||
| 15 | 21 52 07.24 | 27 31 08.01 | 0.80307 | 0.00021 | 2 | [OII]3727,[OIII]5007 | ||
| 16 | 21 51 56.50 | 27 33 07.38 | 0.60998 | 0.00010 | 1 | [OII]3727,CaII H,CaII K,Hγ | ||
| 17 | 21 51 57.70 | 27 32 35.09 | 0.48246 | 0.00005 | 1 | [OII]3727,Hγ,Hβ,[OIII]5007 | ||
| 18 | 21 51 59.70 | 27 32 25.05 | 0.73870 | 0.00012 | 1 | [OII]3727,CaII H,CaII K | ||
| 19 | 21 52 01.74 | 27 32 06.72 | 0.60433 | 0.00015 | 1 | [OII]3727,CaII K,Hγ,Hβ | ||
| 20 | 21 52 05.17 | 27 30 59.90 | 0.46006 | 0.00010 | 1 | [OII]3727,Hβ,[OIII]4959,[OIII]5007 | ||
| 21 | 21 52 01.46 | 27 29 25.12 | 0.47426 | 0.00007 | 3 | Hβ,[OIII]5007 | ||
| 22 | 21 52 04.87 | 27 29 29.26 | 0.60338 | 0.00012 | 3 | Hβ,[OIII]4959,[OIII]5007 | ||
| 23 | 21 52 02.73 | 27 29 13.27 | 0 | |||||
| 24 | 21 51 55.45 | 27 33 04.18 | 0 | |||||
| 25 | 21 51 57.60 | 27 29 21.88 | 0.81260 | 0.00040 | 2 | [OII]3727,CaII H,CaII K | ||
| 26 | 21 52 18.32 | 27 31 27.19 | 0.65148 | 0.00012 | 1 | CaII H,CaII K,[OII]3727 | ||
| 27 | 21 52 19.74 | 27 30 32.79 | 0.80710 | 0.00078 | 3 | CaII H,CaII K | ||
| 28 | 21 52 18.36 | 27 30 19.18 | 0.53370 | 0.00014 | 3 | [OII]3727,CaII K | ||
| 29 | 21 52 14.48 | 27 33 12.13 | 0.27426 | 0.00009 | 1 | [OII]3727,CaII H,CaII K,Hβ,[OIII]5007 | ||
| 30 | 21 52 12.30 | 27 32 40.99 | 0 | |||||
| 31 | 21 52 15.07 | 27 31 23.88 | 0.73889 | 0.00012 | 2 | [OII]3727,CaII K,G band | ||
| 32 | 21 52 14.30 | 27 31 02.97 | 0.73953 | 0.00046 | 2 | [OII]3727,CaII H,CaII K | ||
| 33 | 21 52 10.31 | 27 33 37.44 | 0.35786 | 0.00006 | 1 | [OII]3727,Hβ,[OIII]5007 | ||
| 34 | 21 52 07.91 | 27 33 42.95 | 0.27272 | 0.00010 | 1 | [OII]3727,CaII H,CaII K,Hβ | ||
| 35 | 21 52 03.40 | 27 32 47.87 | 0.32849 | 0.00004 | 1 | [OII]3727,Hγ,Hβ,[OIII]4959,[OIII]5007 | ||
| 36 | 21 52 04.66 | 27 32 28.68 | 0.47360 | 0.00007 | 3 | CaII H,CaII K | ||
| 37 | 21 52 10.22 | 27 32 10.14 | 0.19677 | 0.00006 | 1 | Hβ,[OIII]4959,[OIII]5007 | ||
| 38 | 21 52 08.18 | 27 31 53.62 | 0.60045 | 0.00023 | 1 | [OII]3727,CaII K,G band | ||
| 39 | 21 52 07.25 | 27 31 35.79 | 0.27610 | 0.00035 | 3 | CaII H,CaII K | ||
| 40 | 21 52 06.81 | 27 31 25.47 | 0.40924 | 0.00012 | 1 | [OII]3727,CaII H,CaII K | ||
| 41 | 21 52 06.70 | 27 30 51.48 | 0.59591 | 0.00022 | 1 | [OII]3727,CaII H,CaII K,G band,Hγ | ||
| 42 | 21 52 05.17 | 27 29 36.45 | 0.29960 | 0.00007 | 2 | Hβ,[OIII]5007 | ||
| 43 | 21 51 57.49 | 27 33 30.46 | 0.40688 | 0.00009 | 1 | [OII]3727,CaII H,Hγ,Hβ,[OIII]5007 | ||
| 44 | 21 51 59.52 | 27 33 20.49 | 2.55150 | 0.00757 | 3 | CIV 1550,CIII 1909 | ||
| 45 | 21 52 01.28 | 27 32 41.57 | 0.27412 | 0.00012 | 1 | CaII H,CaII K,G band | ||
| 46 | 21 51 56.86 | 27 32 29.94 | 0.49543 | 0.00017 | 3 | [OII]3727,CaII H,CaII K | ||
| 47 | 21 51 56.46 | 27 31 59.85 | 0.27373 | 0.00012 | 1 | [OII]3727,Hβ,[OIII]5007 | ||
| 48 | 21 51 55.71 | 27 31 54.91 | 0.38975 | 0.00010 | 1 | [OII]3727,Hγ,Hβ,[OIII]5007 | ||
| 49 | 21 52 01.98 | 27 29 16.12 | 0.54816 | 0.00005 | 1 | [OII]3727,Hγ,Hβ,[OIII]4959 |
Note. — Whenever information could not be obtained for a specific target, a symbol ’…’ is used. Stars found in our data have zero redshift.
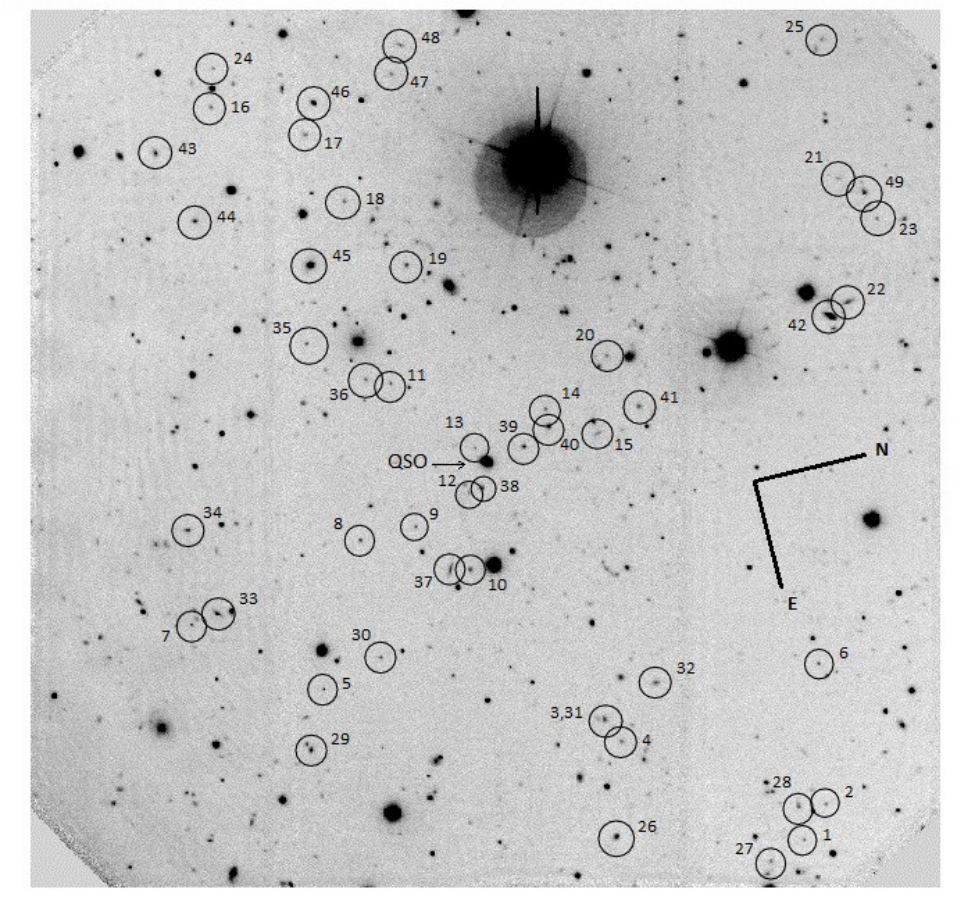
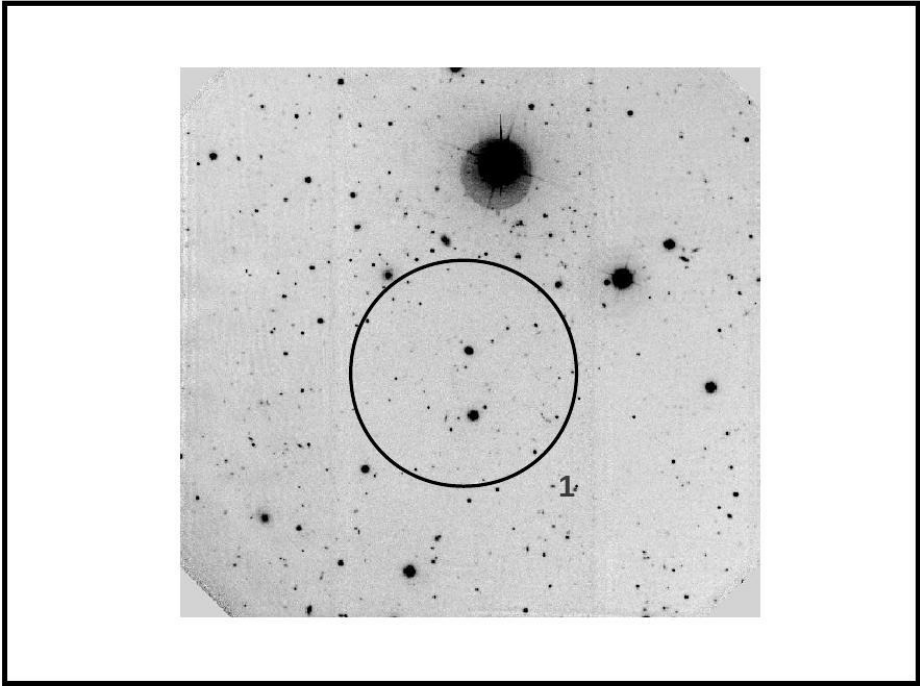
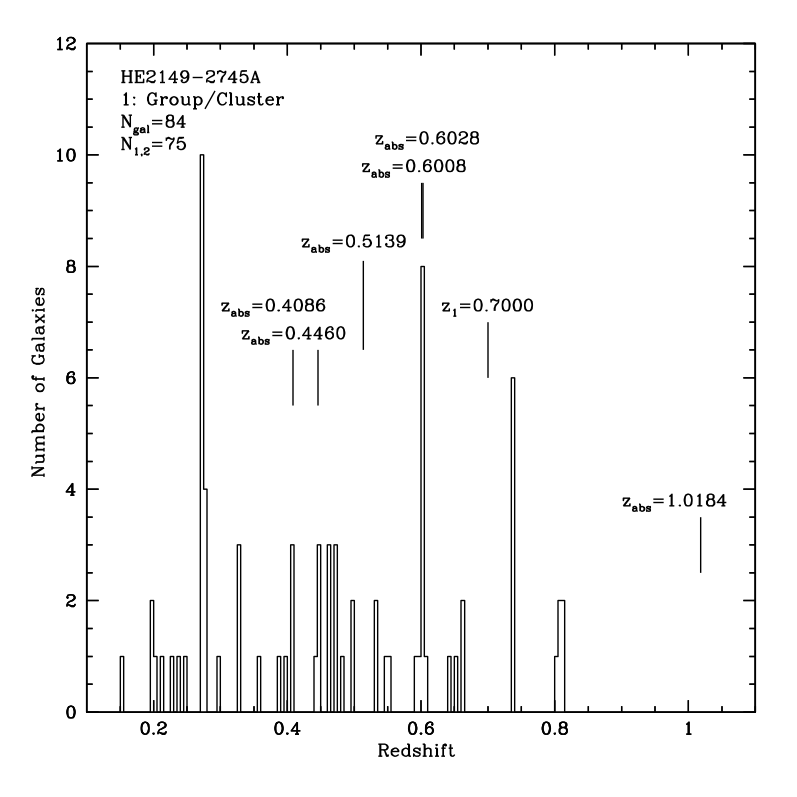
| No. | RA(J2000) | DEC(J2000) | FlagaaRedshift reliability classifier. | - | Comments | |||
|---|---|---|---|---|---|---|---|---|
| 1 | 23 15 05.95 | 00 16 06.92 | 0 | 20.94 | 1.48 | |||
| 2 | 23 15 00.86 | 00 15 58.32 | 0.22311 | 0.00006 | 1 | 21.98 | 0.11 | Hβ,[OIII]4959,[OIII]5007 |
| 3 | 23 15 01.58 | 00 16 46.02 | 0.99420 | 0.00080 | 3 | 22.16 | 0.83 | [OII]3727 |
| 4 | 23 14 59.20 | 00 16 18.37 | 0 | 21.02 | 1.65 | |||
| 5 | 23 14 56.03 | 00 16 58.80 | 0.58952 | 0.00007 | 3 | 21.06 | 0.52 | [OII]3727,CaII H |
| 6 | 23 14 55.68 | 00 16 54.52 | 0.74977 | 0.00080 | 2 | 22.33 | 0.81 | [OII]3727 |
| 7 | 23 14 53.88 | 00 17 24.40 | 0.74160 | 0.00007 | 3 | 20.96 | 0.67 | [OII]3727,CaII K |
| 8 | 23 15 01.89 | 00 16 55.20 | 0.59264 | 0.00017 | 1 | 21.16 | 0.70 | [OII]3727,CaII H,CaII K |
| 9 | 23 15 01.63 | 00 17 09.53 | 0.74944 | 0.00012 | 1 | 21.73 | 1.16 | [OII]3727,CaII H,CaII K |
| 10 | 23 15 03.43 | 00 17 17.74 | 0.50683 | 0.00012 | 2 | 21.08 | 0.84 | CaII H,CaII K,G band |
| 11 | 23 15 05.64 | 00 18 53.28 | 0.50470 | 0.00025 | 1 | 20.75 | 0.94 | [OII]3727,CaII H,CaII K,G band |
| 12 | 23 15 04.06 | 00 18 56.59 | 0.31196 | 0.00005 | 1 | 21.10 | 0.22 | [OII]3727,Hβ,[OIII]4959,[OIII]5007 |
| 13 | 23 15 00.92 | 00 18 14.98 | 0.29255 | 0.00005 | 1 | 20.99 | 0.45 | [OII]3727,Hβ,[OIII]4959,[OIII]5007 |
| 14 | 23 15 00.96 | 00 18 24.52 | 0.41367 | 0.00003 | 1 | 22.47 | -0.03 | [OII]3727,[OIII]4959,[OIII]5007 |
| 15 | 23 15 00.21 | 00 18 08.06 | 0.41360 | 0.00004 | 1 | 20.23 | 0.39 | [OII]3727,Hδ,Hγ,Hβ,[OIII]4959,[OIII]5007 |
| 16 | 23 15 01.29 | 00 18 49.86 | 0.58493 | 0.00080 | 3 | 20.65 | 1.16 | [OII]3727 |
| 17 | 23 15 00.62 | 00 18 43.42 | 0.50576 | 0.00080 | 1 | 22.07 | 0.42 | [OII]3727 |
| 18 | 23 15 00.31 | 00 18 38.92 | 0.49888 | 0.00042 | 2 | 21.27 | 0.07 | [OII]3727,CaII H |
| 19 | 23 15 00.90 | 00 19 06.82 | 0.57703 | 0.00007 | 3 | 22.02 | 0.55 | [OII]3727,CaII K |
| 20 | 23 14 56.02 | 00 18 20.38 | 0 | 22.37 | 0.74 | |||
| 21 | 23 15 06.88 | 00 19 24.53 | 0.68810 | 0.00014 | 2 | 21.52 | 0.72 | [OII]3727,CaII K |
| 22 | 23 15 06.73 | 00 19 33.85 | 0.68793 | 0.00028 | 2 | 20.05 | 1.33 | CaII H,CaII K |
| 23 | 23 15 03.98 | 00 19 25.72 | 0.59259 | 0.00029 | 2 | 20.58 | 0.94 | [OII]3727,CaII H,CaII K |
| 24 | 23 15 03.17 | 00 19 44.40 | 0.50138 | 0.00080 | 3 | 22.00 | 0.57 | [OII]3727 |
| 25 | 23 15 01.42 | 00 19 33.10 | 0 | 20.17 | 1.63 | |||
| 26 | 23 15 03.15 | 00 20 12.73 | 0.22222 | 0.00012 | 1 | 20.13 | 0.70 | Hβ,[OIII]4959,[OIII]5007 |
| 27 | 23 15 02.82 | 00 20 22.13 | 0.69295 | 0.00029 | 1 | 21.72 | 0.60 | [OII]3727,CaII H,CaII K |
| 28 | 23 15 05.81 | 00 20 17.59 | 0.59108 | 0.00021 | 2 | 20.13 | 0.84 | [OII]3727,CaII K |
| 29 | 23 15 09.82 | 00 20 10.07 | 0.58384 | 0.00007 | 1 | 20.19 | 1.17 | CaII H,CaII K |
| 30 | 23 14 56.27 | 00 16 22.91 | 0.37639 | 0.00012 | 1 | 21.34 | 0.46 | [OII]3727,Hβ,[OIII]5007 |
| 31 | 23 14 55.54 | 00 16 55.56 | 0 | 22.33 | 0.81 | |||
| 32 | 23 14 55.19 | 00 16 49.98 | 0.38087 | 0.00007 | 2 | 21.06 | 0.54 | [OII]3727,Hβ |
| 33 | 23 14 53.03 | 00 16 55.34 | 0 | 20.29 | 1.70 | |||
| 34 | 23 15 03.22 | 00 17 04.52 | 0.91013 | 0.00080 | 1 | 21.74 | 0.66 | [OII]3727 |
| 35 | 23 15 01.68 | 00 16 29.32 | 0.77120 | 0.00080 | 3 | 22.52 | 0.76 | [OII]3727 |
| 36 | 23 15 01.89 | 00 16 55.20 | 0.59352 | 0.00021 | 1 | 21.16 | 0.70 | [OII]3727,CaII K |
| 37 | 23 14 58.80 | 00 17 07.40 | 0.50386 | 0.00012 | 2 | 19.50 | 1.03 | [OII]3727,CaII K,G band |
| 38 | 23 14 52.06 | 00 18 12.74 | 0.69403 | 0.00080 | 3 | 22.24 | 0.85 | [OII]3727 |
| 39 | 23 14 50.80 | 00 18 40.97 | 0.50149 | 0.00014 | 1 | 19.43 | 0.96 | CaII H,CaII K |
| 40 | 23 15 03.39 | 00 17 24.00 | 0.50529 | 0.00007 | 1 | 23.12 | 0.05 | CaII H,CaII K |
| 41 | 23 15 02.99 | 00 17 37.07 | 0.50416 | 0.00007 | 2 | 21.15 | 0.47 | [OII]3727,CaII K |
| 42 | 23 15 04.39 | 00 18 49.82 | 0 | 21.94 | 0.70 | |||
| 43 | 23 15 02.88 | 00 18 25.85 | 0.50343 | 0.00080 | 3 | 21.11 | 0.77 | [OII]3727 |
| 44 | 23 15 02.31 | 00 18 41.51 | 0.50527 | 0.00007 | 1 | 20.21 | 0.87 | CaII K,G band |
| 45 | 23 15 00.69 | 00 18 16.78 | 0 | 20.32 | 1.71 | |||
| 46 | 23 15 01.53 | 00 19 18.66 | 0.50250 | 0.00035 | 3 | 20.82 | 0.80 | CaII H,CaII K,Hδ,G band |
| 47 | 23 14 59.97 | 00 18 09.72 | 0.50278 | 0.00080 | 1 | 20.15 | 0.88 | [OII]3727 |
| 48 | 23 14 59.14 | 00 19 19.49 | 0.57724 | 0.00080 | 3 | 20.76 | 0.46 | [OII]3727 |
| 49 | 23 14 57.46 | 00 18 53.93 | 0.50294 | 0.00006 | 1 | 19.61 | 0.93 | CaII H,CaII K,G band |
| 50 | 23 15 09.36 | 00 19 09.23 | 0 | 20.63 | 1.16 | |||
| 51 | 23 15 04.99 | 00 19 26.80 | 0.43890 | 0.00012 | 1 | 21.88 | 0.68 | [OII]3727,Hβ,[OIII]5007 |
| 52 | 23 15 02.17 | 00 19 33.46 | 0.59303 | 0.00007 | 1 | 19.87 | 1.19 | CaII H,CaII K |
| 53 | 23 15 11.60 | 00 19 29.17 | 0.47277 | 0.00042 | 1 | 19.45 | 0.89 | CaII H,CaII K |
| 54 | 23 15 02.67 | 00 20 15.86 | 0.57669 | 0.00021 | 2 | 20.71 | 0.86 | CaII H,CaII K |
| 55 | 23 15 11.01 | 00 20 02.76 | 0.58508 | 0.00007 | 1 | 20.19 | 1.05 | CaII H,CaII K |
Note. — Whenever information could not be obtained for a specific target, a symbol ’…’ is used. Stars found in our data have zero redshift.
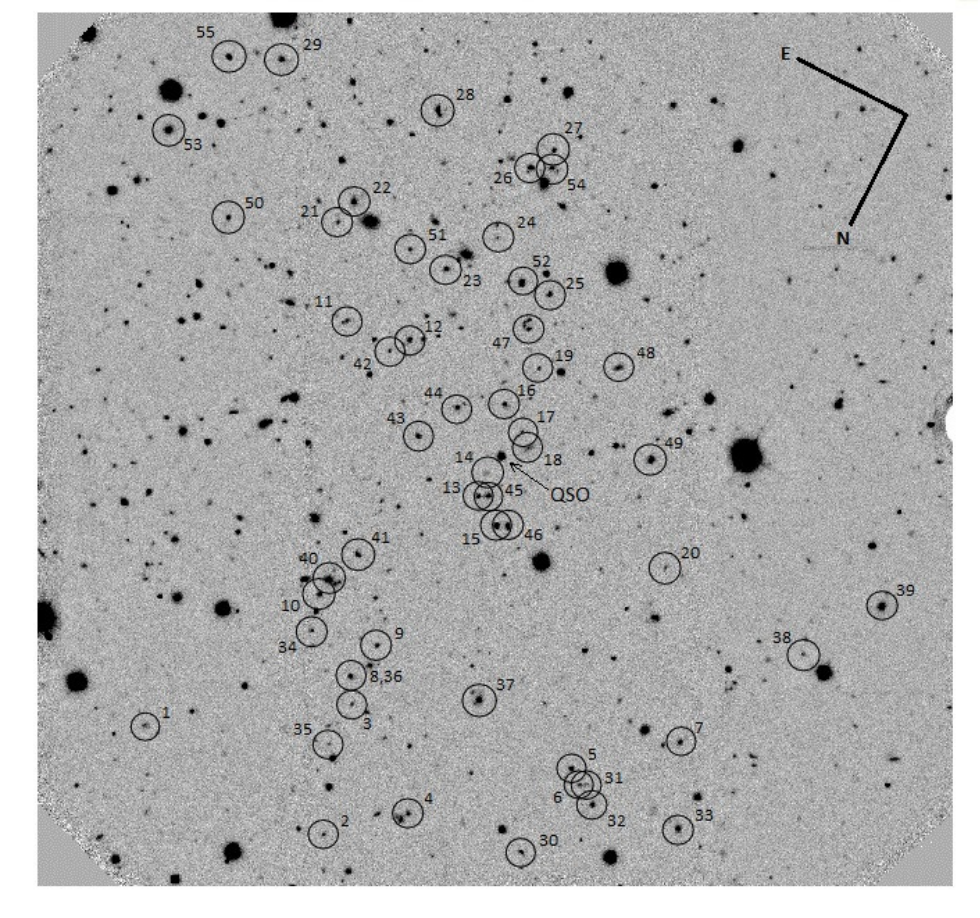
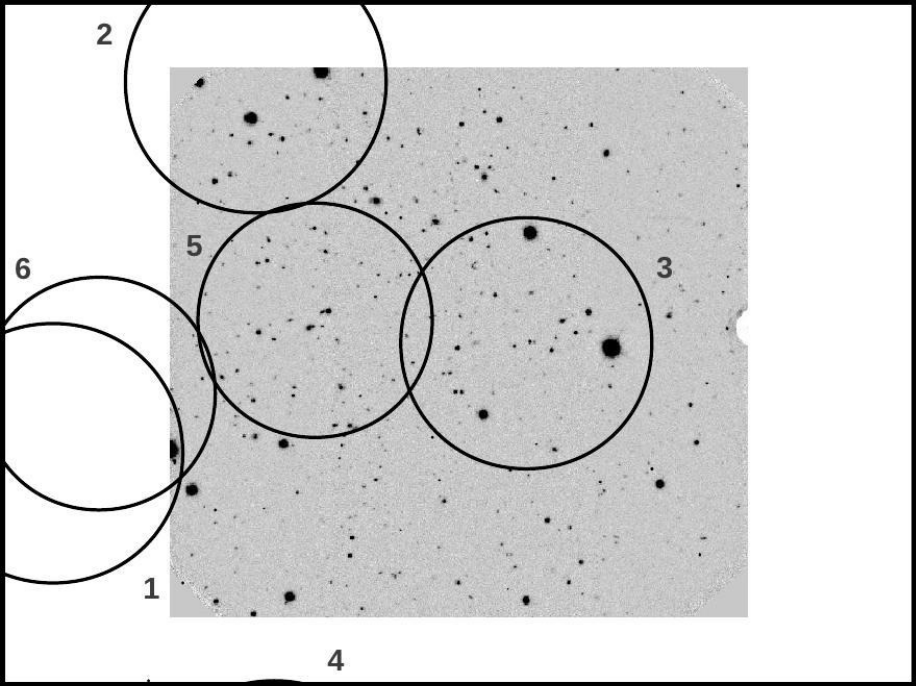
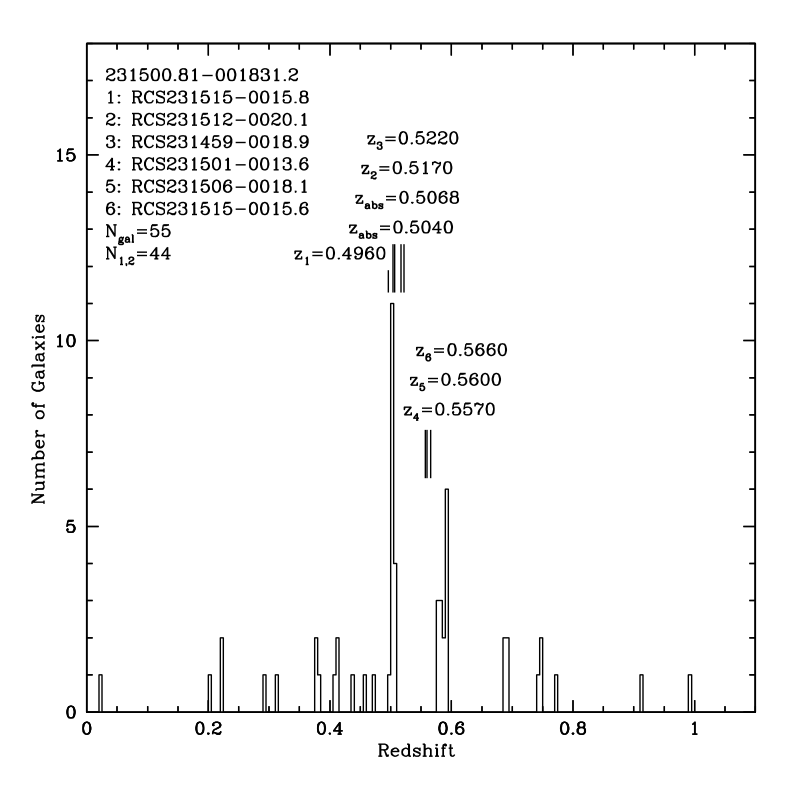
| No. | RA(J2000) | DEC(J2000) | FlagaaRedshift reliability classifier. | - | Comments | |||
|---|---|---|---|---|---|---|---|---|
| 1 | 23 15 09.52 | 00 08 32.89 | 0 | 20.97 | 0.30 | |||
| 2 | 23 15 10.24 | 00 08 22.74 | 0.20110 | 0.00003 | 1 | 21.59 | 0.21 | Hβ,[OIII]4959,[OIII]5007 |
| 3 | 23 15 19.93 | 00 09 54.97 | 0.38483 | 0.00015 | 3 | 21.54 | 0.58 | Hβ,[OIII]5007 |
| 4 | 23 15 03.91 | 00 08 42.72 | 0.37344 | 0.00005 | 2 | 21.59 | 0.42 | [OII]3727,Hβ |
| 5 | 23 15 07.31 | 00 09 40.68 | 0.47830 | 0.00001 | 1 | 19.89 | 0.69 | [OII]3727,CaII H,CaII K |
| 6 | 23 15 08.39 | 00 10 06.96 | 0.49733 | 0.00015 | 2 | 22.23 | 0.41 | [OII]3727,[OIII]5007 |
| 7 | 23 15 10.24 | 00 09 24.91 | 0.29651 | 0.00009 | 1 | 20.76 | 0.36 | [OII]3727,Hβ,[OIII]4959,[OIII]5007 |
| 8 | 23 15 13.93 | 00 10 25.36 | 0.37115 | 0.00005 | 1 | 22.17 | 0.08 | [OII]3727,Hβ,[OIII]4959,[OIII]5007 |
| 9 | 23 15 19.53 | 00 10 12.18 | 0 | 21.18 | 0.64 | |||
| 10 | 23 15 17.87 | 00 10 15.13 | 0 | 21.75 | 0.27 | |||
| 11 | 23 15 05.30 | 00 10 48.86 | 0.43027 | 0.00007 | 1 | 22.08 | -0.05 | [OII]3727,[OIII]5007,Hβ,[OIII]4959 |
| 12 | 23 15 07.22 | 00 10 54.62 | 0.41790 | 0.00005 | 2 | 20.65 | 1.39 | Hβ,[OIII]4959 |
| 13 | 23 15 07.88 | 00 10 53.36 | 0.37240 | 0.00023 | 2 | 20.79 | 0.63 | CaII H,CaII K,Hγ |
| 14 | 23 15 08.50 | 00 10 40.76 | 0.59149 | 0.00080 | 3 | 22.85 | -0.13 | [OII]3727 |
| 15 | 23 15 08.47 | 00 10 47.06 | 0 | 21.71 | 1.05 | |||
| 16 | 23 15 13.16 | 00 10 55.34 | 0.79466 | 0.00080 | 3 | 21.92 | 0.33 | [OII]3727 |
| 17 | 23 15 07.26 | 00 11 36.96 | 0.37010 | 0.00005 | 3 | 20.05 | 0.50 | Hβ,[OIII]5007 |
| 17 | 23 15 07.26 | 00 11 36.96 | 0.72158 | 0.00080 | 3 | 21.39 | 0.39 | [OII]3727 |
| 18 | 23 15 08.77 | 00 11 39.70 | 0.75464 | 0.00080 | 3 | 21.64 | 1.44 | [OII]3727 |
| 19 | 23 15 09.24 | 00 12 24.52 | 0 | 21.40 | 1.12 | |||
| 20 | 23 15 11.83 | 00 12 33.26 | 0.43011 | 0.00001 | 1 | 19.30 | 0.80 | CaII H,CaII K,G band |
| 21 | 23 15 11.36 | 00 12 49.18 | 0.37113 | 0.00006 | 1 | 20.51 | 0.26 | Hβ,[OIII]4959,[OIII]5007,Hγ |
| 22 | 23 15 06.56 | 00 12 41.69 | 0.40355 | 0.00012 | 2 | 22.60 | 0.26 | [OII]3727,OIII4363,Hβ,[OIII]5007 |
| 23 | 23 15 12.16 | 00 13 19.02 | 0 | 21.83 | 0.50 | |||
| 24 | 23 15 09.92 | 00 08 08.38 | 0.42953 | 0.00075 | 3 | 24.19 | 0.10 | Hβ,[OIII]5007 |
| 25 | 23 15 10.57 | 00 08 26.02 | 0.20009 | 0.00003 | 1 | 22.67 | 0.25 | [OII]3727,Hβ,[OIII]4959,[OIII]5007 |
| 26 | 23 15 04.04 | 00 08 17.81 | 0.41585 | 0.00012 | 2 | 19.87 | 0.78 | [OII]3727,CaII H,CaII K |
| 27 | 23 15 09.61 | 00 08 49.52 | 0.37335 | 0.00011 | 1 | 18.81 | 0.87 | CaII H,CaII K,G band,MgI 5176 |
| 28 | 23 15 10.01 | 00 09 20.81 | 0 | 21.86 | 0.34 | |||
| 29 | 23 15 10.04 | 00 09 57.64 | 0.36937 | 0.00011 | 1 | 21.39 | 0.48 | [OII]3727,CaII K,G band,Hβ,[OIII]5007 |
| 30 | 23 15 10.88 | 00 09 39.02 | 0.31363 | 0.00006 | 1 | 20.25 | 0.70 | Hβ,[OIII]4959,[OIII]5007,[OII]3727,Hγ |
| 31 | 23 15 10.21 | 00 10 12.43 | 0.84680 | 0.00080 | 3 | 20.09 | 1.56 | [OII]3727 |
| 32 | 23 15 09.95 | 00 10 32.27 | 0.44652 | 0.00008 | 1 | 21.69 | 0.01 | [OIII]5007,[OIII]4959,Hβ,Hγ,Hδ,[OII]3727 |
| 33 | 23 15 10.78 | 00 10 30.00 | 0 | 21.23 | 0.84 | |||
| 34 | 23 15 12.18 | 00 10 05.38 | 0.49620 | 0.00012 | 1 | 22.38 | -0.22 | CaII H,CaII K,Hδ,Hγ |
| 35 | 23 15 16.39 | 00 09 26.57 | 0.63448 | 0.00010 | 1 | 20.97 | 0.37 | [OII]3727,[OIII]5007,[OIII]4959 |
| 36 | 23 15 04.75 | 00 10 14.16 | 0.47947 | 0.00008 | 1 | 19.69 | 0.64 | [OII]3727,CaII H,CaII K,G band |
| 37 | 23 15 06.72 | 00 10 22.01 | 0.26136 | 0.00006 | 1 | 19.50 | 0.54 | Hα,[OIII]5007,Hβ,Hγ,[OII]3727 |
| 38 | 23 15 07.05 | 00 10 49.58 | 0.37117 | 0.00012 | 2 | 21.13 | 0.60 | CaII H,CaII K,G band |
| 39 | 23 15 05.09 | 00 10 54.05 | 0.47045 | 0.00017 | 1 | 20.54 | 0.53 | CaII H,CaII K,[OII]3727,Hβ,[OIII]5007 |
| 40 | 23 15 08.10 | 00 11 48.26 | 0.37283 | 0.00013 | 1 | 19.56 | 0.71 | CaII H,CaII K,G band |
| 41 | 23 15 08.35 | 00 12 01.80 | 0.43074 | 0.00001 | 1 | 19.52 | 0.55 | CaII H,CaII K |
| 42 | 23 15 09.54 | 00 11 42.65 | 0.37023 | 0.00006 | 1 | 21.50 | 0.60 | [OII]3727,Hβ,FeII 5284 |
| 43 | 23 15 09.91 | 00 11 54.06 | 0.37290 | 0.00050 | 3 | 20.85 | 0.60 | CaII H,CaII K |
| 44 | 23 15 08.90 | 00 12 28.15 | 0.42986 | 0.00025 | 2 | 19.62 | 0.82 | CaII H,CaII K |
| 45 | 23 15 13.50 | 00 12 54.32 | 0.79003 | 0.00089 | 2 | 19.72 | 0.63 | [OII]3727,CaII H,CaII K |
| 46 | 23 15 06.37 | 00 12 38.45 | 0.54693 | 0.00031 | 2 | 22.01 | 0.33 | [OII]3727,[OIII]4959,Hβ,[OIII]5007 |
| 47 | 23 15 07.53 | 00 12 38.30 | 0.43340 | 0.00012 | 2 | 19.29 | 0.74 | CaII H,CaII K,G band |
| 48 | 23 15 06.89 | 00 12 55.58 | 0 | 20.30 | 1.24 |
Note. — Whenever information could not be obtained for a specific target, a symbol ’…’ is used. Stars found in our data have zero redshift.
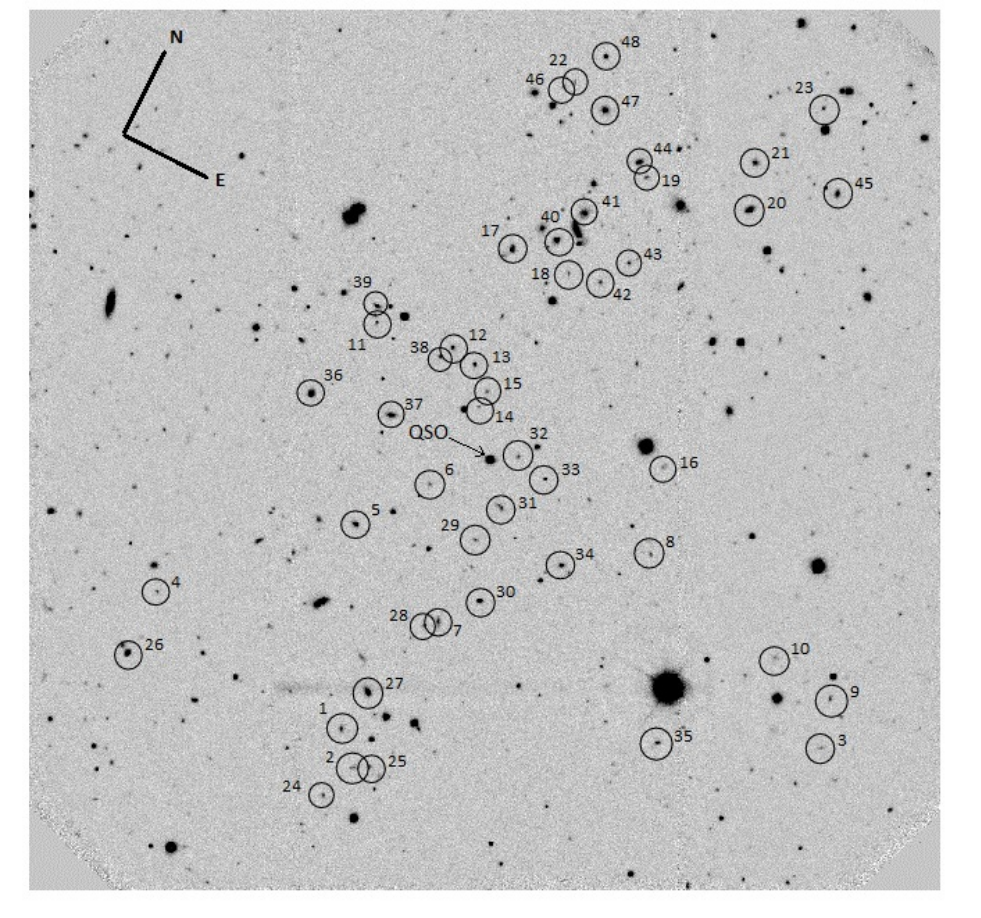
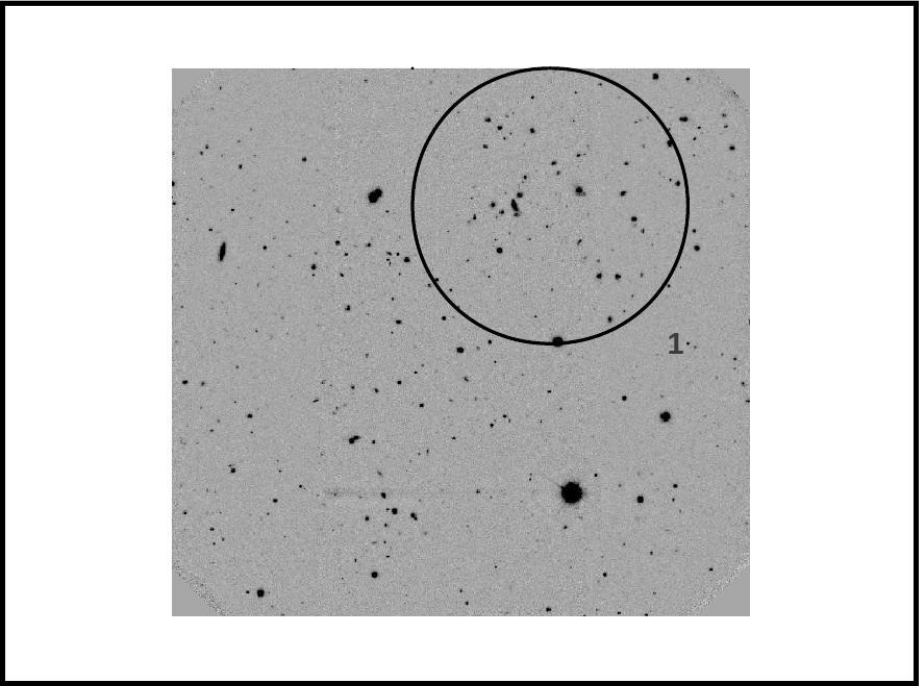
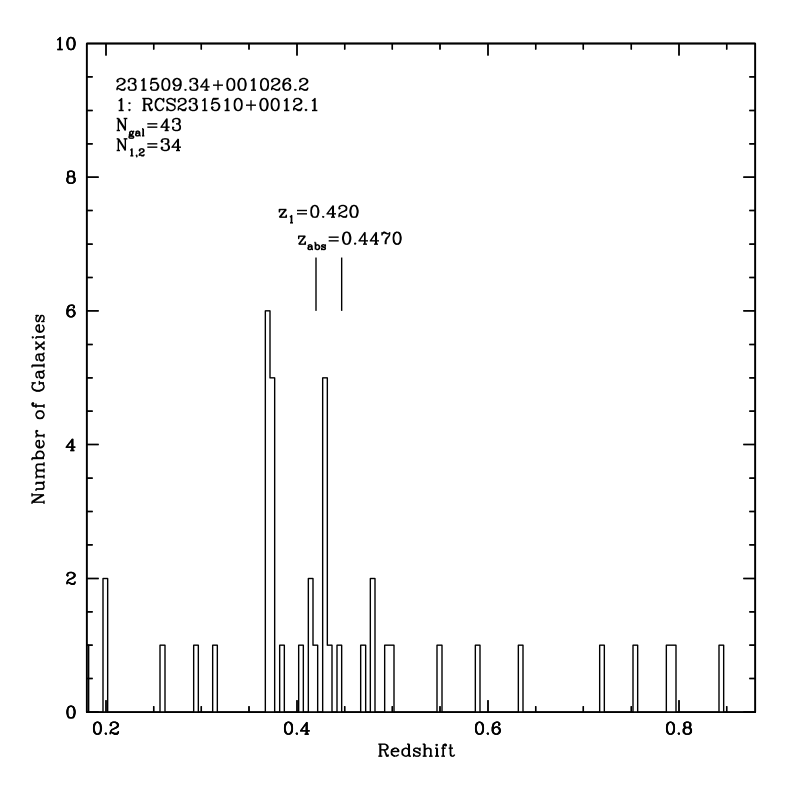
| No. | RA(J2000) | DEC(J2000) | FlagaaRedshift reliability classifier. | - | Comments | |||
|---|---|---|---|---|---|---|---|---|
| 1 | 23 18 06.15 | 00 05 27.64 | 0.69533 | 0.00029 | 1 | 22.40 | 0.24 | [OII]3727,CaII H,CaII K |
| 2 | 23 17 50.90 | 00 05 16.98 | 0.70286 | 0.00009 | 1 | 21.43 | 0.30 | [OII]3727,[NeIII]3868,HeI 3888,Hδ,Hγ |
| 3 | 23 17 59.34 | 00 05 43.69 | 0.46756 | 0.00010 | 1 | 22.49 | 0.29 | [OII]3727,Hβ,[OIII]4959,[OIII]5007 |
| 4 | 23 17 57.61 | 00 06 04.93 | 0.46890 | 0.00006 | 2 | 21.52 | 0.95 | [OII]3727,CaII H,CaII K |
| 5 | 23 17 57.33 | 00 05 54.60 | 0.31495 | 0.00005 | 1 | 21.82 | 0.35 | [OII]3727,Hβ,[OIII]4959,[OIII]5007 |
| 6 | 23 18 02.59 | 00 07 39.32 | 1.41520 | 0.00028 | 1 | 22.50 | 0.30 | FeII 2344,FeII 2374,FeII 2382,FeII 2586,FeII 2600,MnII 2594,MgII 2796,MgII 2803 |
| 7 | 23 18 01.39 | 00 06 30.17 | 0.50117 | 0.00023 | 2 | 21.36 | 0.69 | [OII]3727,CaII H,CaII K |
| 8 | 23 18 01.20 | 00 07 13.08 | 0.59330 | 0.00007 | 1 | 22.46 | 0.30 | [OII]3727,Hγ |
| 9 | 23 18 01.04 | 00 07 22.08 | 0 | 22.33 | 1.57 | |||
| 10 | 23 18 00.65 | 00 06 49.72 | 0 | 22.65 | 0.58 | |||
| 11 | 23 18 00.65 | 00 06 59.22 | 0.59770 | 0.00030 | 3 | 23.07 | 0.38 | [OII]3727,CaII H,CaII K,G band |
| 12 | 23 18 00.17 | 00 06 42.16 | 0 | 22.23 | 1.98 | |||
| 13 | 23 17 56.81 | 00 07 28.60 | 0 | 22.42 | 0.94 | |||
| 14 | 23 18 02.34 | 00 08 05.60 | 0.47300 | 0.00012 | 1 | 21.57 | 0.35 | [OII]3727,CaII H,CaII K,Hγ,Hβ,[OIII]5007 |
| 15 | 23 18 02.26 | 00 07 52.10 | 0 | 21.72 | 2.00 | |||
| 16 | 23 17 56.41 | 00 08 45.13 | 0 | 21.99 | 1.64 | |||
| 17 | 23 17 52.75 | 00 08 58.88 | 0.38222 | 0.00006 | 1 | 22.36 | 0.25 | Hβ,[OIII]4959,[OIII]5007 |
| 18 | 23 17 52.97 | 00 08 30.59 | 0.56368 | 0.00035 | 2 | 20.97 | 0.39 | [OII]3727,CaII H,CaII K |
| 19 | 23 17 53.25 | 00 08 24.04 | 0.59975 | 0.00012 | 1 | 19.72 | 1.20 | CaII H,CaII K,G band |
| 20 | 23 17 52.53 | 00 09 10.48 | 0 | 21.89 | 1.03 | |||
| 21 | 23 18 04.23 | 00 09 27.40 | 0 | 21.96 | 3.25 | |||
| 22 | 23 17 54.16 | 00 09 35.50 | 0.66210 | 0.00049 | 3 | 22.53 | 1.25 | [OII]3727,CaII K |
| 23 | 23 17 52.03 | 00 09 43.99 | 0.91214 | 0.00080 | 2 | 22.42 | 0.53 | [OII]3727 |
| 24 | 23 17 55.54 | 00 09 55.19 | 0.38519 | 0.00004 | 1 | 22.50 | 0.13 | [OII]3727,Hγ,Hβ,[OIII]4959,[OIII]5007 |
| 25 | 23 17 54.92 | 00 10 06.64 | 0.60990 | 0.00052 | 2 | 21.51 | 0.51 | [OII]3727,CaII H,CaII K |
| 26 | 23 18 02.61 | 00 05 01.25 | 0.56462 | 0.00014 | 2 | 21.31 | 0.54 | [OII]3727,CaII K |
| 27 | 23 17 55.64 | 00 05 12.37 | 0.47181 | 0.00035 | 2 | 20.05 | 0.78 | [OII]3727,CaII H,Hβ |
| 28 | 23 18 00.96 | 00 05 37.10 | 0.47310 | 0.00014 | 2 | 21.53 | 0.61 | [OII]3727,Hβ |
| 29 | 23 17 59.80 | 00 06 02.66 | 0.40260 | 0.00006 | 2 | 20.63 | 0.74 | [OII]3727,Hβ,[OIII]5007 |
| 30 | 23 17 58.01 | 00 05 52.12 | 0.75690 | 0.00085 | 3 | 21.68 | 1.46 | CaII H,CaII K |
| 31 | 23 18 01.95 | 00 08 07.40 | 0.46606 | 0.00021 | 3 | 22.01 | 0.67 | [OII]3727,Hβ |
| 32 | 23 18 01.71 | 00 07 43.64 | 0.38053 | 0.00006 | 1 | 21.33 | 0.31 | [OII]3727,Hβ,[OIII]5007 |
| 33 | 23 17 59.78 | 00 06 49.28 | 0 | 21.64 | 1.63 | |||
| 34 | 23 17 59.62 | 00 07 54.73 | 0.16752 | 0.00023 | 1 | 20.52 | 0.37 | Hβ,[OIII]4959,[OIII]5007 |
| 35 | 23 17 59.54 | 00 07 20.42 | 0.60088 | 0.00015 | 1 | 20.59 | 1.17 | [OII]3727,CaII H,CaII K,Hγ |
| 36 | 23 17 59.27 | 00 07 08.94 | 0.59913 | 0.00020 | 1 | 20.61 | 0.78 | [OII]3727,CaII H,CaII K,Hδ |
| 37 | 23 17 57.80 | 00 06 59.51 | 0.59569 | 0.00028 | 2 | 21.18 | 1.17 | [OII]3727,CaII K |
| 38 | 23 17 56.68 | 00 07 33.67 | 0.64769 | 0.00023 | 2 | 20.56 | 1.22 | CaII H,CaII K,G band |
| 39 | 23 17 52.49 | 00 06 28.44 | 0.40436 | 0.00012 | 1 | 22.33 | 0.23 | Hγ,[OIII]4959,[OIII]5007 |
| 40 | 23 17 50.95 | 00 06 38.23 | 0.61876 | 0.00001 | 2 | 21.48 | 0.58 | [OII]3727,CaII H |
| 41 | 23 18 06.78 | 00 08 54.24 | 0.28994 | 0.00012 | 2 | 20.94 | 0.38 | [OII]3727,Hβ,[OIII]5007 |
| 42 | 23 18 06.58 | 00 09 12.49 | 0.28360 | 0.00007 | 1 | 22.12 | 0.32 | Hβ,[OIII]5007 |
| 43 | 23 17 58.64 | 00 08 25.40 | 0.58640 | 0.00069 | 3 | 21.57 | 0.84 | [OII]3727,CaII H,CaII K |
| 44 | 23 17 55.44 | 00 09 04.72 | 0.71340 | 0.00023 | 1 | 21.05 | 0.76 | [OII]3727,CaII H,CaII K |
| 45 | 23 17 55.14 | 00 08 39.34 | 0.56384 | 0.00006 | 1 | 21.30 | 0.26 | [OII]3727,CaII H,CaII K |
| 46 | 23 17 56.00 | 00 09 36.04 | 0 | 21.31 | 1.50 | |||
| 47 | 23 17 51.31 | 00 09 24.59 | 0.75810 | 0.00021 | 2 | 21.04 | 0.70 | [OII]3727,CaII H |
| 48 | 23 17 49.98 | 00 09 46.66 | 0.32390 | 0.00012 | 1 | 21.18 | 0.30 | Hβ,[OIII]4959,[OIII]5007 |
| 49 | 23 18 06.66 | 00 10 02.93 | 0.59449 | 0.00080 | 3 | 21.75 | 0.49 | [OII]3727 |
Note. — Whenever information could not be obtained for a specific target, a symbol ’…’ is used. Stars found in our data have zero redshift.
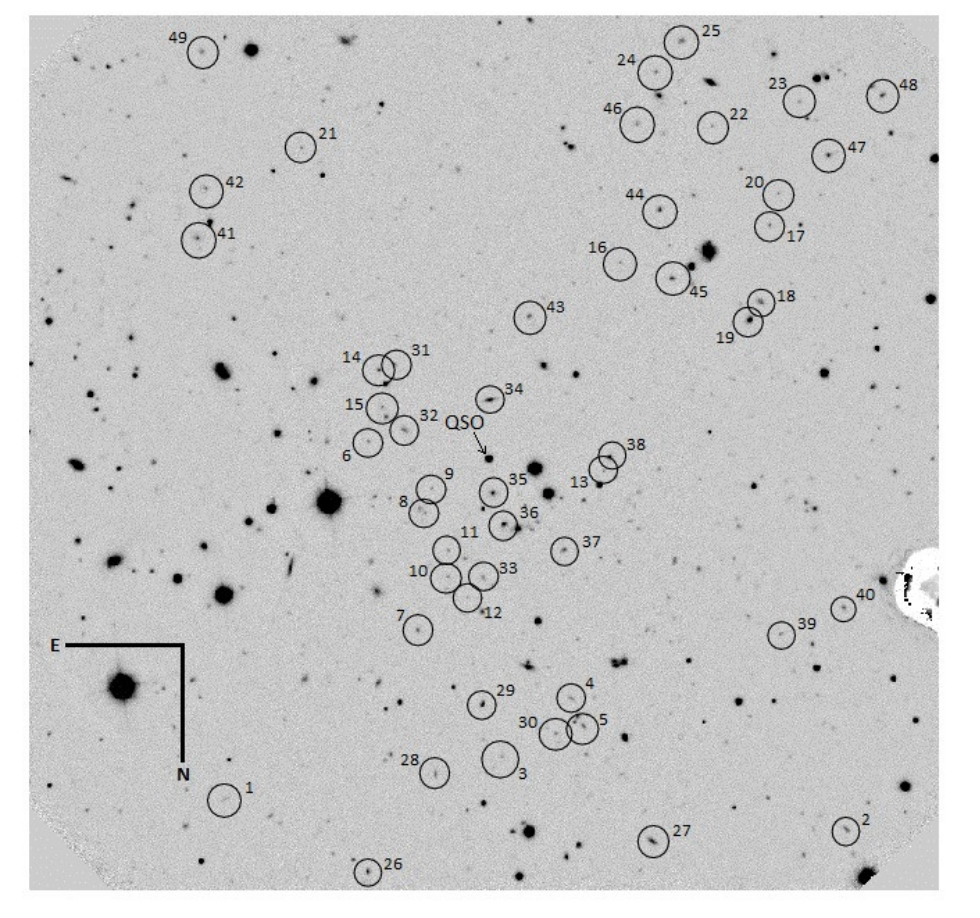
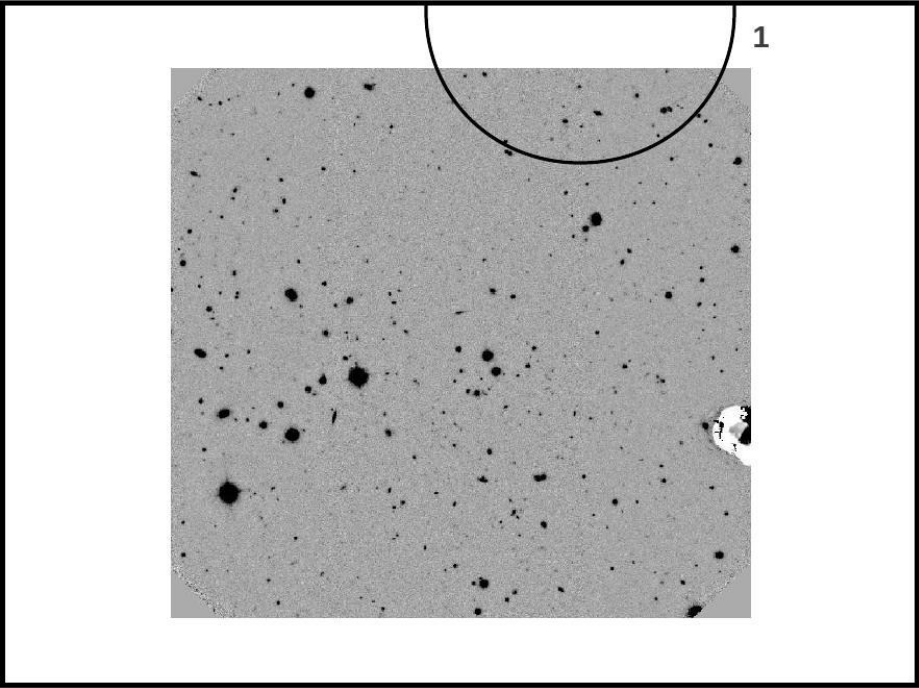
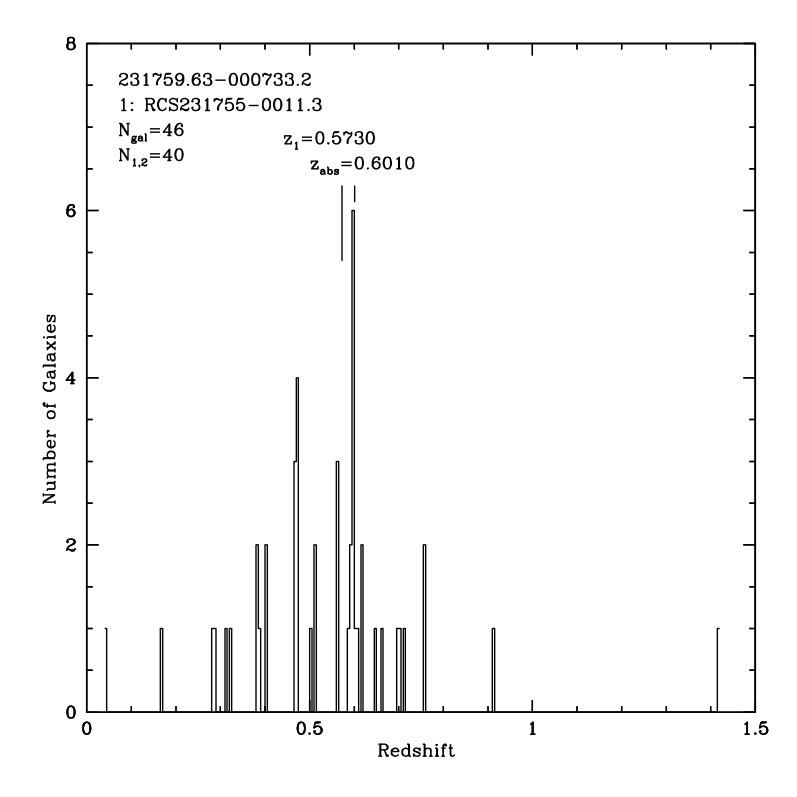
| No. | RA(J2000) | DEC(J2000) | FlagaaRedshift reliability classifier. | - | Comments | |||
|---|---|---|---|---|---|---|---|---|
| 1 | 23 19 44.07 | 00 27 04.54 | 0.73498 | 0.00055 | 1 | 21.08 | 1.31 | CaII H,CaII K |
| 2 | 23 19 47.51 | 00 26 55.72 | 0.55650 | 0.00080 | 3 | 21.37 | 0.67 | [OII]3727 |
| 3 | 23 19 48.68 | 00 26 47.76 | 0.57801 | 0.00003 | 1 | 21.18 | 0.54 | [OII]3727,CaII H,CaII K |
| 4 | 23 19 49.31 | 00 27 21.82 | 0.56133 | 0.00008 | 1 | 21.64 | 0.43 | [OII]3727,CaII H,CaII K,Hδ,Hγ |
| 5 | 23 19 56.85 | 00 26 09.20 | 0.72041 | 0.00060 | 3 | 20.87 | 1.29 | CaII H,CaII K |
| 6 | 23 19 59.07 | 00 26 25.01 | 0.35052 | 0.00032 | 3 | 20.25 | 0.58 | G band,Hβ,[OIII]5007 |
| 7 | 23 19 42.02 | 00 24 49.00 | 0.80880 | 0.00080 | 3 | 21.97 | 0.79 | [OII]3727 |
| 8 | 23 19 43.77 | 00 25 46.02 | 0.29361 | 0.00007 | 1 | 19.36 | 0.48 | [OII]3727,CaII H,CaII K |
| 9 | 23 19 59.00 | 00 25 10.81 | 0.71750 | 0.00023 | 2 | 20.44 | 1.32 | [OII]3727,CaII H,CaII K |
| 10 | 23 19 59.97 | 00 24 21.60 | 0.84995 | 0.00080 | 3 | 22.94 | 0.28 | [OII]3727 |
| 11 | 23 19 59.83 | 00 25 34.03 | 0.84727 | 0.00080 | 2 | 22.10 | 0.58 | [OII]3727 |
| 12 | 23 19 58.14 | 00 24 57.49 | 0 | 23.30 | 0.64 | |||
| 13 | 23 20 00.28 | 00 24 41.29 | 0.10786 | 0.00003 | 2 | 25.82 | -0.84 | Hα,[SII]6716,[SII]6730 |
| 14 | 23 19 59.27 | 00 24 30.78 | 0.56299 | 0.00005 | 1 | 22.96 | 0.14 | [OII]3727,[NeIII]3868,HeI 3888,[NeIII]3967,Hδ,Hγ,Hβ |
| 15 | 23 19 59.26 | 00 25 18.70 | 0.72096 | 0.00010 | 2 | 21.27 | 1.28 | CaII H,CaII K |
| 16 | 23 19 43.45 | 00 24 03.74 | 0.80923 | 0.00080 | 2 | 21.73 | 0.56 | [OII]3727 |
| 17 | 23 19 55.00 | 00 22 52.10 | 0.44211 | 0.00006 | 1 | 21.53 | 0.33 | [OII]3727,Hγ,Hβ,[OIII]4959,[OIII]5007 |
| 18 | 23 19 55.53 | 00 22 38.24 | 0 | 20.11 | 0.47 | |||
| 19 | 23 19 59.91 | 00 23 51.22 | 0 | 21.24 | 0.79 | |||
| 20 | 23 19 58.61 | 00 23 32.96 | 0 | 22.37 | 0.79 | |||
| 21 | 23 19 58.30 | 00 23 06.43 | 0.59366 | 0.00017 | 1 | 21.76 | 0.75 | [OII]3727,CaII H,CaII K,G band |
| 22 | 23 20 00.58 | 00 22 26.94 | 0 | 20.43 | 1.60 | |||
| 23 | 23 19 57.89 | 00 23 14.75 | 0 | 21.21 | 1.31 | |||
| 24 | 23 19 45.31 | 00 27 10.40 | 0 | 19.86 | 1.50 | |||
| 25 | 23 19 50.46 | 00 27 19.58 | 0.27483 | 0.00004 | 1 | 20.48 | 0.31 | [OII]3727,Hγ,Hβ,[OIII]4959,[OIII]5007 |
| 26 | 23 19 42.12 | 00 26 06.29 | 0.42579 | 0.00010 | 1 | 20.96 | 0.36 | [OII]3727,Hβ,[OIII]4959,[OIII]5007 |
| 27 | 23 19 42.64 | 00 26 56.15 | 0.39177 | 0.00007 | 1 | 21.17 | 0.74 | [OII]3727,Hβ |
| 28 | 23 19 43.76 | 00 26 39.95 | 0 | 21.50 | 1.41 | |||
| 29 | 23 19 44.64 | 00 25 52.28 | 0.25271 | 0.00005 | 1 | 18.56 | 0.62 | CaII H,CaII K,Hβ,[OIII]5007 |
| 30 | 23 19 44.89 | 00 26 20.04 | 0.18640 | 0.00014 | 2 | 19.44 | 0.57 | [OII]3727,Hβ,Hα |
| 31 | 23 19 55.02 | 00 26 30.37 | 0.38420 | 0.00005 | 1 | 20.99 | 0.31 | [OII]3727,Hβ,[OIII]4959,[OIII]5007 |
| 32 | 23 19 56.12 | 00 25 30.72 | 0.35157 | 0.00035 | 3 | 20.56 | 0.43 | CaII K,Hβ |
| 33 | 23 19 58.13 | 00 25 21.00 | 0.49035 | 0.00006 | 1 | 20.19 | 0.70 | [OII]3727,CaII H,CaII K |
| 34 | 23 19 58.97 | 00 25 39.29 | 0 | 20.82 | 0.70 | |||
| 35 | 23 19 50.11 | 00 25 10.74 | 0.15560 | 0.00002 | 1 | 19.50 | 0.30 | Hγ,Hβ,[OIII]4959,[OIII]5007,Hα |
| 36 | 23 19 51.67 | 00 24 20.30 | 0.45332 | 0.00037 | 2 | 20.28 | 0.73 | CaII H,CaII K,G band |
| 37 | 23 19 53.37 | 00 24 30.82 | 0.63093 | 0.00010 | 1 | 21.46 | 0.12 | [OII]3727,Hγ,[OIII]5007 |
| 38 | 23 20 01.50 | 00 24 42.37 | 0.08539 | 0.00008 | 1 | 19.35 | 0.49 | Hα,[NII]6583,[SII]6716,[SII]6730 |
| 39 | 23 19 55.72 | 00 23 59.71 | 0.18561 | 0.00003 | 1 | 20.40 | 0.21 | Hβ,[OIII]4959,[OIII]5007,Hα |
| 40 | 23 19 46.78 | 00 23 23.68 | 0.42541 | 0.00040 | 3 | 20.29 | 0.25 | Hβ,[OIII]5007 |
| 41 | 23 19 49.40 | 00 23 39.95 | 0.76568 | 0.00020 | 3 | 21.54 | 0.63 | [OII]3727,Hγ |
| 42 | 23 19 51.50 | 00 23 13.06 | 0.28258 | 0.00005 | 1 | 19.00 | 0.60 | CaII H,CaII K |
| 43 | 23 19 50.03 | 00 22 39.90 | 0.42397 | 0.00015 | 1 | 19.37 | 0.50 | [OII]3727,CaII H,CaII K,Hβ |
| 44 | 23 19 51.76 | 00 22 49.69 | 0.71920 | 0.00018 | 3 | 20.83 | 1.05 | [OII]3727,CaII H,CaII K |
| 45 | 23 19 47.54 | 00 22 21.18 | 0.22817 | 0.00012 | 1 | 22.16 | -0.12 | [OII]3727,[OIII]4959,[OIII]5007 |
| 46 | 23 19 47.60 | 00 22 29.03 | 0.44134 | 0.00023 | 1 | 19.16 | 0.69 | [OII]3727,CaII H,G band |
Note. — Whenever information could not be obtained for a specific target, a symbol ’…’ is used. Stars found in our data have zero redshift.
