Variability survey in the CoRoT SRa01 field:
Implications of eclipsing binary distribution on cluster formation in NGC 2264
Abstract
Time-series photometry of the CoRoT field SRa01 was carried out with the Berlin Exoplanet Search Telescope II (BEST II) in 2008/2009. A total of 1,161 variable stars were detected, of which 241 were previously known and 920 are newly found. Several new, variable young stellar objects have been discovered. The study of the spatial distribution of eclipsing binaries revealed the higher relative frequency of Algols toward the center of the young open cluster NGC 2264. In general Algol frequency obeys an isotropic distribution of their angular momentum vectors, except inside the cluster, where a specific orientation of the inclinations is the case. We suggest that we see the orbital plane of the binaries almost edge-on.
1 Introduction
NGC 2264 is among the best studied star formation regions. The NGC-designation simultaneously denotes a young, 3 Myr old open cluster and an extended HII-region with some small molecular knots where star formation is still in progress (Mayne & Naylor, 2008). Hundreds of pre-main sequence stars have been identified in this cluster (e.g. Makidon et al., 2004; Ramírez et al., 2004; Fűrész et al., 2006). Signs of current formation of low-mass companion objects (stellar or planetary objects) can be found in this cluster, too (e.g. Hamilton et al., 2005). The cluster is well studied at a broad wavelength range from X-rays (e.g. Dahm et al., 2007), through visual and infrared wavelengths (Ramírez et al., 2004; Fűrész et al., 2006), to radio observations (e.g. Trejo & Rodríguez, 2008).
The cluster contains about 500 well-identified cluster members (Ramírez et al., 2004; Fűrész et al., 2006), but the true number of cluster members reaches (Cody et al., 2013, and references therein).
A very special and unique simultaneous time-series photometric study was carried out in near-infrared by Spitzer, in X-ray by Chandra and in optical by MOST and CoRoT space satellites during the winter 2010/2011. CoRoT also observed this cluster in 2007/2008 for 30 days obtaining another set of ultraprecise time-series photometry (Cody et al., 2013). We used the 25 cm ground-based BEST II (Berlin Exoplanet Search Telescope) in 2008/2009 to support the CoRoT observations in two ways: to keep the validity of the ephemeris of several eclipsing binary stars and planetary candidates for future follow-up observations and to help the determination of possible variable contamination sources inside the CoRoT photometric mask. Since CoRoT’s photometric mask is large (typically arcseconds) due to a dispersion element in the optical path, CoRoT often measures the total flux from several light sources. Therefore, the origin of the light variation is sometimes not the CoRoT-target but one of the contaminating objects or the variation of the main CoRoT-target is diluted by another star. Our observations help to decide which one is the variable source if the amplitude of such variation is above our detection limit. Similar observations for the same purpose were reported in Karoff et al. (2007), Kabath et al. (2007, 2008, 2009a, 2009b), Pasternacki et al. (2011) and Fruth et al. (2012). Since our observations on NGC 2264 cover a whole season, time-series photometric data can also be used to investigate the photometric optical behaviour of the stars between the epochs of the two CoRoT studies.
In this paper we present our study on the variable stars in NGC 2264. Section 2 presents the description of the telescope used and the observations. We report our flux measurements on the known variable stars, we confirm or reject the variability of several previously suspected variable stars as well as we report 920 new variable stars in and around NGC 2264 (Section 3).
In Section 4 we present a set of light curves of an interesting type of pre-main sequence stars. One similar light curve shape was found by Rodrígez-Ledesma et al. (2012), and here we add a selection of new examples to this rare variable star class.
In Section 5 we present the fitted models of 11 selected eclipsing binaries, while in Section 6 we discuss a set of interesting variable stars in our data set.
In Section 7 we shall demonstrate that the observable frequency of Algol-type eclipsing binaries is extremely high inside the cluster area compared to the field. We point out that there is no other possible explanation for this phenomenon but a well-determined, special orientation of the orbital planes of the binaries in the cluster, giving an additional, new constraint for the star formation theories.
Eventually the summary and conclusions of this paper can be found in Section 8.
2 Data acquisition
The observations were performed with the BEST II telescope located at the Observatorio Cerro Armazones, Chile. The system consists of a Takahashi 25 cm Baker-Ritchey-Chrétien telescope equipped with a 4k 4k Finger Lakes CCD. The corresponding field of view is with an angular resolution of pixel-1. In order to maximize the photon yield no filter was used.
BEST II observed the CoRoT target field SRa01 during a total of 50 nights between 2008 December 06 and 2009 February 10. In order to cover the larger FOV of CoRoT completely, SRa01 was split into two BEST II target fields that were observed alternately. These subfields are denoted SRa01a and SRa01b in the following.
3 Variable stars
Since the CoRoT satellite observed this field in 2007/2008 and 2010/2011, our photometric data obtained in 2008 and 2009 are an excellent supplement for characterizing both short and long term variability, thus extending the CoRoT observations.
3.1 Detection
For detecting variable stars, we apply the efficient method described by Fruth et al. (2012). It is based on the widely-used variability index (Stetson, 1996; Zhang et al., 2003) and a multiharmonic period search (Schwarzenberg-Czerny, 1996), but additionally involves an automatic treatment of systematic variability. All light curves with () were fitted with seven harmonics and ranked using the modified Analysis-of-Variance statistic (see Fruth et al., 2012). A cut-off limit was set to based on empirical experiments, yielding 1,805 variable star candidates (728 in SRa01a, 1,077 in SRa01b).
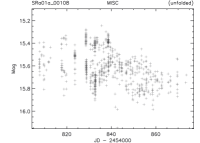
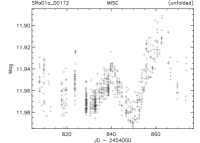
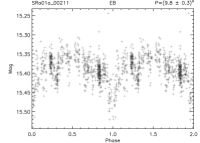
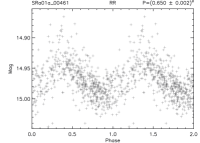
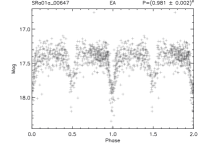
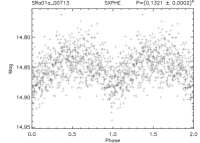
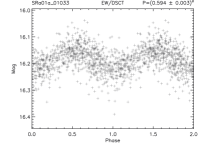
All candidates were inspected visually and classified on an individual basis. We detected a total of 1,161 variable stars, of which 241 were previously known and 920 are new discoveries. The variable star catalogue and the observed light curves are presented here in Table 1 and Figure 1, respectively, for guidance regarding its form and content. Table 1 and Figure 1 are published in its entirety in the electronic edition of Astrophysical Journal.
| BESTID | flag | 2MASSID | RB [mag] | J [mag] | H [mag] | K [mag] | T0 [rHJD] | P [d] | A [mag] | Type | Other names | ||
|---|---|---|---|---|---|---|---|---|---|---|---|---|---|
| SRa01a_00058 | 06372843+1002552 | 13.70 | 9.47 | 8.22 | 7.77 | LPV | |||||||
| SRa01a_00108 | 06364462+0931232 | 15.62 | 15.07 | 14.41 | 14.09 | MISC | |||||||
| SRa01a_00172 | 06365888+0941207 | 11.96 | 8.18 | 7.06 | 6.62 | MISC | |||||||
| SRa01a_00211 | 06363124+0921174 | 15.39 | 12.57 | 11.77 | 11.50 | 10.742 | EB | ||||||
| SRa01a_00461 | 06362054+0912226 | 14.97 | 13.80 | 13.62 | 13.51 | 8.150 | RR | ||||||
| SRa01a_00647 | 06363213+0919546 | 17.42 | 15.76 | 15.18 | 15.00 | 8.248 | EA | ||||||
| SRa01a_00713 | 06380069+1022493 | 14.85 | 13.45 | 12.82 | 12.67 | 7.706 | SXPHE | ||||||
| SRa01a_01033 | 06373374+1002111 | 16.19 | 14.39 | 13.80 | 13.59 | 7.968 | EW/DSCT | ||||||
| SRa01a_01086 | 06373720+1004170 | 12.24 | 7.95 | 6.76 | 6.24 | MISC | |||||||
| SRa01a_01414 | 06381538+1029312 | 14.58 | 11.41 | 10.86 | 10.57 | MISC | |||||||
| SRa01a_01515 | 06365626+0932389 | 16.12 | 15.47 | 15.28 | 15.38 | 7.625 | ELL | ||||||
| SRa01a_01522 | 06380652+1022424 | 12.81 | 8.46 | 7.27 | 6.76 | LPV | |||||||
| SRa01a_01556 | 06365672+0932430 | 16.07 | 14.32 | 13.77 | 13.55 | 8.945 | ELL | ||||||
| SRa01a_01612 | 06372722+0954167 | 14.14 | 12.48 | 12.22 | 12.09 | 8.096 | EA | ||||||
| SRa01a_01754 | 06372176+0949348 | 13.91 | 10.33 | 9.41 | 9.01 | EA |
Note. — Previously known objects are flagged with . The flag denotes stars affected by crowding. Their IDs from VSX or GCVS can be found in the last column. is the brightness in BEST II photometric system. , and are the brightness in 2MASS photometric system. The Epoch is given in reduced Julian date [rHJD] in respect to . It denotes the first minimum in the light curve. is the period and is the amplitude of the variability. This table is published in its entirety in the electronic edition of the Astrophysical Journal. A portion is shown here for guidance regarding its form and content.

3.2 Classification
The classification of the newly discovered periodic variable stars was based on the shape, period and amplitude of their variability according to a simplified scheme based on the General Catalogue of Variable Stars (GCVS, Samus et al., 2009). Pulsating variables were sorted into Delta Scuti (DSCT), Doradus (GDOR), RR Lyrae (RR) and Cepheid variable (DCEP) types. Eclipsing binary star systems were classified as Algol type (EA), Beta Lyrae type (EB), or W Ursae Majoris type (EW). Stars having sinusoidal-like light curves are classified as ellipsoidal variables (ELL), whereas light curves that exhibit typical features of starspots are marked as spotted stars (SP) or BY Draconis-type stars (BY). Non-periodic variables are classified as miscellaneous (MISC). Most of these stars are likely non-periodic pre-main sequence stars. Stars that vary on time scales longer than the observational baseline are classified as long periodic (LP). These stars need further observations to determine their accurate period or to demonstrate their non-periodic behaviour. In the case of questionable light curves we marked as mixed types (EW/DSCT, ELL/SP). Since NGC 2264 is a young open cluster, there are many periodic pre-main sequence stars which were marked as young stellar objects (YSO).
The accuracy of our classification is expected to be around (Fruth et al., 2012). An overview of all classifications is given in Table 2.
| Type | Subfield | All | |
|---|---|---|---|
| Intrinsic variables | |||
| DSCT | 28 (28) | 44 (43) | 72 (71) |
| GDOR | 38 (30) | 17 (17) | 55 (47) |
| DCEP | 10 (9) | 8 (7) | 18 (16) |
| RR | 20 (18) | 10 (10) | 30 (27) |
| SXPHE | 2 (2) | 1 (1) | 3 (3) |
| Extrinsic variables | |||
| EA | 71 (67) | 43 (41) | 114 (108) |
| EW | 18 (18) | 24 (24) | 42 (42) |
| EB | 11 (7) | 8 (8) | 19 (15) |
| E | 1 (1) | 11 (11) | 12 (12) |
| ELL | 158 (134) | 28 (28) | 186 (162) |
| ELL/SP | 10 (8) | 32 (32) | 42 (40) |
| BY | 3 (0) | - | 3 (0) |
| YSO | 155 (89) | 61 (61) | 216 (150) |
| LP | 13 (10) | 10 (9) | 23 (19) |
| EW/DSCT | 9 (9) | 19 (19) | 28 (28) |
| MISC | 229 (113) | 69 (66) | 298 (179) |
| All | 776 (543) | 385 (377) | 1161 (920) |
3.3 Known variables
The stars observed with BEST II are crosschecked with the Variable Star Index (VSX)111http://www.aavso.org/vsx of the American Association of Variable Star Observers and with the GCVS (Samus et al., 2009). Within the observed target field, in total 495 previously known variable stars could be found according to these catalogues, 469 in the subfield ’a’ and 26 in the subfield ’b’. In the subfield ’a’ we found 233 of the 469 as variable star while in ’b’ only 8 of the 26. All of the previously reported variables without any detected variability in our data are pre-main sequence flare stars.
The variable star catalogue (Table 1) contains only the stars that show clear variability in our data. A review of all known variables one-by-one is beyond the limits of this paper.
Previously known variables are marked with a ’k’ flag in Table 1 and the names in other catalogue(s) are also given.
3.4 Newly detected variables
920 out of 1161 are newly detected variables. 543 of them are located in subfield ’a’ and 377 in subfield ’b’. The most populated types among the newly detected variables are of short period pulsators (DSCT and GDOR), eclipsing binaries (EA and EW), stars with sinusoidal light curve and low amplitude (ELL), young stellar objects (YSO) and stars that show irregular variations (MISC). The stars classified as MISC as well as the YSOs are concentrating toward the center of the cluster.
The parameters of all new and previously known variable stars are listed in Table 1.
4 Pre-main sequence stars
Characteristic of a young star forming region, NGC 2264 contains many stars that show rotational modulation-like as well as irregular light variations.
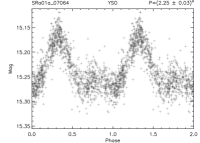
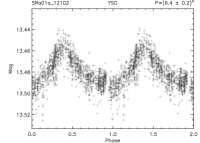
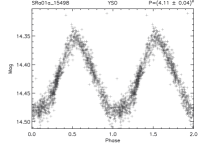
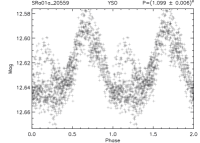
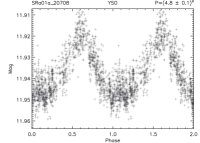


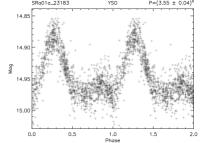
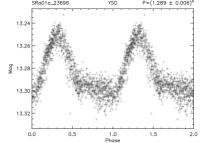
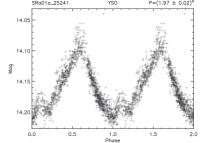
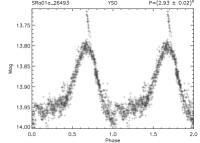
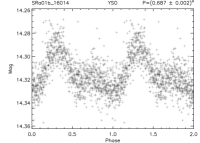
Fig. 2 displays a selected set of unusual light curves. All show similar features e.g. a sharp bump followed by a constant brightness region. This phenomenon was stable during the 67 days between the first and last night of our observations. Only SRa01a_20559 (top right panel of Fig. 2) is an exception, where a second bump appeared in the constant region. This is consistent with a rotational modulation with a hot spot either on the star or on an accretion disk around it. In most cases the bump lasts half of the period which is explained if we are viewing the systems edge-on. Rodrígez-Ledesma et al. (2012) found a similar variation in one star in the Orion Nebula Cluster, but the amplitude of this variation was much larger and the period was much longer than in NGC 2264. We are not aware of any similar light curves in the literature which may be caused by a particular spatial distribution of the inclinations in other clusters (c.f. Sect. 7.1).
A detailed analysis of the pre-main sequence stars is out of the scope of this paper.
5 Notes on selected eclipsing binaries
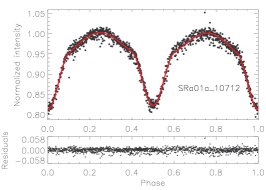
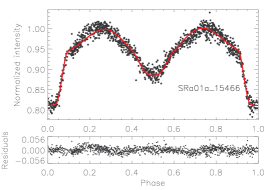
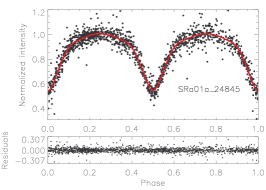
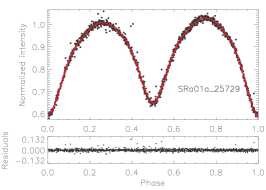

Since some individual eclipsing binaries show interesting features, we studied them in more detail by modeling their light curve with our own code as described by Csizmadia et al. (2009) and Csizmadia et al. (in prep.). This code is based on Roche-geometry, and includes all proximity effects of binaries.
Since the variables presented here are either poorly studied or are new discoveries, the literature has sometimes only limited information on them; in particular there is no radial velocity curve. Therefore we used the colour indices of the selected eclipsing binaries from the 2MASS Point Source Catalogue (Skrutskie et al., 2006) and estimated the temperatures by assuming that both interstellar extinction and the contribution of the secondary to the colour index is negligible. We estimate that the derived temperatures have an error of about K. We leave a detailed modeling for other studies, which are able to utilize higher quality multi-colour photometry with bigger telescopes and spectroscopic data.
| BEST ID | SRa01a_10712 | SRa01a_15466 | SRa01a_24845 | SRa01a_25729 |
|---|---|---|---|---|
| Mass ratio | ||||
| Inclination (∘) | ||||
| Fill-out factor | ||||
| Fill-out factor | ||||
| Temperature (K) | (fixed) | (fixed) | (fixed) | (fixed) |
| Temperature (K) | ||||
| Spot 1 | ||||
| Colatitude (∘) | – | |||
| Longitude (∘) | – | |||
| Diameter (∘) | – | |||
| Temperature factor | – | |||
| Spot 2 | ||||
| Colatitude | – | – | – | |
| Longitude | – | – | – | |
| Diameter | – | – | – | |
| Temperature factor | – | – | – | |
| BEST ID | SRa01a_33269 | SRa01a_34263 | SRa01b_20683 | SRa01b_23029 |
| Mass ratio | ||||
| Inclination (∘) | ||||
| Fill-out factor | ||||
| Fill-out factor | ||||
| Temperature (K) | (fixed) | (fixed) | (fixed) | (fixed) |
| Temperature (K) | ||||
| Spot 1 | ||||
| Colatitude (∘) | – | |||
| Longitude (∘) | – | |||
| Diameter (∘) | – | |||
| Temperature factor | – | |||
| Spot 2 | ||||
| Colatitude (∘) | – | – | – | |
| Longitude (∘) | – | – | – | |
| Diameter (∘) | – | – | – | |
| Temperature factor | – | – | – | |
| BEST ID | SRa01b_38848 | SRa01b_41158 | SRa01b_48723 | |
| Mass ratio | ||||
| Inclination (∘) | ||||
| Fill-out factor | ||||
| Fill-out factor | ||||
| Temperature (K) | (fixed) | (fixed) | (fixed) | |
| Temperature (K) | ||||
| Spot 1 | ||||
| Colatitude (∘) | – | |||
| Longitude (∘) | – | |||
| Diameter (∘) | – | |||
| Temperature factor | – | |||
For those systems where we could not find data we adopted an effective temperature of 6000 K for the primaries. These cases require additional photometry or spectroscopy. The linear bolometric and quadratic -band limb darkening coefficients were taken from van Hamme (1993) and Claret & Bloemen (2011), respectively. The -band is the closest filter to our white light observations. For K we set the gravity darkening exponents and albedos to and and for K we set and (cf. Lucy, 1967; Rucinski, 1969).
The free parameters are: mass ratio, fill-out factors of the components, inclination, effective surface temperature of the secondary, epoch, and height of the maximum brightness. In some cases we added a stellar spot to one or both of the components in order to achieve a better fit. Then we adjusted the size and the temperature of the spot and its astrographic position (stellar co-latitude and longitude). The temperature factor of the spots is defined as the ratio of the temperature ratio of the spot and the star (temperature factor = ).
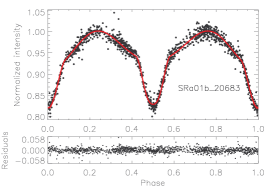
5.0.1 : a possible lower main sequence binary
This system is a detached binary system with days orbital period exhibiting a strong ellipsoidal variation. The components are late types ( K and K) suggesting spectral types of K8-M1 for both components. Since the orbital period is short, the objects are most likely dwarfs. The brightness of the system ( at maximum) will allow a more detailed multicolour photometric and spectroscopic as well as radial velocity study to obtain more precise and absolute dimensions of the system; this improves our knowledge of the lower main sequence.
5.0.2
This 14 magnitude system shows a remarkable scatter in its light curve which varies from cycle to cycle. Spotted solutions yield significantly worse fits than an unspotted light curve model. However, if the star is spotted and the spots evolve fast, then a global spot model describing the phase-folded light curve is probably not appropriate. The system has a very high inclination and total eclipses which help to constrain the mass ratio better (Rucinski, 1973).
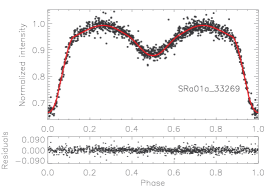
5.0.3
This system is similar to SRa01a_10712 as concerns the shape of the light curve, the orbital period (1.51 vs. 1.43 days), and the surface temperatures ( K, K and K, K, respectively). However, the fill-out factors are almost equal in this system in contrary to SRa01a_10712. Likewise, the mass ratio is much higher: the system consists of almost two equal-sized stars. Whether the components lie before the onset of a mass transfer or whether they will never fill out their Roche-lobes can only be answered by a radial velocity curve.
This system, which is probably composed of low-mass objects () will be an interesting target for the study of low-mass stars.
5.0.4
This 14 mag system is a typical contact binary with an inclination of and days. What makes it interesting is its mass ratio of . Furthermore it exhibits the O’Connell-effect ( mag) which seems to be very stable during the observing run. The O’Connell-effect is generally explained by strong stellar activity (for an overview see Kaszás et al., 1998).
The temperature of the larger star ( K, estimated from ) is higher than the temperature of the smaller secondary ( K) which is consistent with the H-subtype contact binary systems (Csizmadia & Klagyivik, 2004). However, the error of mass ratio () allows the reverse case, too.
5.0.5 : a double M-dwarf system?
This short period ( days) system shows an extreme mass ratio as far as one can estimate from photometry for such a low inclination (i). The system is extremely red, the effective surface temperature of the primary component was estimated to be K, while the secondary has 2700 K. If these parameters are realistic - which is the case if the system does not suffer from interstellar reddening - then these stars form very likely an dM1 + dM8 binary system. Not also are such systems very rare, but also binarity among dM stars. That is why this system may serve as an important target for lower main sequence parameter studies (Torres, 2013). Spectroscopy is needed to check its spectral type and the reddening effect.
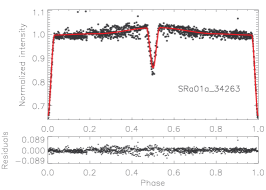
5.0.6
This Algol-type binary has a strange light curve shape around the secondary minimum, where the brightness of the system increases significantly. This increase however is not stable; during our observations it changes, resulting in a larger scatter at these phases. We modeled this feature successfully with a bright spot on the back side of the primary component.
5.0.7
Unfortunately, we did not find any color for this star and hence the light curve modeling results are uncertain. The system seems to consist of two equal stars close to each other, because the ellipsoidal effect is quite clear. Although the two transit depths look similar (indicating nearly equal surface temperatures), the ellipsoidal effect suggests a mass ratio of . Therefore one of the stars may be an evolved object, because of its radius-excess.
5.0.8
This faint ( mag), common orbital period ( days) contact binary star belongs to the A-subtype of contact binaries exhibiting a distinct O’Connell-effect ( mag). To fit its light curve, two spots were required, one very dark () and one very bright (), although this bright spot has a large uncertainty, see Table 3). We propose to obtain a full phase-coverage multicolour light curve, maybe extending it with H measurements to test the validity of our light curve solution and see how the stellar surface inhomogeneities are distributed on this star. However, the presence of strong spot activity is indisputable owing to the presence of a strong O’Connell-effect.
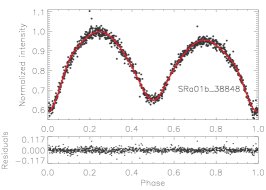
5.0.9
Although this contact binary system is relatively faint (), we obtained a good signal-to-noise ratio light curve. The system belongs to the so-called A-subtype contact binaries in which the bigger star is also the hotter one; in W-subtype systems the smaller component is hotter (Binnendijk, 1965). It is expected that W-subtype systems will show higher spot-activity (e.g. Hendry & Mochnacki, 1992) and W-type systems have generally later spectral types while A-type systems have earlier ones. In the compilation of Maceroni & van’t Veer (1996) the coolest A-subtype system is VZ Psc (4500 K + 4352 K), although it is classified as a H-subtype system in Csizmadia & Klagyivik (2004). We conclude that SRa01b_38848 is a good candidate for an exceptionally low temperature A-type system. This can be proven by multicolour photometry because then one can establish the exact temperature difference between the components from the colour-curves.
The system also shows a remarkably large ( mag) O’Connell-effect. The spot is halfway between the equator and the pole (co-latitude of the spot’s center is degrees) and its longitude is close to (see Table 3).
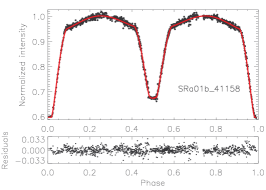
5.0.10
Here, to obtain a satisfactory fit, we must fit the limb darkening coefficients instead of using the table values. The system shows total eclipses which are deep, with an inclination of . Since the components are well separated its brightness of mag makes it an easy target for further studies. Its variability was discovered by the Northern Sky Variability Survey (Woźniak et al., 2004).
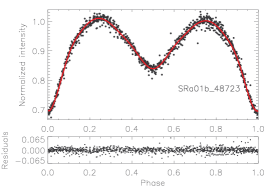
5.0.11 : near contact binary?
The light curve modeling yields near contact binary with days. For the importance of near contact binaries see Eggleton (2012). No signs of spot activity or O’Connell-effect can be seen, which agrees well with the expectation of Hendry & Mochnacki (1992). It is expected that A-subtype systems have lower spot-activity.
6 Other interesting variables
There are many additional interesting variable stars in our dataset. Here we present a selection of these objects. They are shown in Fig. 4.
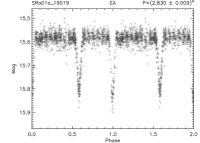

6.1
The object SRa01a_19019 is an eccentric Algol-type eclipsing binary with an orbiting period days. The secondary eclipse is at and the widths of the eclipses are almost the same. This yields an eccentricity of and . and were estimated from the widths and the phases of the eclipses.
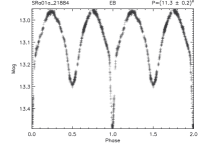
6.2
This object seems to be another near contact or semi-detached system with a long period of 11.3 days. However, widths of the eclipses are not the same (0.1 and 0.2 in phase) and the maxima are located not at 0.25 and 0.75 in phase, but at 0.23 and 0.77. Therefore this system should have an eccentricity of and meaning that we are viewing the system from the direction of periastron.
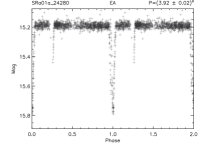
6.3
SRa01a_24280 is also an eccentric Algol-type eclipsing binary system with days. The secondary eclipse is located at which corresponds to an eccentricity of and .
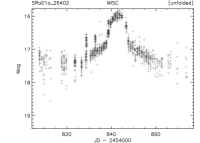
6.4
KH15D is one of the most intriguing objects in NGC 2264. Its variability is caused by a precessing, warped circumbinary disc (Herbst et al., 2010). It has showed variable flux since at least 1965 (Johnson et al., 2005), and started to show eclipses around 1994-1995. The duration as well as the amplitude of such eclipses were continuously increasing (Hamilton et al., 2005). In 2005, it featured 45 days long and 4 magnitude deep eclipses every 90 days. After 2005, the system started to fade, its maximum brightness was mag in 2008/09, but its amplitude was still four mags (Herbst et al., 2010). Our light curve shape (Fig. 4) is fully consistent with the one presented in Fig. 3 of Herbst et al. (2010). Our scatter in the minimum is due to the faintness of the star and the fact that we used a smaller telescope.
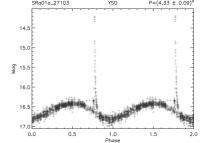
6.5
The star shows a clear rotation modulation with a period of 4.33 days and an amplitude of 0.5 mag. During one night we observed a large flare with an amplitude of 2.5 mag.
6.6
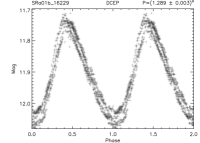
This variable star was discovered by Khruslov (2009). It is a double mode Cepheid. The previously published pulsation periods are and days, so the period ratio is . This ratio is typical for beat Cepheids pulsating in the first and second overtone modes. Our observations confirm the double mode behaviour of the variable star with the periods days and days and the period ratio of .
In the Magellanic Clouds, dozens of double-mode Cepheids pulsating in the first and second overtone modes are known, yet in our Galaxy only three are known (Khruslov, 2009). Therefore, this star requires permanent multicolour observations.
6.7
This object is a contact or near contact eclipsing binary system with an extremely long orbital period of days. For comparison, in the catalogue of contact binaries collected by Csizmadia & Klagyivik (2004), the longest period object is V729 Cyg with days. Further observations are needed with high priority at the minima to be sufficient for modeling.
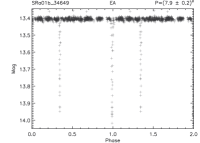
6.8
SRa01b_34649 is another Algol-type eclipsing binary with large eccentricity and with a large amplitude of mag and an orbital period of 7.9 days. The secondary minimum is at which corresponds to an eccentricity of and . Due to the low number of measurements during the eclipses, the system needs further observations. It also requires spectroscopic and radial velocity observations as well as precise eclipse timings.
7 Special spatial distribution of eclipsing binaries
We found 175 eclipsing variables in our dataset. Only 10 of them were previously known. The large number of eclipsing binaries among the variable stars allows us to investigate their distribution in the young open cluster. This is also a very good opportunity to study the early phase of the evolution of these systems.
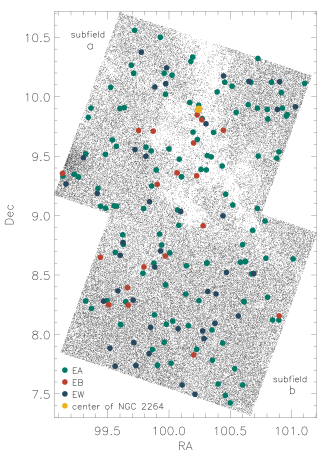
7.1 EA excess in the cluster
To create a spatial distribution statistics of binary stars in NGC 2264, we calculated the fraction of different types (EA, EB and EW) of eclipsing binaries among all detected stars at a given distance from the center of the cluster. The surface density of cluster members decreases from the cluster center outwards. Therefore, if the fraction of a variable star type does not change with distance from the cluster center, this variable type is not connected to the cluster. The center of NGC 2264 (RA = 06:40:58, Dec = +09:53.7) was taken from the SIMBAD database. The distances from the center were binned into degree wide intervals. The stars classified as EW/DSCT were not involved.
| Distance | |||||||
|---|---|---|---|---|---|---|---|
| 0.5 | 10937 | 23 | 0.2100.032 | 6 | 0.0550.013 | 6 | 0.0550.020 |
| 0.5 1.0 | 23869 | 38 | 0.1590.020 | 4 | 0.0170.008 | 10 | 0.0420.012 |
| 1.0 1.5 | 19468 | 31 | 0.1590.023 | 4 | 0.0210.009 | 9 | 0.0460.014 |
| 1.5 2.0 | 22779 | 20 | 0.0880.020 | 4 | 0.0180.009 | 13 | 0.0570.013 |
| 2.0 | 12940 | 11 | 0.0850.029 | 1 | 0.0080.012 | 7 | 0.0540.018 |
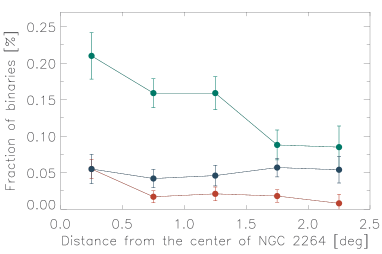
The results are shown in Figure 6 and are summarized numerically in Table 4. Only the Algol-type binaries show a significant decrease on moving outward from the center of the cluster. The fraction of contact systems (EWs) is constant which indicates that these type of eclipsing binaries are not members of the cluster, in contrast to the EA type ones. The ratio of EB type binaries also shows a slight decrease, but there are only 19 of these systems in the whole field. First of all, these results may confirm theoretical calculations suggesting that contact and semi-detached binaries are outcomes of the dynamical evolution of close binary systems after several tens or hundreds of Myrs (Eggleton, 2006).
Using a hypergeometric distribution of the number of EAs it is possible to test the probability that the EA excess is not real but due to a random fluctuation. The chance of detecting 92 EAs among 54,274 stars that are closer than 1.5 degrees to the center of NGC 2264 is only . The estimated error of the number of EAs is the square root of the variance of the statistical distribution, which can be calculated using the total number of all stars, the total number of EAs and the total number of stars in each bin. In this case . The expected value of the number of EAs in this area is 68.7 based on the fraction of all EAs (, see Sect. 7.1.1) and 47.1 if we use the fraction of EAs in the field (). The difference between the number of detected and expected EAs is and , respectively, indicating a real excess. An investigation on the origin of this excess is in Section 7.1.2.
Note that we included also EAs without known periods; their inclusion does not change the results, because we are presently only interested in their relative frequency.
7.1.1 EA frequency inside the cluster
The Algol-type systems are detached eclipsing binaries with a typical period of a few days. The lower limit is around 1 day (Paczyński et al., 2006), while the longest known period is 27 years ( Aur, GCVS).
If we define the relative frequency of Algols as . This frequency is twice of the field’s value in the region the cluster.
We separate the stars into field and cluster member stars. Actually, we do not know which is a field object and which is a cluster member, but we are only interested in the fraction of these two groups and this quantity is known: . The observed fraction of EAs is then the weighted average of the fractions of the two groups, i.e.,
| (1) |
dividing by and taking we get:
| (2) |
where , and are the fractions of EAs among all stars, among the field stars and in the cluster, respectively.
There are known cluster members (Cody et al., 2013, and references therein), therefore we set the number of observable cluster members to 2000. This results in . The fraction of EAs among all stars is . The errors of the observed frequencies are calculated as . was set to 0.00087 which is the ratio of EAs beyond 1.5 degrees from the center of the cluster. All these values result in . This means that more than of the cluster member stars are Algol-type eclipsing binaries, which is 25 times higher than for field stars. In order to check our field frequency we calculated the same ratio for the CoRoT-field LRa02 observed also by BEST II (Fruth et al., 2012). This field contains 115 EAs among a total of 98,219 stars, which yields . Given that we did not find any difference in the magnitude distribution for stars within and outside of the cluster, we regard this value as real.
In the field we can assume that the fraction of binary systems among all stars is around (Yamasaki & Sofue, 2013). If all the stars in NGC 2264 were located in binary systems we could expect a doubled number of EAs in the cluster. This is, however, still 12 times smaller than what we observe.
Another possibility is that during the stellar and binary formation the systems preserve the original angular momentum vector of their parental cloud resulting in a more or less parallel orientation of the orbital planes of the binaries.
7.1.2 Cluster membership of EAs
We tried to separate the Algols that belong to the cluster from the eclipsing binaries in the field to confirm that the observed excess is in the cluster and not in the field.
We checked the proper motions of our stars using the PPMXL proper motion catalog (Roeser et al., 2010). To calculate the probability of the EAs we used the method described by Sanders (1971). The probability that a given star belongs to the cluster can be calculated as
| (3) |
where and are the differences between the proper motion of a star and the average proper motion of the cluster member stars and and the standard deviations of the proper motions of the cluster member stars. The same equation can be used for the field membership () but with the average proper motion of the field stars and their standard deviation.
Since we do not know which ones are cluster members among our 90,065 stars, during the determination of the proper motion of the cluster we used the cluster members identified by Fűrész et al. (2006). The average proper motion of the cluster is mas/year and mas/year. The average proper motion of the field is mas/year and mas/year based on all 90,065 stars.
The normalized probability that a given star belongs to the cluster (Sanders, 1971) is:
| (4) |
The sum of these probabilities for all of the EAs in the cluster area is 30.1, which is the expected number of the cluster member EAs. We were able to identify in the PPMXL catalogue only 87 out of the 92 EAs, therefore this value is underestimated. Using the EA frequency of the expected value of field EAs is 76.6. Since the total number of Algols is 114, it follows that the expected number of cluster member EAs is . This is in good agreement with the value we expect from the proper motion analysis. Since the distance of the cluster is 900 pc, the proper motion values are small and hence it is difficult to select the cluster members individually.
Another way of selecting cluster members is via the use of a color-magnitude diagram. The problem with this method however is that EAs are binary stars and both the brightness and the color are affected by the companion. Moreover, the NGC 2264 is a very young open cluster embedded in a dense interstellar cloud and this cloud produces a non-negligible absorption and reddening even in near-infrared , and bands. Therefore, the de-reddened position of the EAs in a color-magnitude diagram is doubtful. We compared the location of the cluster member stars (Fűrész et al., 2006) and our EAs in the - color-magnitude diagram. We shifted the binaries with the maximum value of 0.75 mag to correct for the additional intensity of the companion in case of two equally bright stars. 46 EAs are located in the same area as the cluster members, which is 25% higher than the number of expected EAs in the cluster.
The most accurate test would be to check the parallaxes of the stars, but, due to the large distance of the cluster, for sufficiently accurate parallaxes we have to wait for the results of the Gaia satellite.
In conclusion, based on both the proper motions and on the color-magnitude diagram there are a sufficient number of cluster member candidates in our EA sample to confirm the EA excess as an extreme excess of eclipsing binaries in NGC 2264. The expected value of Algols among the 2000 cluster members based on the Algol frequency in the field is only 1.74 contrary to the 30.1 and 46 using the proper motions and the color-magnitude diagram, respectively.
7.1.3 Model of the fraction of EAs
It is reasonable to assume that the increased frequency os Algols in the cluster area is due to the cluster members, because the chance of being only a random fluctuation in the field is extremely low. In order to explain the excess we modeled the fraction of observed Algol type binaries. We assume an initial inclination () and a scatter () with a normal distribution.
It is possible to calculate the theoretical fraction of EAs in the field and in the cluster using only basic physical equations and empirical relations. We assume the period distribution as follows:
| (5) |
where is a random variable distributed uniformly over the range [0,1]. Since there are only a few EAs with an orbital period less than 1 day (Paczyński et al., 2006) we remove the binary stars with day, and taken into account only stars with longer periods. In our sample there are only 6 EAs with a period shorter than 1 day. For longer periods this distribution is appropriate.
The mass distribution is:
| (6) |
where is another random number uniformly distributed between 0 and 1. Finally the mass ratio is:
| (7) |
where is a third random number also uniformly distributed in [0,1]. We use only circular orbits (). Relations 5 - 7 were taken from Eggleton (2006).
The mass-radius relation was (Tingley & Sackett, 2005):
| (8) |
We see an eclipse, if
| (9) |
where is the inclination of the orbital plane and is the critical inclination. can be expressed as:
| (10) |
where is the semi-major axis of the orbit. This can be calculated from Kepler’s 3rd law:
| (11) |
and are in solar units, while is in days.
First, we simulate the Algol-type variables with a uniformly distributed angular momentum unit vector in space. Using a Monte Carlo simulation, we generated 50,000 binary systems with the parameter distribution described above and a distribution of the inclinations varying as:
| (12) |
where is another random number uniformly distributed in [0,1].
Assuming of binary systems, this model yields an fraction of eclipsing binaries.
There are two more factors that influence the observability of these systems. One is the depth of the eclipse. There are many grazing eclipsing systems with very small amplitudes. In our sample all the eclipsing systems have at least 0.04 mag deep eclipses, so we set the lower limit to 0.04 mag. The depth of the eclipse is calculated without taking into account the limb darkening.
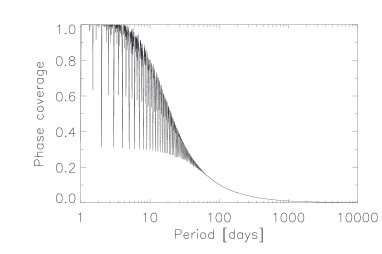
The other factor comes from the epochs of the observations itself. If an Algol-type system has an orbital period of e.g. 2.0 days but the eclipses appear in the daytime we have no chance to observe them. Therefore, we calculated the fractional phase coverage as a function of orbital period. This function gives the probability that we observe at least one eclipse in our dataset. This is shown in Fig. 7. The calculation takes periods until days into account. Then instead of counting the EAs with at least 0.04 mag amplitude and day, we summarize these probabilities for the detectable binaries.
Finally the relative frequency of the observable Algol type systems in our dataset is . This is acceptably close to the observed value of . For fainter stars the limiting eclipse depth of 0.04 mag is somewhat underestimated. If we set the limiting amplitude to 0.1 mag the observable frequency is , and thus not significantly different.
The observed fraction of Algols in NGC 2264, however, is , more than 20 times higher. If all stars were binaries, this could increase the field’s frequency to inside the cluster but not to . This leads us to suggest that the inclinations cannot be isotropically distributed inside the cluster. Using our model we can check whether there is a combination of the initial inclination and a scatter around it that can reproduce this high fraction. Therefore we run a Monte Carlo simulation. The inclinations are taken as follows:
| (13) |
where is a random number uniformly distributed in [0∘,90∘] and is another random number normally distributed around 0∘ with standard deviation in [0∘,45∘].
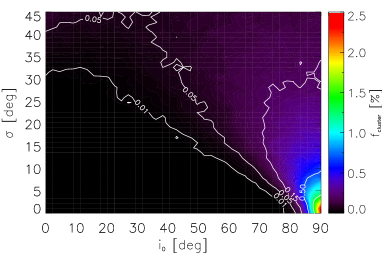
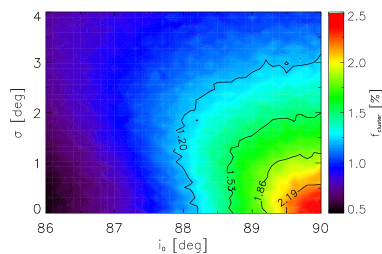
The results are shown in Fig. 8. Both panels of this figure are based on a Monte Carlo simulation of 10,000 inclination distributions described in Eq. 13. In the top panel of Fig. 8 we plot the whole modeled range, while in the bottom panel we zoom into the right bottom corner region. As one can see, there is only a very small region where the fraction of detectable EAs is around , our measured value. So the average inclination of the NGC 2264 should be above and the standard deviation is less than . Practically we see the cluster’s eclipsing binaries edge on.
7.1.4 Possible explanation of the excess
There are two possible solutions for the origin of this distribution. First, there may be a physical mechanism that uniformises the angular momentum vector distribution inside the cluster. Second, and more likely, the original direction of the angular momentum vector of the cloud from which the cluster was formed was conserved even if the total amount of the angular momentum was decreased during the star formation process. The parallel orientation of the outflows in star forming regions also supports this scenario (e.g. Froebrich & Scholz, 2003; Trinidad et al., 2004).
Although the suggested common inclination distribution has some implications on the star formation processes, it is out the scope of this paper to investigate which star formation theory includes the conservation of the direction of the angular momentum vector.
The proposed strict inclination distribution of the binaries may explain also the lack of eclipsing binaries in the Pleiades (Bukowiecki et al., 2012). In the lower left part of the top panel of Fig. 8 the fraction of observable eclipsing binaries is practically 0, although about 2/3 of the stars in the Pleiades are binaries (Kähler, 1999).
These results also have an important consequence for transiting exoplanet searching surveys. If we can assume that the same process works for planet formation as for multiple star formation including the Kozai-mechanism (Fabrycky & Tremaine, 2007; Mazeh & Shaham, 1979) and the planets remain in the same orbital plane for longer timescales, one is unlikely to find any transiting exoplanet in open clusters that do not contain eclipsing binaries. Thus the more favourable targets for transit searches are eclipsing binary-rich clusters.
8 Summary
We presented a study of the variable stars in and around the young open cluster NGC 2264 observed by BEST II in 2008/2009. We detected 1,161 variable stars out of 90,065 stars in our field of view. Only 241 of these stars were previously reported as variables, 920 are newly detected.
We collected a set of young stellar objects with unusual light curves. A similar light curve was already found by Rodrígez-Ledesma et al. (2012), but our amplitudes are smaller and the periods are shorter. The large number of such objects is maybe due to the extreme distribution of the direction of angular momentum vectors (see Sect. 7).
We studied the light curves of 11 eclipsing binaries. SRa01a_10712 seems to be a lower main sequence binary, while SRa01a_33269 is a possible double M-dwarf system.
Investigating the spatial distribution of the Algol-type eclipsing binaries in the field we found that the fraction of these binaries is extremely high in the cluster. The incidence of these systems is 25 times more frequent than outside the cluster among the field stars. We checked whether this excess is real and we found that the probability of it being a statistical fluctuation is extremely low. Therefore, it is reasonable to assume that the excess is caused by the Algols inside the cluster. We also searched for the origin of the excess and we concluded that the number of cluster member candidate EAs is in very good agreement with our assumption. This feature can be explained if we assume that the angular momentum vectors of the orbital motions are directed anisotropically. This direction originates most likely from the original angular vector of the parental cloud. In the case of NGC 2264, the average inclination of the orbital planes should be more than with a standard deviation less than . This model can explain also the lack of eclipsing binaries in the Pleiades. If the inclination of a cluster is low enough, we cannot see any eclipsing binaries even if the scatter of the inclinations is higher. It is the task of star formation theories to explain the extremely high ratio of Algol type variables. Our finding is in agreement with the outflows in star forming regions (Froebrich & Scholz, 2003; Trinidad et al., 2004).
References
- Binnendijk (1965) Binnendijk, L. 1965, Veroeffentlichungen der Remeis-Sternwarte zu Bamberg, 40, 36
- Bukowiecki et al. (2012) Bukowiecki, L., Maciejewski, G., Konorski, P., & Errmann, R. 2012, IBVS, 6021
- Claret & Bloemen (2011) Claret, A., & Bloemen, S. 2011, A&A, 529, 75
- Cody et al. (2013) Cody, A. M., Stauffer, J. R., Micela, G., Baglin, A., & CSI 2264 Team 2013, AN, 334, 63
- Csizmadia & Klagyivik (2004) Csizmadia, Sz., & Klagyivik, P. 2004, A&A, 426, 1001
- Csizmadia et al. (2009) Csizmadia, Sz., Paragi, Zs., Borkovits, T., et al. 2009, ApJ, 705, 436
- Dahm et al. (2007) Dahm, S. E., Simon, T., Proszkow, E. M., & Patten, B. M. 2007, AJ, 134, 999
- Eggleton (2006) Eggleton, P. P. 2006, Evolutionary Processes in Binary and Multiple Systems, Cambridge University Press
- Eggleton (2012) Eggleton, P. P. 2012, JASS, 29, 145
- Fabrycky & Tremaine (2007) Fabrycky, D., & Tremanie, S. 2007, ApJ, 669, 1298
- Fűrész et al. (2006) Fűrész, G., Hartmann, L. W., Szentgyorgyi, A. H., et al. 2006, ApJ, 648, 1090
- Froebrich & Scholz (2003) Froebrich, D., & Scholz, A. 2003, A&A, 407, 207
- Fruth et al. (2012) Fruth, T., Kabath, P., Cabrera, J., et al. 2012, AJ, 143, 140
- van Hamme (1993) van Hamme, W. 1993, AJ, 106, 2096
- Hamilton et al. (2005) Hamilton, C.M., Herbst, W., Vrba, F.J., et al. 2005, AJ, 130, 1896
- Hendry & Mochnacki (1992) Hendry, P. D., & Mochnacki, S. W. 1992, ApJ, 388, 603
- Herbst et al. (2010) Herbst, W., LeDuc, K., Hamilton, C. M., et al. 2010, AJ, 140, 2025
- Johnson et al. (2005) Johnson, J. A., Winn, J. N., Rampazzi, F., et al. 2005, AJ, 129, 1978
- Kabath et al. (2007) Kabath, P., Eigmüller, P., Erikson, A., et al. 2007, AJ, 134, 1560
- Kabath et al. (2008) Kabath, P., Eigmüller, P., Erikson, A., et al. 2008, AJ, 136, 654
- Kabath et al. (2009a) Kabath, P., Fruth, T., Rauer, H., et al. 2009, AJ, 137, 3911
- Kabath et al. (2009b) Kabath, P., Erikson, A., Rauer, H., et al. 2009, A&A, 506, 569
- Kähler (1999) Kähler, H. 1999, A&A, 346, 67
- Karoff et al. (2007) Karoff, C., Rauer, H., Erikson, A., et al. 2007, AJ, 134, 766
- Kaszás et al. (1998) Kaszás, G., Vinkó, J., Szatmáry, K., et al. 1998, A&A, 331, 231
- Khruslov (2009) Khruslov, A. V. 2009, PZP, 9, 31
- Lucy (1967) Lucy, L. B. 1967, ZA, 65, 89
- Maceroni & van’t Veer (1996) Maceroni, C., & van’t Veer, F. 1996, A&A, 311, 523
- Makidon et al. (2004) Makidon, R. B., Rebull, L. M., Strom, S. E., Adams, M. T., & Patten, B. M. 2004, ApJ, 127, 2228
- Mayne & Naylor (2008) Mayne, N. J., & Naylor, T. 2008, MNRAS, 386, 261
- Mazeh & Shaham (1979) Mazeh, T., & Shaham, J. 1979, A&A, 77, 145
- Paczyński et al. (2006) Paczyński, B., Szczygieł, D. M., Pilecki, B., & Pojmański, G. 2006, MNRAS, 368, 1311
- Pasternacki et al. (2011) Pasternacki, T., Csizmadia, Sz., Cabrera, J., et al. 2011, AJ, 142, 114
- Ramírez et al. (2004) Ramírez, S. V., Rebull, L., Stauffer, J., et al. 2004, AJ, 128, 787
- Rauer et al. (2010) Rauer, H., Erikson, A., Kabath, P., et al. 2010, AJ, 139, 53
- Roeser et al. (2010) Roeser, S., Demleitner, M., & Schilbach, E. 2010, AJ, 139, 2440
- Rodrígez-Ledesma et al. (2012) Rodríguez-Ledesma, M. V., Mundt, R., Ibrahimov, M., et al. 2012, A&A, 544, 112
- Rucinski (1969) Rucinski, S. M. 1969, Acta Astron., 19, 245
- Rucinski (1973) Rucinski, S. M. 1973, Acta Astron., 23, 79
- Sanders (1971) Sanders, W. L. 1971, A&A, 14, 226
- Samus et al. (2009) Samus, N. N., & Durlevich, O. V. et al. 2009, Vizier Online Data Catalog, B/GCVS
- Schwarzenberg-Czerny (1996) Schwarzenberg-Czerny, A. 1996, ApJ, 460, 107
- Skrutskie et al. (2006) Skrutskie, M. F., Cutri, R. M., Stiening, R., et al. 2006, AJ, 131, 1163
- Stetson (1996) Stetson, P. B. 1996, PASP, 108, 851
- Tingley & Sackett (2005) Tingley, B., & Sackett, P. D. 2005, ApJ, 627, 1011
- Torres (2013) Torres, G. 2013, AN, 334, 4
- Trejo & Rodríguez (2008) Trejo, A., & Rodríguez, L. F. 2008, AJ, 135, 575
- Trinidad et al. (2004) Trinidad, M. A., Curiel, S., Torrelles, J. M., et al. 2004, ApJ, 613, 416
- Woźniak et al. (2004) Woźniak, P. R., Vestrand, W. T., Akerlof, C. W., et al. 2004, AJ, 127, 2436
- Yamasaki & Sofue (2013) Yamasaki, A., & Sofue Y. 2013, in prep., http://www.hino.meisei-u.ac.jp/phys/astrolab/sofue/htdocs/binary/ms.pdf
- Zhang et al. (2003) Zhang, X., Deng, L., Xin, Y., & Zhou, X. 2003, Chinese J. Astron. Astrophys., 3, 151