11email: lorenzo.morelli@unipd.it 22institutetext: INAF-Osservatorio Astronomico di Padova, vicolo dell’Osservatorio 5, I-35122 Padova, Italy 33institutetext: Space Telescope Science Institute, 3700 San Martin Drive, Baltimore, MD 21218, USA 44institutetext: INAF – Istituto di Astrofisica Spaziale e Fisica Cosmica di Bologna, via Gobetti 101, 40129 Bologna, Italy 55institutetext: INAF – Istituto di Astrofisica e Planetologia Spaziali, Via del Fosso del Cavaliere 100, Roma I-00133, Italy 66institutetext: Departamento de Astronomía y Astrofísica, Pontificia Universidad Católica de Chile, Casilla 306, Santiago 22, Chile 77institutetext: Vatican Observatory, V00120 Vatican City State, Italy 88institutetext: Departamento de Ciencia Fisicas, Universidad Andres Bello, Santiago, Chile
Stellar population properties for a sample of hard X-ray AGNs
Abstract
Aims. The aim of this paper is to study the stellar population of galaxies hosting an active galactic nucleus (AGN). We studied a sub-sample of hard X-ray emitting AGNs from the INTEGRAL and Swift catalogs which were previously identified and characterized through optical spectroscopy. Our analysis provides complementary information, namely age and metallicity, which is necessary to complete the panoramic view of such interesting objects.
Methods. We selected hard X-ray emitting objects identified as AGNs by checking their optical spectra in search for absorption lines suitable for the stellar population analysis. We obtained a final sample consisting of 20 objects with redshift lower than 0.3. We used the full-spectrum fitting method and, in particular, the penalized pixel one applying the PPXF code. After masking all the regions affected by emission lines, we fitted the spectra with the MILES single stellar population templates and we derived mass-weighted ages and metallicities.
Results. Most of the objects in our sample show an old stellar population, but three of them are characterized by a bimodal distribution with a non negligible contribution from young stars. The values of the mass-weighted metallicity span a large range of metallicity with most of them slightly above the solar value. No relations between the stellar population properties and the morphological ones have been found.
Key Words.:
Galaxies: active – Galaxies: evolution – Galaxies: Seyfert – Galaxies: stellar content – Techniques: spectroscopic1 Introduction
The massive work carried out by Masetti et al. (2004, 2006a, 2006b, 2006c, 2006d, 2008, 2009, 2010, 2012), Landi et al. (2007), Parisi et al. (2009, 2012), and Maiorano et al. (2011) (hereafter, Papers I-XIII) supplied the astronomical community with a catalog111The up-to-date version of this catalog is available on http://www.iasfbo.inaf.it/masetti/IGR/main.html of hard X-ray sources for which the identification and the main physical parameters, computed using the multiwavelength information available in the literature, are provided. In total, more than 250 objects in the 20-200 keV range, observed during the INTEGRAL (Winkler et al., 2003) and Swift (Gehrels et al., 2004) missions, 200 of them using the IBIS instrument (Ubertini et al., 2003) and 60 using the BAT one (Barthelmy, 2004), were studied and classified. In particular, to unveil the nature of most of these objects, an optical follow-up was mandatory since only optical spectra permit an accurate source classification and provide fundamental parameters. In Papers I-XIII we measured the flux of the most important emission lines existing in the optical part of the spectrum with the main aim of identifying the object but also of investigating the properties of the host galaxies as, for example, the Compton nature of these objects and an estimate of the mass of the central black hole in broad emission line AGNs. Nevertheless, information regarding the stellar population of the galaxy hosting the AGNs is missing in the catalog. Therefore, stellar populations are new, important and complementary pieces of information which should be included in the catalog and which shed light on the properties of the AGNs and their host galaxies.
In the last decade several authors focused their attention on the relation between the nuclear activity and the star formation rate (Ivanov et al., 2000; González Delgado et al., 2001; Joguet et al., 2001; Ho et al., 2003; La Mura et al., 2009; Draper & Ballantyne, 2011; Cracco et al., 2011; Vaona et al., 2012). Such relation can give important clues about the fate of the gas fuelling the central black hole (Hopkins & Hernquist, 2006) and its influence on the central part of the host galaxy (Sarzi et al., 2005).
According to simulations (Di Matteo et al., 2005; Springel et al., 2005; Fontanot et al., 2011), a merging episode involving galaxies rich in gas induces radial gas inflows which feed the black hole and, consequently, enhance the central star formation. Then, the AGN feedback wipes out basically all the remaining gas and dust (Hopkins & Hernquist, 2006; Rigopoulou et al., 2009), halting the star formation. However, in the last years the proposed scenarios became even more complicated. In fact, the model by Novak et al. (2011) showed that the AGN is a cyclic process, and to account for the observational properties of this class of objects it is necessary to consider different processes acting on different scales, like mechanic feedback inside few pc from the nucleus, radiative feedback and consequent cooling flow of gas on a scale of few kpc, and SN winds, which are relevant on scales of tens of kpc (Ciotti et al., 2010).
Some observational works (Tremonti et al., 2007; Feruglio et al., 2010; McKernan et al., 2010) stated that AGNs could have played a relevant role in halting the star formation in massive host galaxies. Schawinski et al. (2007) suggested that, if the accretion of material onto the central black hole is powerful enough, then the feedback could stop any star formation activity in the nucleus of the hosting galaxy and even beyond. As a consequence of this process the stellar populations in the AGN host galaxies is old and this, as suggested by Schawinski et al. (2007) and Faber et al. (2007), causes the host galaxies to move from the blue cloud to the red sequence of the galaxy optical color diagram. Moreover, Bluck et al. (2011) computed the average energy output per galaxy due to AGN showing that this is at least 35 times larger than the binding energy of a typical massive galaxy.
Since an invaluable piece of information to understand the processes of formation and evolution of galaxies is imprinted in their stellar populations, in the recent years some studies aimed to investigate the properties of the stellar populations of the host galaxy have been conducted. Studying the stellar populations in the nuclear region and their radial profile of a sample of AGNs, mostly Seyfert 2 (hereafter Sy2), it was found that about one third of the galaxies in the sample shows an old bulge-like stellar population in the center (Ho et al., 2003; Cid Fernandes et al., 2004; Chen et al., 2009) and that the number of objects with old stellar population increases to about two thirds when the outer regions of low luminosity AGN hosts are investigated (Cid Fernandes et al., 2004).
In a recent paper La Mura et al. (2012) investigated the connection between stellar population and mass in a large sample of type 1 and 2 AGNs. They found that the mass of the stellar component is a key ingredient to study the star formation history (Mannucci et al., 2010) of galaxies and, taking it into account, they suggested an evolutionary sequence moving from starburst galaxies to AGNs (Davies et al., 2007; Schawinski et al., 2007).
Essentially, the observations show a variety of results even when they are restricted to the analysis of only Sy2 galaxies for which broad lines are weak or absent (Lawrence et al., 1987). This could be due to the difficulties in choosing homogeneous samples of objects as well as to an intrinsic complexity in interpreting the results, especially considering that the AGN theoretical model is still debated.
In this scenario, our results will be useful to understand the properties of AGN hosts and the consequences of the AGN feedback on them, as well as to help in testing the predictions of theoretical models.
The aim of this paper is, therefore, to present the stellar populations properties for a sample of AGN hosting galaxies which were identified as the optical counterparts of hard X-ray emitting sources in Papers I-XIII.
In Section 2 we described the sample selection and the characteristics of the data. In Section 3 we illustrated the tools we used and the procedure we followed to obtain the final results. In Section 4 we presented and discussed our results concerning the stellar populations, in particular the age and the metallicity derived from the stellar population fitting procedure. Finally, in Section 5 we summarized results and conclusions.
2 Sample Selection and Data Properties
2.1 The Sample
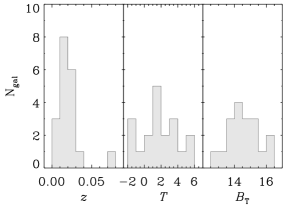
The aim of this paper is to complete the catalog of optical counterparts of hard X-ray sources detected in the massive survey performed by our collaboration (papers I-XIII), for which we have already detected and measured the emission line features, with the study of the stellar population properties of the hosting galaxy. Consequently, for a subsample of objects in the catalog complete information in the X-ray and optical range of the spectrum will be available. In order to choose the galaxy sample we started selecting all those objects identified as AGNs in Papers I-XIII. In detail, these hard X-ray sources were selected among those with unidentified nature belonging to the INTEGRAL and Swift surveys (e.g., Bird et al. 2010; Cusumano et al. 2010). The selection method consisted in choosing sources containing a single soft X–ray object within their arcmin-sized hard X–ray error circle. According to Stephen et al. (2006) this is, with a very high degree of probability, the lower-frequency counterpart of the high-energy emission. Given the arcsecond precision with which the position of soft X-ray sources is available, this technique reduces the sky area for the search of the optical counterpart by a factor 103, easily allowing to pinpoint the actual optical counterpart on which we could, eventually, perform optical spectroscopy to determine its nature. Our survey detected 158 AGNs of different type, but since the study of the stellar populations was not the principal aim of the investigation when the spectra were acquired, many of them are characterized by a short exposure time which does not guarantee either a quality nor a signal-to-noise ratio () suitable for performing a reliable analysis of their stellar population properties. Out of the initial sample of optical counterparts of AGNs, for the following analysis we considered only the extracted spectra with and for which the important absorption lines (i.e. , Mg, and Fe) were not strongly contaminated by broad-band emission lines or residual sky subtraction. Therefore, the final sample comprised 20 objects, mostly classified as Sy2, with soft and hard X-ray emission detected, and with gas emission lines measured. All these galaxies lie in the redshift range , and their properties are listed in Table 1.
| Galaxy | Galaxy | Type | Class | Source | |||
|---|---|---|---|---|---|---|---|
| name | alt. name | (mag) | |||||
| (1) | (2) | (3) | (4) | (5) | (6) | (7) | (8) |
| IGR J01528-0326 | PGC 6966 | SA(s)c? | 5.0 | likely Sy2 | 0.017 | 14.11 | Masetti et al. (2008) |
| IGR J02524-0829 | LEDA 10875 | Sa? | 1.7 | Sy2 | 0.017 | 15.03 | Masetti et al. (2009) |
| IGR J04451-0445* | LEDA 1053623 | S? | 1.7 | likely Sy2 | 0.076 | 17.10 | Masetti et al. (2010) |
| IGR J18244-5622 | IC 4709 | Sa | 1.5 | Sy2 | 0.017 | 14.42 | Masetti et al. (2006c) |
| IGR J18308+0928 | LEDA 1365707 | E? | -2.0 | Sy2 | 0.019 | 15.06 | Masetti et al. (2010) |
| PBC J0041.6+2534 | NGC 0214 | SAB(r)c | 5.0 | Sy2/LINER | 0.015 | 12.94 | Parisi et al. (2012) |
| PBC J0759.9+2324 | MCG+04-19-017 | Sab | 2.2 | Sy2 | 0.029 | 14.80 | Parisi et al. (2012) |
| PBC J0919.9+3712 | IC 2461 | Sb | 3.3 | Sy2 | 0.008 | 14.63 | Parisi et al. (2012) |
| PBC J0954.8+3724 | IC 2515 | Sb | 3.0 | Sy2 | 0.019 | 15.02 | Parisi et al. (2012) |
| PBC J1246.9+5432 | LEDA 43101 | Sa | 1.0 | Sy2 | 0.017 | 13.60 | Parisi et al. (2012) |
| PBC J1335.8+0301 | NGC 5231 | SBa | 1.0 | Sy2 | 0.022 | 14.29 | Parisi et al. (2012) |
| PBC J1344.2+1934 | PGC 048674 | E? | -1.9 | Sy2/LINER | 0.027 | 15.58 | Parisi et al. (2012) |
| PBC J1345.4+4141 | NGC 5290 | Sbc? | 4.0 | Sy1.9 | 0.009 | 13.30 | Parisi et al. (2012) |
| PBC J1546.5+6931 | PGC 2730634 | S? | 0.5 | Sy1.9 | 0.037 | 16.08 | Parisi et al. (2012) |
| Swift J0134.1-3625 | LEDA 5827 | SA0 | -1.2 | Sy2 | 0.029 | 14.03 | Parisi et al. (2009) |
| Swift J0501.9-3239 | LEDA 17103 | SB0/a?(s) | 0.1 | Sy2 | 0.013 | 13.87 | Parisi et al. (2009) |
| Swift J0601.9-8636 | LEDA 18394 | Sb? | 2.8 | Sy2 | 0.006 | 13.51 | Landi et al. (2007) |
| Swift J0811.5+0937 | USNO-A2.0 0975-05763590 | - | - | XBONG | 0.286 | - | Parisi et al. (2009) |
| Swift J0911.2+4533 | LEDA 2265450 | S? | 3.3 | Sy2 | 0.027 | 16.47 | Parisi et al. (2009) |
| Swift J1238.9-2720 | ESO506–G027 | S0 | -0.8 | Sy2 | 0.024 | 14.66 | Landi et al. (2007) |
NOTES: Col. (1): name of the galaxy. Col. (2): alternative name of the galaxy. Col. (3): morphological type derived from the Third Reference Catalogue of Bright Galaxies (de Vaucouleurs et al., 1991) and from the Hyperleda database (Paturel et al., 2003). Col. (4): numerical morphological type from the Hyperleda database. Col. (5): classification of the AGN. Col. (6): redshift of the object. Col. (7): total apparent magnitude in the B-band derived from the Hyperleda database. Col. (8): reference source for the galaxy. * The identification of this object is still not confirmed.
2.2 The data
The spectroscopic observations of the sample galaxies were carried out with a variety of setup using different telescopes. In detail:
-
•
the 3.58m “Telescopio Nazionale Galileo” (TNG) in La Palma, Spain;
-
•
the 2.1m telescope of the Observatorio Astronomico Nacional in San Pedro Martir, Mexico;
-
•
the 1.5m at the Cerro Tololo Interamerican Observatory (CTIO), Chile;
-
•
the 1.52m “Giandomenico Cassini” telescope of the Astronomical Observatory of Bologna, in Loiano, Italy.
Some spectra were also retrieved from the Sloan Digital Sky Survey (SDSS) archive (Adelman-McCarthy et al., 2006, 2008) as well as from the Six-degree Field Galaxy Survey (6dFGS) archive (Jones et al., 2004).
We refer to Papers I-XIII for detailed explanations on the observing setup, data reduction, calibration and previous analysis. In column 6 of Table 1 the reference paper for each object is listed. In this paper we just summarized the basic useful properties of the spectra used in the following analysis.
The sample consists of 20 galaxies spectra acquired in long slit mode. The wavelength range between 3800 and 7500 Å was covered with a reciprocal dispersion between and Å pixel-1 after pixel binning. This corresponds to an instrumental velocity dispersion within the range at 5500 Å.
3 Measurements of the Stellar Populations
The stellar population properties, namely age and metallicity, were measured mainly from the following absorption features: line ( 6563Å), line ( 4861Å), line ( 4340Å), line ( 4102Å), Mg I line triplet ( 5164, 5173, 5184Å), and Fe lines ( 5270, 5335Å). With few exceptions, it was not possible to obtain information either from the blue part (Å) of the spectrum, because of the low efficiency of the optics, nor from the red part (Å), due to the residuals of the strong emission lines of the sky in this region.
As done by Onodera et al. (2012) we applied the penalized pixel fitting (pPXF; Cappellari & Emsellem 2004222Program available on http://www-astro.physics.ox.ac.uk/ mxc/idl/), including the linear regularization of the weights (Press et al., 1992), to derive the distribution of the mass fraction in different age and metallicity bins, and the Gas AND Absorption Line Fitting (GANDALF, Sarzi et al., 2006) IDL333Interactive Data Language is distributed by Exelis Visual Information Solutions. packages, adjusted for dealing with the sample spectra.
Even if in Sy2 galaxies the featureless continuum and broad lines are weak or absent (Lawrence et al., 1987), in the fitting procedure we allowed the code to use also broad-band components. To account for the effect of dust and possible residuals of the data reduction procedure, we adopted a low order multiplicative polynomial in the template fitting. This has the advantage to make our method more sensitive to the absorption lines than to the continuum shape and, therefore, less sensible to the effects of reddening. However, we could not completely rule out the possibility of underestimating the weight of a very reddened young stellar components in deriving the composite stellar populations.
For each spectrum, we fitted a linear combination of 156 template stellar spectra (Vazdekis et al., 2010) from MILES (Sánchez-Blázquez et al., 2006) library ( Å spectral resolution Beifiori et al. 2011) to the observed galaxy spectrum by performing a minimization in pixel space. Since the resolution of the sample spectra spans a large range of values (always lower than the template stellar spectra one), for each galaxy it was necessary to convolve each template with the line-of-sight velocity distribution (LOSVD) and to rebin both the template and the galaxy spectrum to match their dispersions before running the fitting code.
We adopted the Salpeter initial mass function (Salpeter, 1955), 26 ages ranging from 1 Gyr to 17 Gyrs, and 6 metallicities [] from -1.71 to 0.22. Simultaneously, we fitted the observed spectra using emission lines in addition to the stellar templates.
The extracted spectra on which we performed the measurement were the same used to derive the emission lines properties in Papers I-XIII. This guarantees to perform the analysis in the same spatial regions used for the detection and measurements of the emission lines. The linear scale on which we were measuring galaxy properties depends on the combination of redshift and slit aperture and it ranges from 200 pc to 2 kpc. Swift J0811.5+0937 is the only exception, having a linear scale of 6 kpc. On the basis of above, in almost all the cases the region we were investigating was big enough to allow a study of the stellar populations of the bulge central region surrounding the AGN.
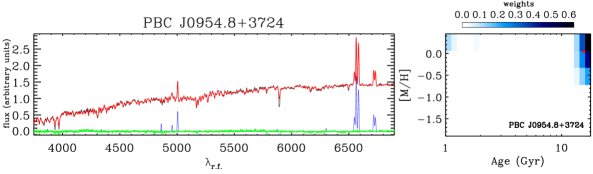
The example of fitting procedure shown in Figure 2 (left panel) refers to galaxy PBC J0954.8+3724 and proves the good quality of the fit we obtained for all the galaxies. From the fitted single stellar population (SSP) we, then, derived the stellar mass fraction within each age and metallicity interval (right panel).
4 Results and Discussion
We applied the procedure described in Section 3 to all the galaxies in our sample.
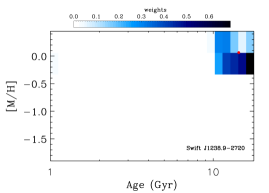
The distribution of the age and metallicity templates used by the code was, in general, smooth for most of the galaxies and indicated that the bulk of stars in the considered region tends to be old.
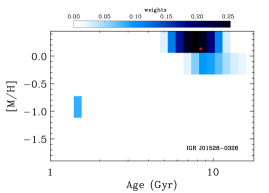
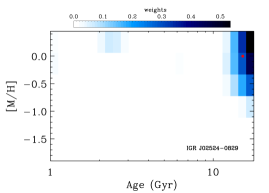
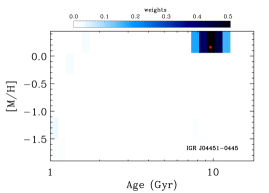
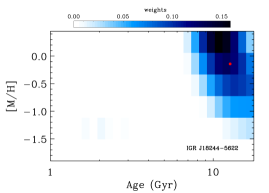
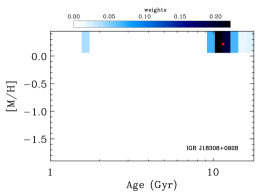
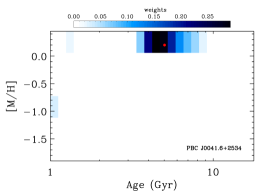
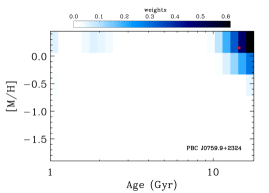
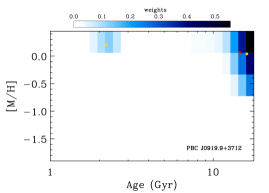
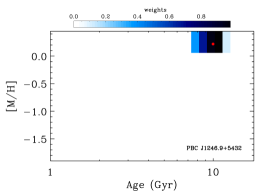
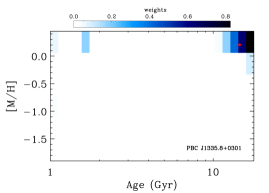
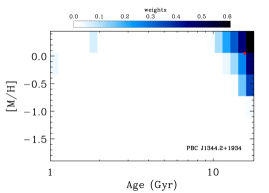
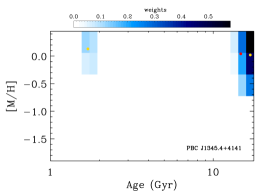
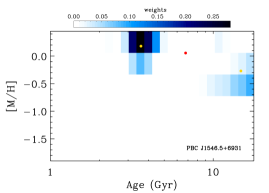
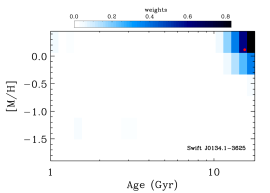
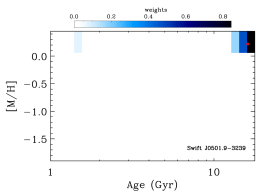
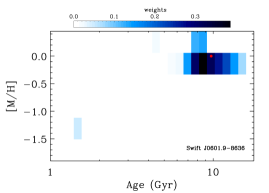
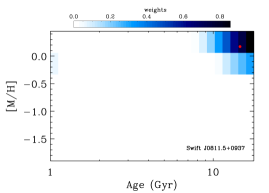
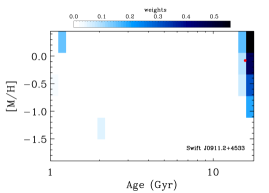
To quantify this effect, for each galaxy we derived the mass-weighted age and the mass-weighted metallicity [] of its stellar population. These values are listed in Table 2 and plotted in Figures 3, 4, and 5. The color scale refers to the mass fraction in each bin of age and metallicity. The errors on the age and metallicity given in Table 2 were obtained from photon statistics and CCD readout noise, and they were calibrated through a series of Monte Carlo simulations.
| Galaxy | Age | Metallicity |
|---|---|---|
| name | (Gyr) | [M/H] |
| (1) | (2) | (3) |
| IGR J01528-0326 | 8.41.2 | 0.130.04 |
| IGR J02524-0829 | 15.20.8 | 0.010.02 |
| IGR J04451-0445 | 9.62.1 | 0.160.05 |
| IGR J18244-5622 | 12.81.1 | -0.170.04 |
| IGR J18308+0928 | 11.51.3 | 0.210.02 |
| PBC J0041.6+2534 | 5.01.1 | 0.190.03 |
| PBC J0759.9+2324 | 14.40.7 | 0.150.01 |
| PBC J0919.9+3712 | 14.50.6 | 0.060.02 |
| PBC J0954.8+3724 | 15.51.4 | 0.040.02 |
| PBC J1246.9+5432 | 10.00.9 | 0.210.01 |
| PBC J1335.8+0301 | 14.50.7 | 0.200.02 |
| PBC J1344.2+1934 | 15.61.0 | 0.040.04 |
| PBC J1345.4+4141 | 14.80.9 | 0.050.03 |
| PBC J1546.5+6931 | 6.81.7 | 0.050.03 |
| Swift J0134.1-3625 | 15.41.3 | 0.110.03 |
| Swift J0501.9-3239 | 15.21.4 | 0.100.02 |
| Swift J0601.9-8636 | 9.71.5 | 0.000.04 |
| Swift J0811.5+0937 | 14.61.1 | 0.170.03 |
| Swift J0911.2+4533 | 15.70.9 | -0.080.02 |
| Swift J1238.9-2720 | 14.31.1 | 0.060.02 |
NOTES: Col. (1): object name. Col. (2): mass-weighted age in Giga-years derived from the stellar population fitting. Col. (3): mass-weighted metallicity derived from the stellar population fitting.
In detail, almost all galaxies are characterized by an old stellar population, with ages ranging from 8.4 Gyr to 15.7 Gyr. There are only 2 galaxies (PBC J1546.5+6931 and PBC J0041.6+2534) with . However, PBC J1546.5+6931 shows a clear bimodality in the distribution and, for this reason, and [] are not properly describing its stellar population. Therefore, for this object we independently derived the typical parameters of the two distinct stellar populations. The younger one is characterized by and [] and it contributes to % of the total mass of the galaxy. The remaining % of the galaxy mass is due to a older population () with subsolar metallicity ([]).
Even though this is the most representative example of bimodality in the stellar population distribution, there are other two galaxies, namely PBC J0919.9+3712 and PBC J1345.4+4141, showing a second stellar population accounting for more than 10% of the total galaxy mass. The final results for the three galaxies with two separate stellar populations are listed in Table 3. As can be noted from Table 3, for both PBC J0919.9+3712 and PBC J1345.4+4141 the less massive component is a young one, which accounts for 12% and 15% of the total mass, respectively. The linear scales for these two objects are the smallest in our sample ( pc) and this could have increased our sensibility in detecting a young component existing in the nuclear region of the galaxy.
It is interesting to note that an additional young component was also found by Cid Fernandes et al. (2004) in of the galaxies in their sample. Their percentage, higher than what we found, could be ascribed to the fact that we were observing a larger region of the galaxy compared to what they did. For this reason we were less sensitive to the young stellar populations which is, possibly, increasing towards the nucleus of the galaxy (Cid Fernandes et al., 2005). This could be the reason for the young component detected in PBC J0919.9+3712 and PBC J1345.4+4141. On the other hand, this is not the case of PBC J1546.5+6931 which is showing a dominant young population and whose linear scale is bigger ( kpc). An explanation for the global young stellar population of this galaxy must be searched in its formation and evolutionary history.
Finally, the old ages we derived for the majority of the galaxies in the sample are in agreement with the results obtained for a large sample of infrared selected AGNs by Chen et al. (2009). Those objects, spanning different spectral classes and luminosities, all show clearly the old stellar population dominating the total mass and no relevant contributions from the young one. These results are indirectly confirming what Schawinski et al. (2007) stated, i.e. that Sy2s reside very close to, or even lie in, the red sequence of galaxies.
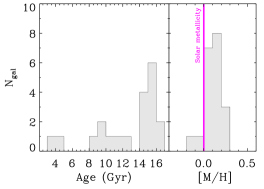
The values of the mass-weighted age and metallicity that we obtained considering only one stellar population (i.e. the one dominating the mass) are shown in Figure 6 in the left and right panel, respectively.
| Galaxy | Age | Metallicity | Mass | ||
|---|---|---|---|---|---|
| name | Young | Old | Young | Old | Old |
| (Gyr) | [M/H] | % | |||
| PBC J0919.9+3712 | 2.2 | 16.1 | 0.22 | 0.04 | 88 |
| PBC J1345.4+4141 | 1.7 | 16.8 | 0.13 | 0.02 | 85 |
| PBC J1546.5+6931 | 3.6 | 14.8 | 0.18 | -0.27 | 30 |
NOTES: Col. (1): object name. Col. (2): mass-weighted age of the young and old stellar component. Col. (3): mass-weighted metallicity of the young and old stellar component. Col. (4): percentage of the total mass ascribed to the old stellar population.
The large majority of the sample galaxies are characterized by a slightly supersolar mass-weighted metallicity (Figure 6, right panel). The number distribution has a median value of [] and spreads from super ([]) to sub-solar values ([]). However, it should be noted that the fit used several different metallicities for the SSP, suggesting the possible existence of more metallicity components. Even when considering two distinct stellar populations for PBC J0919.9+3712, PBC J1345.4+4141, and PBC J1546.5+6931 the values of the metallicity remain inside this range (Table 3). Once again, this is consistent with the analysis done by Chen et al. (2009) and La Mura et al. (2012) who claimed increasing metallicity going from starburst towards Seyferts and LINERs.
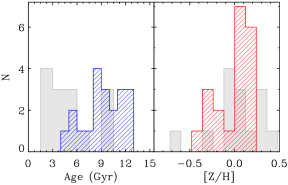
As a further step, we converted the mass-weighted ages and metallicities to the corresponding luminosity-weighted values. To perform the conversion, we adopted the ratios tabulated for the SDSS filter by Maraston (2005). As we expected, the luminosity-weighted ages are slightly younger than the mass-weighted ones, but they remain, with few exceptions, globally old spanning the range between 6 and 12 Gyr. In Figure 7 we plotted the histogram of the luminosity-weighted ages compared to the one derived for the high surface brightness (HSB) sample in Morelli et al. (2008), characterized by a similar morphological type distribution.
Even though the number of galaxies in our sample does not allow us to trace a firm statistical conclusion, it is interesting to note that the bulges in our sample are globally older than those hosted in normal spirals. The metallicity of the bulges of LSB discs spans a large range of values from high ([] dex) to sub-solar ([] dex) with a peak around slightly super-solar values (Figure 7, right panel). The distribution of the metallicity in the galaxy sample is, instead, similar to the one derived for the bulges of HSB galaxies (Morelli et al., 2008).
We performed an additional analysis looking for a possible correlation between the mass-weighted ages and metallicities and the morphological type of our galaxies. Cid Fernandes et al. (2004) did not find any relevant correlation between the host morphology and the stellar population in the nuclear region of Sy2s, but in the case of non active galaxies the situation is less clear. Studying a sample of spiral galaxies, Thomas & Davies (2006) and Morelli et al. (2012) did not observe any correlation between the age and metallicity of the stellar population in the central region of the bulge and galaxy morphology, whereas Ganda et al. (2007) and Morelli et al. (2008) found a mild correlation, with the early-type galaxies () being older and more metal rich than spirals (). The galaxies in our sample span a large range of values of T type () homogeneously distributed without any decreasing trend in number going from the early to the late type as observed in the Storchi-Bergmann et al. (2001) sample.
We did not observe any relevant trend between the galaxy morphological type and the age or metallicity of our galaxies (Figure 8). It is tempting to say that the AGN feedback is, in some way, acting homogenizing the stellar populations in the central (few kpc) region of galaxies with different morphological type. However, the low number of galaxies with and the shallow relation between morphology and stellar populations obtained even considering non active galaxies prevented us from claiming any strong conclusion on this aspect.

5 Summary and Conclusions
In the last years our collaboration unveiled the nature of more than 250 X-ray emitting sources, 158 of which were identified as AGNs. In this paper we presented the stellar population analysis of the host galaxy which was performed on a carefully selected sample of 20 objects with the goal to contribute to understand the still debated connection between the central AGN and the properties of the host galaxy, as well as the effect of the AGN feedback. The detailed analysis of the stellar population can give further important constraints on this topic.
The area on which we were measuring the galaxy properties ranges from 200 pc to 2 kpc allowing us to measure the stellar populations of the bulge close to the center of the galaxy where the effects of the AGN feedback on the host are expected to be relevant.
The spectral fitting method, based on PPXF and GANDALF, was applied to the galaxy spectra to measure the stellar populations properties of the sample. In particular, we obtained for each galaxy a mass-weighted age and a mass-weighted metallicity. The values of the mass-weighted metallicity span the range [] with a median value of []. The large majority of our objects (19 galaxies out of 20, i.e. 95%) show an old stellar population, with ages older than 8 Gyrs. Three of them are characterized by a bimodal distribution with a non negligible contribution from young stars. In detail, we found that PBC J1546.5+6931 is dominated by a young stellar population accounting for % of the total mass, while, in the case of PBC J0919.9+3712 and PBC J1345.4+4141, the young stellar component is less massive than the old one. For the former galaxy the nature of the young stellar component is probably related to the formation and evolution of the galaxy itself. Regarding the latter galaxies there would be a possible starforming activity in their central region.
Even investigating the luminosity-weighted ages for the galaxies in our sample the old nature of their stellar population is confirmed. The comparison of their ages with those obtained for a similar sample in terms of morphological type showed that bulges hosted in AGN are globally older than those hosted in non active counterparts. However, it should be noted that, as expected, the contribution of the young component to the total light of the galaxy is greater than the one to the total mass.
Our results suggest that AGN feedback acts on the first kpc of the galaxy, decreasing the efficiency of the star formation, trough different processes.
The combination of truncation and suppression (Schawinski et al., 2009) could be responsible for disrupting the gas starforming reservoir (Davis et al., 2012) in early times, when the gas is wiped out from the strong AGN emission in the center (Di Matteo et al., 2005; Springel et al., 2005; Fontanot et al., 2011), and in the recent times, the phase of the AGN regulates and quenches the residual star formation of the host galaxy (Sturm et al., 2011) maintaining the global red color and old stellar populations observed also in this work.
Radiative feedback and cooling flow of gas to the center could also, as proposed by Ciotti et al. (2010) and Novak et al. (2011), exhaust the gas in the few central kpcs region of the galaxy and decrease the star formation, with the final consequence that the bulk of the observed stellar populations in this region is, with very few exceptions, old.
These scenarios are indirectly supported by the lack of relations between the stellar population properties and the morphological ones, in the sense that in the central region the existence of an AGN influences the properties of the galaxy much more than the formation and evolution, described by the morphological type, itself.
Acknowledgements.
We thank Valentin Ivanov and Lodovico Coccato for useful discussions. LM acknowledges financial support from Padua University grant CPS0204. LM and VC acknowledge the Universidad Andrés Bello in Santiago del Chile for hospitality while this paper was in progress. PP is supported by the INTEGRAL ASI-INAF grant No. 033/1070. NM acknowledges the Pontificia Universidad Católica de Chile for hospitality while this paper was in progress. DM and GG are supported by the Basal CATA Center for Astrophysics and Associated Technologies PFB-06. GG is supported by fondecyt grant 1120195.References
- Adelman-McCarthy et al. (2008) Adelman-McCarthy, J. K., Agüeros, M. A., Allam, S. S., et al. 2008, ApJS, 175, 297
- Adelman-McCarthy et al. (2006) Adelman-McCarthy, J. K., Agüeros, M. A., Allam, S. S., et al. 2006, ApJS, 162, 38
- Barthelmy (2004) Barthelmy, S. D. 2004, in Society of Photo-Optical Instrumentation Engineers (SPIE) Conference Series, Vol. 5165, Society of Photo-Optical Instrumentation Engineers (SPIE) Conference Series, ed. K. A. Flanagan & O. H. W. Siegmund, 175–189
- Beifiori et al. (2011) Beifiori, A., Maraston, C., Thomas, D., & Johansson, J. 2011, A&A, 531, A109
- Bird et al. (2010) Bird, A. J., Bazzano, A., Bassani, L., et al. 2010, ApJS, 186, 1
- Bluck et al. (2011) Bluck, A. F. L., Conselice, C. J., Almaini, O., et al. 2011, MNRAS, 410, 1174
- Cappellari & Emsellem (2004) Cappellari, M. & Emsellem, E. 2004, PASP, 116, 138
- Chen et al. (2009) Chen, X. Y., Liang, Y. C., Hammer, F., Zhao, Y. H., & Zhong, G. H. 2009, A&A, 495, 457
- Cid Fernandes et al. (2005) Cid Fernandes, R., González Delgado, R. M., Storchi-Bergmann, T., Martins, L. P., & Schmitt, H. 2005, MNRAS, 356, 270
- Cid Fernandes et al. (2004) Cid Fernandes, R., Gu, Q., Melnick, J., et al. 2004, MNRAS, 355, 273
- Ciotti et al. (2010) Ciotti, L., Ostriker, J. P., & Proga, D. 2010, ApJ, 717, 708
- Cracco et al. (2011) Cracco, V., Ciroi, S., di Mille, F., et al. 2011, MNRAS, 418, 2630
- Cusumano et al. (2010) Cusumano, G., La Parola, V., Segreto, A., et al. 2010, A&A, 524, A64
- Davies et al. (2007) Davies, R. I., Müller Sánchez, F., Genzel, R., et al. 2007, ApJ, 671, 1388
- Davis et al. (2012) Davis, T. A., Krajnović, D., McDermid, R. M., et al. 2012, MNRAS, 426, 1574
- de Vaucouleurs et al. (1991) de Vaucouleurs, G., de Vaucouleurs, A., Corwin, H. G., et al. 1991, Third Reference Catalogue of Bright Galaxies, Berlin, Springer (RC3)
- Di Matteo et al. (2005) Di Matteo, T., Springel, V., & Hernquist, L. 2005, Nature, 433, 604
- Draper & Ballantyne (2011) Draper, A. R. & Ballantyne, D. R. 2011, ApJ, 740, 57
- Faber et al. (2007) Faber, S. M., Willmer, C. N. A., Wolf, C., et al. 2007, ApJ, 665, 265
- Feruglio et al. (2010) Feruglio, C., Maiolino, R., Piconcelli, E., et al. 2010, A&A, 518, L155
- Fontanot et al. (2011) Fontanot, F., Pasquali, A., De Lucia, G., et al. 2011, MNRAS, 413, 957
- Ganda et al. (2007) Ganda, K., Peletier, R. F., McDermid, R. M., et al. 2007, MNRAS, 380, 506
- Gehrels et al. (2004) Gehrels, N., Chincarini, G., Giommi, P., et al. 2004, ApJ, 611, 1005
- González Delgado et al. (2001) González Delgado, R. M., Heckman, T., & Leitherer, C. 2001, ApJ, 546, 845
- Ho et al. (2003) Ho, L. C., Filippenko, A. V., & Sargent, W. L. W. 2003, ApJ, 583, 159
- Hopkins & Hernquist (2006) Hopkins, P. F. & Hernquist, L. 2006, ApJS, 166, 1
- Ivanov et al. (2000) Ivanov, V. D., Rieke, G. H., Groppi, C. E., et al. 2000, ApJ, 545, 190
- Joguet et al. (2001) Joguet, B., Kunth, D., Melnick, J., Terlevich, R., & Terlevich, E. 2001, A&A, 380, 19
- Jones et al. (2004) Jones, D. H., Saunders, W., Colless, M., et al. 2004, MNRAS, 355, 747
- La Mura et al. (2012) La Mura, G., Bindoni, D., Ciroi, S., et al. 2012, MNRAS, 426, 1893
- La Mura et al. (2009) La Mura, G., Di Mille, F., Ciroi, S., Popović, L. Č., & Rafanelli, P. 2009, ApJ, 693, 1437
- Landi et al. (2007) Landi, R., Masetti, N., Morelli, L., et al. 2007, ApJ, 669, 109
- Lawrence et al. (1987) Lawrence, A., Watson, M. G., Pounds, K. A., & Elvis, M. 1987, Nature, 325, 694
- Maiorano et al. (2011) Maiorano, E., Landi, R., Stephen, J. B., et al. 2011, MNRAS, 416, 531
- Mannucci et al. (2010) Mannucci, F., Cresci, G., Maiolino, R., Marconi, A., & Gnerucci, A. 2010, MNRAS, 408, 2115
- Maraston (2005) Maraston, C. 2005, MNRAS, 362, 799
- Masetti et al. (2006a) Masetti, N., Bassani, L., Bazzano, A., et al. 2006a, A&A, 455, 11
- Masetti et al. (2006b) Masetti, N., Mason, E., Bassani, L., et al. 2006b, A&A, 448, 547
- Masetti et al. (2008) Masetti, N., Mason, E., Morelli, L., et al. 2008, A&A, 482, 113
- Masetti et al. (2006c) Masetti, N., Morelli, L., Palazzi, E., et al. 2006c, A&A, 459, 21
- Masetti et al. (2004) Masetti, N., Palazzi, E., Bassani, L., Malizia, A., & Stephen, J. B. 2004, A&A, 426, L41
- Masetti et al. (2012) Masetti, N., Parisi, P., Jiménez-Bailón, E., et al. 2012, A&A, 538, A123
- Masetti et al. (2010) Masetti, N., Parisi, P., Palazzi, E., et al. 2010, A&A, 519, A96
- Masetti et al. (2009) Masetti, N., Parisi, P., Palazzi, E., et al. 2009, A&A, 495, 121
- Masetti et al. (2006d) Masetti, N., Pretorius, M. L., Palazzi, E., et al. 2006d, A&A, 449, 1139
- McKernan et al. (2010) McKernan, B., Ford, K. E. S., & Reynolds, C. S. 2010, MNRAS, 407, 2399
- Morelli et al. (2012) Morelli, L., Corsini, E. M., Pizzella, A., et al. 2012, MNRAS, 423, 962
- Morelli et al. (2008) Morelli, L., Pompei, E., Pizzella, A., et al. 2008, MNRAS, 389, 341
- Novak et al. (2011) Novak, G. S., Ostriker, J. P., & Ciotti, L. 2011, ApJ, 737, 26
- Onodera et al. (2012) Onodera, M., Renzini, A., Carollo, M., et al. 2012, ApJ, 755, 26
- Parisi et al. (2009) Parisi, P., Masetti, N., Jiménez-Bailón, E., et al. 2009, A&A, 507, 1345
- Parisi et al. (2012) Parisi, P., Masetti, N., Jiménez-Bailón, E., et al. 2012, A&A, 545, A101
- Paturel et al. (2003) Paturel, G., Petit, C., Prugniel, P., et al. 2003, A&A, 412, 45
- Press et al. (1992) Press, W. H., Teukolsky, S. A., Vetterling, W. T., & Flannery, B. P. 1992, Numerical recipes in FORTRAN. The art of scientific computing (Cambridge: University Press, —c1992, 2nd ed.)
- Rigopoulou et al. (2009) Rigopoulou, D., Mainieri, V., Almaini, O., et al. 2009, MNRAS, 400, 1199
- Salpeter (1955) Salpeter, E. E. 1955, ApJ, 121, 161
- Sánchez-Blázquez et al. (2006) Sánchez-Blázquez, P., Peletier, R. F., Jiménez-Vicente, J., et al. 2006, MNRAS, 371, 703
- Sarzi et al. (2006) Sarzi, M., Falcón-Barroso, J., Davies, R. L., et al. 2006, MNRAS, 366, 1151
- Sarzi et al. (2005) Sarzi, M., Rix, H.-W., Shields, J. C., et al. 2005, ApJ, 628, 169
- Schawinski et al. (2009) Schawinski, K., Lintott, C. J., Thomas, D., et al. 2009, ApJ, 690, 1672
- Schawinski et al. (2007) Schawinski, K., Thomas, D., Sarzi, M., et al. 2007, MNRAS, 382, 1415
- Springel et al. (2005) Springel, V., Di Matteo, T., & Hernquist, L. 2005, MNRAS, 361, 776
- Stephen et al. (2006) Stephen, J. B., Bassani, L., Malizia, A., et al. 2006, A&A, 445, 869
- Storchi-Bergmann et al. (2001) Storchi-Bergmann, T., González Delgado, R. M., Schmitt, H. R., Cid Fernandes, R., & Heckman, T. 2001, ApJ, 559, 147
- Sturm et al. (2011) Sturm, E., González-Alfonso, E., Veilleux, S., et al. 2011, ApJ, 733, L16
- Thomas & Davies (2006) Thomas, D. & Davies, R. L. 2006, MNRAS, 366, 510
- Tremonti et al. (2007) Tremonti, C. A., Moustakas, J., & Diamond-Stanic, A. M. 2007, ApJ, 663, L77
- Ubertini et al. (2003) Ubertini, P., Lebrun, F., Di Cocco, G., et al. 2003, A&A, 411, L131
- Vaona et al. (2012) Vaona, L., Ciroi, S., Di Mille, F., et al. 2012, MNRAS, 427, 1266
- Vazdekis et al. (2010) Vazdekis, A., Sánchez-Blázquez, P., Falcón-Barroso, J., et al. 2010, MNRAS, 404, 1639
- Winkler et al. (2003) Winkler, C., Courvoisier, T. J.-L., Di Cocco, G., et al. 2003, A&A, 411, L1