PTF 12gzk - A Rapidly Declining, High-Velocity Type Ic Radio Supernova
Abstract
Only a few cases of type Ic supernovae (SNe) with high-velocity ejecta have been discovered and studied. Here we present our analysis of radio and X-ray observations of a Type Ic SN, PTF 12gzk. The radio emission rapidly declined less than 10 days after explosion, suggesting SN ejecta expanding at high velocity (). The radio data also indicate that the density of the circumstellar material (CSM) around the supernova is lower by a factor of than the CSM around normal Type Ic SNe. Our observations of this rapidly declining radio SN at a distance of Mpc demonstrates the potential to detect many additional radio SNe, given the new capabilities of the VLA (improved sensitivity and dynamic scheduling), that are currently missed, leading to a biased view of radio SNe Ic. Early optical discovery followed by rapid radio observations would provide a full description of the ejecta velocity distribution and CSM densities around stripped massive star explosions, as well as strong clues about the nature of their progenitor stars.
1. Introduction
There are two diagnostics provided by radio emission from supernovae. First, radio (and X-ray) emission is generated as fast-moving ejecta collide with the circumstellar medium (CSM; Chevalier 1982; Chevalier 1998; Weiler et al. 2002; Chevalier & Fransson 2006). Thus radio and X-ray observations can be used to measure the density of optically thin CSM. Next, radio and X-ray emission can be used to trace the fastest moving ejecta. In contrast, the optical emission is reflective of the bulk of the ejecta, where the optical depth to visible-light photons is determined, which is necessarily of lower velocity. From measuring the run of the density one can infer the ratio of the mass loss rate to the escape velocity (wind velocity) of the progenitor star – the mass loading parameter. Radio observations are in good accord with the picture that Type Ib/Ic supernovae arise from stripped massive star progenitors.
Both these diagnostics came to the fore for supernovae associated with Gamma Ray Bursts (GRBs). The first example was SN 1998bw (a broad-lined Type Ic; Ic-BL), associated with the nearby, low-luminosity gamma-ray burst GRB 980425 (Galama et al. 1998). Radio observations established that the fastest moving ejecta were mildly relativistic and carried a significant amount of the explosion energy (Kulkarni et al. 1998). The same approach showed that SN 2009bb (Type Ic-BL) also had mildly relativistic ejecta and it has been reasonably argued that either SN 2009bb did not produce gamma-rays or that the associated GRB was likely not pointed towards us (or we missed detecting the gamma-rays; Soderberg et al. 2010). It is worth noting that in both cases the optical line features were very broad, i.e., . This discussion naturally raises the issue whether there exists supernovae which are intermediate (in the above two senses) between ordinary Ib/Ic supernovae and SN 1998bw and SN 2009bb.
Here, we report on radio observations of PTF 12gzk, a Type Ic supernova which showed high-velocity optical features and a luminous optical emission (indicative of large radioactive 56Ni yield), but without detection of gamma-ray emission. PTF 12gzk turned out to be a fast-evolving radio SN, but with a lower shockwave velocity (inferred from the radio emission) and energy than SN 2009bb. At the same time, the velocities inferred from the optical spectra resemble those of SN 1998bw and SN 2009bb. This raises the possibility that PTF 12gzk is an intermediate object, connecting normal SNe Ic with GRB-SNe (as discussed above).
In we describe our observation and analyze them in . We then discuss the nature of PTF 12gzk in . We summarize our results and discuss their implications on future studies in .
2. Multi-wavelength Observations
2.1. The Optical Discovery of PTF 12gzk
The Palomar Transient Factory (PTF; Law et al. 2009; Rau et al. 2009) discovered a peculiar SN Ic, PTF 12gzk (Ben-Ami et al. 2012a), as reported in in Ben-Ami et al. (2012b). In short, PTF 12gzk was discovered on 2012 July 24 UTC in the galaxy SDSS J221241.53+003042.7, Mpc away (). The SN was not detected in previous images taken by PTF on July 19, down to a limiting magnitude of 20.6 mag. The SN was detected at a magnitude of mag in band and reached a peak magnitude of mag () on August 7, 2012. Based on the optical rise time Ben-Ami et al. (2012b) estimate the explosion time to be 2012 Jul 24.0 d. Followup optical data suggest that PTF 12gzk is a peculiar Type Ic supernova, with high expansion velocities, long rise time and a large radioactive 56Ni mass, pointing towards an energetic explosion. PTF follow-up programs were rapidly triggered (Gal-Yam et al. 2011) including the Swift satellite, the Very Large Array (VLA), and the Combined Array for Research in Millimeter-wave Astronomy (CARMA) to observe PTF 12gzk in X-ray, cm-wavelength, and mm-wavelength, respectively. Additional follow-up observations and analysis (including HST UV spectroscopy) are presented in Ben-ami et al. 2013 (in preparation).
2.2. Radio Observations
We observed PTF 12gzk using VLA111VLA program 12A-363 (PI Horesh) on UTC 2012 August 1. The observation was undertaken in C (6 GHz) band using a 2 GHz bandwidth. The VLA configuration at that time was the B configuration. In our observation we used J as a phase calibrator and 3C48 as a flux calibrator. The data were reduced using the AIPS222http://www.aips.nrao.edu software.
We detect a source with a flux of Jy at the position , consistent with the optical position of the SN within . The radio luminosity is thus erg s-1 Hz-1. Splitting the data into two sub-band frequencies we measured a flux of Jy and Jy at GHz and GHz, respectively, implying a spectrum with a power-low index of .
Further VLA observations were performed on UT 2012 August 3, using C, Ku (14 GHz), and K (20 GHz) bands and on UT 2012 August 5 using C band. We do not detect the supernova () in both the second and third epochs in all bands.
On UT 2012 August 03, we also observed PTF 12gzk with CARMA at a frequency of 95 GHz. The observation was performed in E array and 3C446 was used as the phase calibrator. The data were reduced using the MIRIAD software. The SN was not detected with a upper limit of 3.6 mJy. The log of the cm- and mm-wavelength observations can be found in Table 1.
| Day | Frequency | Flux | Observatory |
| [GHz] | [Jy] | ||
| 1.42 | 4.8 | VLA | |
| 1.42 | 7.4 | VLA | |
| 3.33 | 6.1 | VLA | |
| 3.33 | 14 | VLA | |
| 3.33 | 20 | VLA | |
| 3.34 | 95 | CARMA | |
| 5.55 | 6.1 | VLA |
Notes - Day is given in UT days in 2012 August. The error in the flux is the rms error measured in each image. Upper limits are limits.
2.3. X-ray Observation
PTF 12gzk was observed by the X-Ray Telescope (XRT; Burrows et al. 2005) and the ultraviolet imaging telescope (UVOT; Roming et al. 2005) on the Swift satellite. XRT measurements, beginning at 13:39 UT on July 31, detected no source at the location of PTF 12gzk. We estimate a dead-time-corrected limit on the XRT count rate of ct s-1. Assuming a power-law spectrum with a photon index of 2, this corresponds to a limit on the X-ray flux of erg cm-2 s-1 ( erg s-1).
2.4. A Search for High-energy Emission
We have searched the available public archives for GRBs contemporaneous with PTF 12gzk. Using the inferred constraints on the explosion date from early optical observations (see §2.1), we find no reported GRBs from either the InterPlanetary Network (IPN; Hurley et al. 2010) or the Fermi -ray Burst Monitor (GBM; Meegan et al. 2009). Unlike the GBM, the IPN provides essentially continuous all-sky coverage, to a limiting fluence (10 keV – 5 MeV) of erg cm-2, so we shall adopt this value as a limit on any high-energy emission associated with PTF 12gzk.
The lack of gamma-ray emission from PTF 12gzk therefore suggests that an associated GRB (if one exists) had to be an off-axis event.
3. Shockwave Properties and Energetics
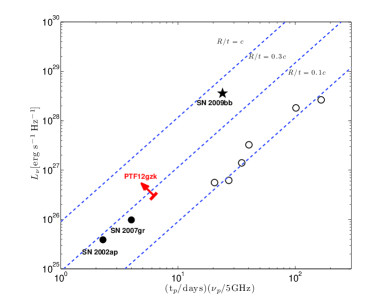
The sparse data prevents us from performing any detailed modeling of PTF 12gzk. However, we can approximate the lower limit on the shockwave radius, and therefore its velocity, using the formulation of Chevalier (1998; Equation 13). Assuming equipartition, (i.e., the fraction of shockwave energy converted to electron acceleration is equal to the fraction of energy converted to a magnetic field), and adopting the lower limit on the peak flux at 5 GHz Jy, yields a lower limit on the shockwave radius of cm. The shockwave radius can be translated into a lower limit on the shockwave velocity, assuming that the time of the peak is days333The limit on the time of the peak is estimated based on the explosion time from Ben-ami et al. (2012b) and the assumption that the emission is already fading on UT 2012 August 1. If the emission was still rising on UT 2012 Aug 1, we should have detected the SN on our second epoch of observation less than two days later. Thus, km s-1. This can also be graphically inferred from the Chevalier luminosity-peak time diagram (Figure 1).
In the same manner, we can approximate the mass-loss rate from the progenitor prior to explosion, using equation 23 from Chevalier & Fransson (2006) and assuming that the CSM around the SN was deposited by a stellar wind with a constant velocity, , and a constant mass-loss rate, . Adopting the value for the fraction of energy of the shockwave that is converted into a magnetic field , we find that the mass-loading parameter defined as is . This is also consistent with the upper limit on the X-ray flux, assuming that any X-ray emission originates from inverse-Compton (see Chevlaier & Fransson 2006; Soderberg et al. 2012; Horesh et al. 2012).
We note that in our analysis so far we have assumed equipartition (). However, as previous studies show, equipartition is not necessarily the case (Soderberg et al. 2012; Horesh et al. 2012). Adopting a more extreme value of (motivated by the result of Horesh et al. 2012) lowers the lower limit on the shockwave velocity to km s-1 () .
At this point we also would like to note that the change in radio flux between the first and second epochs is significantly larger than would be predicted by a decay (for a shockwave with a constant velocity and electron energy power-law index of ). However, the flux that we measure may be effected by interstellar scattering and scintillation (ISS) and therefore may be intrinsically lower.
Taking into account the ISS modulation index, the intrinsic flux of PTF 12gzk can be as low as Jy. In this case the shockwave velocity lower limit reduces from km s-1 to km s-1. Moreover, the difference between the observed reduced flux on the first epoch and the flux limit on the second epoch, is consistant (within the errors) with the expected change in the Chevalier (1998) synchrotron emission model.
We find that the internal minimum energy of the emitting material is erg (See equation in Horesh et al. 2012). The energy of an ejecta velocity component in a pure explosion is given by
| (1) |
where is the maximum velocity of the ejecta and is the energy carried by it. Considering a radiative progenitor star (polytropic index of ), i.e., a Wolf-Rayet (WR) or a blue supergiant (BSG) star, and substituting the equations of Matzner & Mckee (1999)444Equations 32 & 37 in Matzner & Mckee (1999) for and (see also Nakar & Sari 2010 for the normalizations that are used here) into the above equation, the energy555This is the energy of the fast-moving ejecta originating from the outer layer of the progenitor star, in contrast to the energy carried by the bulk ejecta that originates from the inner parts of the star. can be now expressed as
| (2) | |||||
Plugging our velocity lower limit, km s-1, into the above equation and adopting the ejecta mass and explosion energy values from Ben-Ami et al. (2012b) ( and erg) yields erg. Therefore, there is more than enough energy in the ejecta to account for the shockwave minimum energy that we measure.
4. Comparison with a Sample of Radio-detected SNe Ib/c
The two most comparable SNe Ic that also exhibit high shockwave velocities, but are not relativistic, are SN 2002ap (Berger et al. 2002) and SN 2007gr (Soderberg et al. 2010). Both of these sources are believed to be ordinary core-collapse explosions (cf., Paragi et al. 2010). Both SNe had radio emission that evolved relatively fast, with SN 2002ap peaking at days (4.86 GHz) and SN 2007gr peaking at days (8.46 GHz), after explosion. The radio analysis by both Berger et al. (2002) and Soderberg et al. (2010) suggest shockwave velocities of . For PTF 12gzk, as seen in Figure 1, the lower limit is about , similar to the velocities of SN 2002ap and SN 2007gr. However, the two latter SNe had fainter radio luminosities by factors of and compared with PTF 12gzk, respectively. The brighter radio emission from PTF 12gzk may suggest that the shockwave velocity is even higher in this case.
The optical spectra of SN 2002ap, SN 2007gr and PTF 12gzk show significant difference. The spectra of SN 2002ap (Type Ic-BL) exhibit broad lines formed by emission from ejecta with a broad range of velocities. The velocity of the line centers suggests a bulk velocity of km s-1 7 days prior to optical peak (B-band) that decreased to km s-1 at peak (Gal-Yam, Ofek & Shemmer 2002). In the case of SN 2007gr (normal Ic), there are no broad lines and the absorption line blueshifts suggest a velocity of less than 13,000 km s-1 (Hunter et al. 2009). PTF 12gzk, in contrast, does not show broad lines666PTF 12gzk has narrow lines with a dispersion lower by a factor of compared to broad-lined SNe Ic (see Ben-Ami et al. 2012b for details). as does SN 2002ap, but based on line blueshifts, it does exhibit high expansion velocities of km s-1, a factor of higher than the velocity of SN 2007gr. This higher velocity is consistent with our inference that the shock velocity traced by the radio observations is larger than .
Another property that PTF 12gzk has in common with SN 2002ap and SN 2007gr is the inferred mass-loading parameter of the SN progenitor. In Table 2 we list the normalized mass-loading parameter, , values of these three SNe and a few other Ib/c SNe, where . PTF 12gzk, SN 2002ap and SN 2007gr all have values which are at least a factor of lower than the values for the rest of the listed SNe. This is an interesting clue worthy of further investigation, that may suggest more compact progenitors for these objects, driving faster winds.
| SN | Type | Velocity (optical) | A⋆ |
|---|---|---|---|
| km s-1 | |||
| 1983N | Ib | 18,200 | 1.15 |
| 1990B | Ic | 17,700 | 2.0 |
| 1994I | Ic | 17,500 | 2.8 |
| 2003L | Ic | 12,000 | 34 |
| 2002ap | Ic-BL | 38,000 | 0.04 |
| 2007gr | Ic | 13,000 | 0.06 |
| PTF 12gzk | Ic | 35,000 |
Notes - The optical velocities are taken from Wheeler & Harkness (1990), Matheson et al. (2001), Millard et al. (1999), Matheson et al. (2003), Gal-Yam, Ofek, & Shemmer (2002), Hunter et al. (2009) and Ben-Ami et al. (2012), respectively. The values are from Chevalier & Fransson (2006) when equipartition is assumed and we adopt the value of .
5. Summary and Future Implications
We observed PTF 12gzk in mm-, cm-wavelength and X-rays, starting eight days after explosion. Our radio observations reveal a rapidly declining emission that can be explained by a very fast km s-1 shockwave ploughing through an optically thin CSM, that was deposited by a stellar wind, prior to the explosion. We also calculate the limit on the mass-loading parameter , which is consistent with our X-ray observations. Observations of PTF 12gzk can be explained by an ordinary pure explosion supernova, and do not require an engine-driven event. However, its inferred high-velocity shockwave (based on our radio analysis) together with the high velocity of the bulk of the ejecta (based on the optical spectra; Ben-Ami et al. 2012), may indicate that it is an intermediate event between a “normal” SN Ic and a GRB-SN like event.
The fraction of rapidly declining (peak emission at 5 GHz in less than 10 days) radio SNe Ic is not well constrained. While the discovery rate of SNe Ic by PTF is per year on average, many of these past events were discovered many days after explosion. Recently, PTF has adopted a higher survey cadence that enables the discovery of SNe within one day of explosion. Figure 1 in Soderberg et al. (2010) reveals that most of the radio observations of SNe Ic took place at late times. Therefore, most rapidly declining events like PTF 12gzk would have been missed by current observing strategies. Thus, it is possible that the average shockwave velocities of observed in normal SNe Ic may not represent the average velocity of the general SN Ic population.
The more improved sensitivity of the VLA offers the opportunity to detect radio emission from high-velocity SNe Ic out to larger distances. Past studies probed only nearby ( Mpc) rapidly evolving SNe Ic such as SN 2007gr and SN 2002ap, due to limited sensitivity. Given an rms of Jy in C band, the detection horizon for SNe Ic with a shockwave velocity of and with an value similar to that of PTF 12gzk, is Mpc, and Mpc even for SNe with an value lower by a factor of than the one of PTF 12gzk. Relativistic events, such as SN 2009bb, will be detectable out to a distance of Mpc, if they will have an value similar to that of PTF 12gzk or even lower.
Another possible strategy to better study rapidly evolving radio SN is to conduct the observations at lower frequencies (e.g., 1.4 GHz). The radio emission at 1.4 GHz for events such as PTF 12gzk, SN 2007gr, and SN 2002ap is expected to peak after more than days after explosion. Therefore, future surveys at low frequencies such as Apertif (Verheijen et al. 2008), and ASKAP (Johnston et al. 2008) have the potential to discover and follow many such SNe.
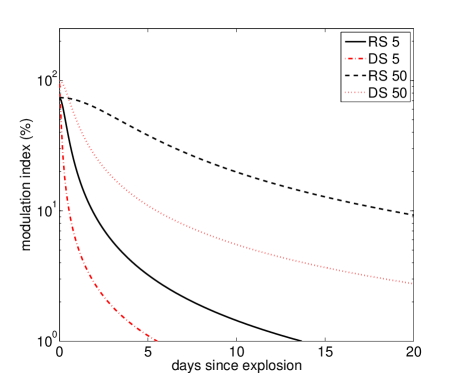
One of the main challenges in studying radio emitting SNe Ic at larger distances by either the VLA or future low-frequency surveys is ISS. As we probe further out, the angular size of the source decreases and therefore the effect of ISS increases. Nature, at this point, is becoming the main source of noise due to ISS. According to Figure 2, a SN-CSM shockwave, expanding at a velocity of , for example, will still exhibit more than variability due to ISS at a distance of 50 Mpc, after 10 days. At the same time, one can take the approach of undertaking high-frequency (mm-wavelength) observations which are less susceptible to ISS modulation. Since high-frequency emission in PTF 12gzk-like events is expected to peak at day after explosion, this approach will be efective only if immediate observations are initiated after the detection of a SN.
To summarize, it is now clear that there exists a phase space of fast SNe Ic that is still relatively unexplored. The improved capabilities of radio observatories combined with early discoveries by optical transient surveys will allow us to probe this new population of radio SNe. Such studies will provide a better understanding of the properties of the progenitor stars and their explosion energies, complementing previous work based on late-time observations.
Acknowledgments
We thank the VLA, Swift, and CARMA staff for promptly scheduling this target of opportunity. The National Radio Astronomy Observatory is a facility of the National Science Foundation operated under cooperative agreement by Associated Universities, Inc. This work made use of data supplied by the UK Swift Science Data Centre at the University of Leicester. PTF is a fully-automated, wide-field survey aimed at a systematic exploration of explosions and variable phenomena in optical wavelengths. The participating institutions are Caltech, Columbia University, Weizmann Institute of Science, Lawrence Berkeley Laboratory, Oxford and University of California at Berkeley. The program is centered on a 12Kx8K, 7.8 square degree CCD array (CFH12K) re-engineered for the 1.2-m Oschin Telescope at the Palomar Observatory by Caltech Optical Observatories. Photometric follow-up is undertaken by the automated Palomar 1.5-m telescope. The research of A.G. is supported by grants from the ISF, BSF, GIF and Minerva, the EU/FP7 via an ERC grant, and the Kimmel award for innovative investigation.
References
- Ben-Ami et al. (2012) Ben-Ami S., et al., 2012, ApJ, 760, L33
- Ben-Ami et al. (2012) Ben-Ami S., et al., 2012, ATel, 4297, 1
- Berger, Kulkarni, & Chevalier (2002) Berger E., Kulkarni S. R., Chevalier R. A., 2002, ApJ, 577, L5
- Burrows et al. (2005) Burrows D. N., et al., 2005, SSRv, 120, 165
- Chevalier & Soderberg (2010) Chevalier, R. A., & Soderberg, A. M. 2010, ApJ, 711, L40
- Chevalier & Fransson (2006) Chevalier R. A., Fransson C., 2006, ApJ, 651, 381
- Chevalier (1998) Chevalier, R. A. 1998, ApJ, 499, 810
- Chevalier (1982) Chevalier R. A., 1982, ApJ, 259, 302
- Cordes & Lazio (2001) Cordes J. M., Lazio T. J. W., 2001, ApJ, 549, 997
- Frail et al. (2001) Frail D. A., et al., 2001, ApJ, 562, L55
- Gal-Yam, Ofek, & Shemmer (2002) Gal-Yam A., Ofek E. O., Shemmer O., 2002, MNRAS, 332, L73
- Hunter et al. (2009) Hunter D. J., et al., 2009, A&A, 508, 371
- Hurley et al. (2010) Hurley K., et al., 2010, AIPC, 1279, 330
- Johnston et al. (2008) Johnston S., et al., 2008, ExA, 22, 151
- Law et al. (2009) Law, N. M., et al. 2009, PASP, 121, 1395
- Mason et al. (2004) Mason K. O., Breeveld A., Hunsberger S. D., James C., Kennedy T. E., Roming P. W. A., Stock J., 2004, SPIE, 5165, 277
- Matheson et al. (2001) Matheson T., Filippenko A. V., Li W., Leonard D. C., Shields J. C., 2001, AJ, 121, 1648
- Matheson et al. (2003) Matheson T., Challis P., Kirshner R. P., Garnavich P. M., 2003, GCN, 1846, 1
- Matzner & McKee (1999) Matzner C. D., McKee C. F., 1999, ApJ, 510, 379
- Meegan et al. (2009) Meegan C., et al., 2009, ApJ, 702, 791
- Millard et al. (1999) Millard J., et al., 1999, ApJ, 527, 746
- Nakar & Sari (2010) Nakar E., Sari R., 2010, ApJ, 725, 904
- Pian et al. (2000) Pian E., et al., 2000, ApJ, 536, 778
- Soderberg et al. (2010) Soderberg A. M., et al., 2010, Natur, 463, 513
- Soderberg et al. (2010) Soderberg A. M., Brunthaler A., Nakar E., Chevalier R. A., Bietenholz M. F., 2010, ApJ, 725, 922
- Soderberg et al. (2012) Soderberg A. M., et al., 2012, ApJ, 752, 78
- Rau et al. (2009) Rau, A., et al. 2009, PASP, 121, 1334
- Roming et al. (2005) Roming P. W. A., et al., 2005, SSRv, 120, 95
- Verheijen et al. (2008) Verheijen M. A. W., Oosterloo T. A., van Cappellen W. A., Bakker L., Ivashina M. V., van der Hulst J. M., 2008, AIPC, 1035, 265
- Walker (1998) Walker M. A., 1998, MNRAS, 294, 307
- Walker (2001) Walker M. A., 2001, MNRAS, 321, 176
- Weiler et al. (2002) Weiler K. W., Panagia N., Montes M. J., Sramek R. A., 2002, ARA&A, 40, 387
- Wheeler & Harkness (1990) Wheeler J. C., Harkness R. P., 1990, RPPh, 53, 1467