13/12
Using Genetic Programming to Model Software
Abstract
We study a generic program to investigate the scope for automatically customising it for a vital current task, which was not considered when it was first written. In detail, we show genetic programming (GP) can evolve models of aspects of BLAST’s output when it is used to map Solexa Next-Gen DNA sequences to the human genome.
Keywords: 1000 genomes project 1KG, genetic programming, GIP, GISMOE, automatic software re-engineering, SBSE, software modelling, collaborative coevolution, teams of agents, soft memory, bioinformatics, approximate string lookup, sequence alignment, SNP
1 Introduction
Hand made software is expensive. Therefore to make the widest possible use of it we usually try to make programs as generic as possible. Even though a task specific program might be better at that task, it is often too expensive to write bespoke software and the user must make do with the generic program. However if automated software production were to be successful, the balance could turn from single generic programs to multiple bespoke programs, each tailored to a particular task or even tailored to each user.
We study a popular generic program BLAST [Altschul et al. (1997)] to investigate the scope for automatically customising it for a popular current demand, mapping next generation DNA sequences. BLAST is too generic, too slow to be used with Next-Gen sequences. Indeed they were unknown when it was first written. Yet matching them against the human genome is a vital component of an increasingly important part of modern biology and doubtless this will also shortly play a vital role in medicine. If it was practical, BLAST would be the tool of choice for Next-Gen sequence alignments. However it is far too slow to cope with the hundreds of millions of DNA sequences generated by current, let alone future, sequencing machines. Instead new hand made programs are used. The new software re-uses ideas from BLAST (e.g. string hashing and partial matches) but sometimes also includes newer ideas (e.g. data compression algorithms [Langmead and Salzberg (2012), (15), Langdon (2013)]). Also often the new performance comes at the price of losing some functionality [Langmead et al. (2009)]. In the future both combining existing code in new ways and performance tradeoffs may be within the scope of software optimisation techniques. In detail, we show genetic programming (GP) can model aspects of BLAST’s output which are specific to Solexa Next-Gen DNA sequences and the human genome.
BLAST is perhaps the most important Bioinformatics tool [Karplus et al. (1998), p848]111Google Scholar says BLAST had been cited more than 47 000 times and it is top of the Nucleic Acids Research journal’s (1 June 2013) list of most cited articles.. Originally designed to find optimal matches between protein and amino acid sequences, it and its variants are now widely used for many kinds of sequence comparison, in particular for DNA sequences. With the advent of the sequencing of the human genome and next generation sequencing the demands of sequence matching have changed enormously since BLAST was written. With this in mind we have been investigating to what extent it might be possible to automatically re-engineer a bespoke version for BLAST for Next-Gen DNA sequence look up. We are somewhat short of our goal of having evolutionary computing rebuild a version BLAST which is more efficient at aligning next generation DNA sequence with the human genome. However there are certain aspects of the input data which are critical to BLAST’s performance which we have been able to model with genetic programming. These include: the quality and length of the match found and indeed the number of matches found or even if the DNA sequence does not occur in the human genome.
In the next section we briefly summarise BLAST and related programs, including important properties that influence run time. Then in Section 3 we will describe the source of the training and verification data. (All of these data are available online, e.g. via ftp.1000genomes.ebi.ac.uk.) Section 5 shows it is possible (using genetic programming, Section 4) to estimate in advance important properties of the BLAST’s output. Although GP has been used many times before this is the first time it has been used to model a substantial man made software tool like BLAST222BLAST contains about 20 000 lines of C++. as part of plan to reverse engineer it.
2 Background
In June 2013 Wikipedia listed more than 140 Bioinformatics tools which perform some aspect of string analysis either on protein databases or DNA sequences. This represents a huge investment in manual labour. Many of these tools can be regarded as finding a specific trade-off between performance (typically in terms of accuracy and number of matches found) and non-functional requirements (typically speed, or speed and memory requirements). As part of the GISMOE program [Langdon (2012), Harman et al. (2012)] [(7), Petke et al. (2013), Langdon and Harman (2010), Langdon (2013), (15)] to mechanise aspects of software production we are investigating to what extent these trade-offs can be automated.
The performance of many sequencing tools is dominated by the length and number of exact matches. Run time can grow rapidly, e.g. O(), with number of matches () [(15)]. Hash techniques allow exact matches to be found very quickly but approximate matches are time consuming. Therefore we investigated if GP could say in advance if a look up is likely to match exactly and with what length of match and if multiple matches would be encountered. In sequence alignment multiple matches are less useful but are very time consuming, thus (since they have redundant data) biologists often ignore such sequences [Cheung et al. (2011), page 1].
Where redundant data are available, if we could identify high quality matches (cf. E value, Section 4.1) in advance it would make sense to use them first. Also if we suspect a sequence will not match it can be given a lower priority. Similarly if it occurs more than once in the human genome the problem of deciding how to resolve this ambiguity can be delayed until after more promising sequences have been tried. Finally perfect match “seeds” are critical components of sequence look up. Knowing in advance how long an exactly matching region is likely to be would make hash based search more efficient.
Although we model BLAST, since it incorporates many Biological sequencing heuristics and is widely used, it has become the de facto standard for sequence matching which other tools seek to emulate. Thus a model of BLAST is also a model of the desired output of other (more modern) sequence look up tools. However although GP models are fast enough to make prioritisation of DNA sequence matching feasible, BLAST itself is still not competitive with more modern tools specifically designed for Next-Gen sequences.
3 Training Data – NCBI Human Genome, BLAST and the 1000 Genomes Project
We used the official USA’s National Center for Biotechnology Information (NCBI) release of the reference human genome. (Release 37 patch 5, GRCh37.p5, was down loaded via update_blastdb.pl from http://www.ncbi.nlm.nih.gov/blast/docs.) Similarly we used the official NCBI 64 bit Linux version of BLAST (version 2.2.25+ was downloaded via ftp://ftp.ncbi.nlm.nih.gov/blast/executables/blast+/)
The 1000 genomes project [Durbin, et al. (2010)] is a consortium in which DNA from more than one thousand individuals has been sequenced by several institutions using a variety of scanners. To avoid unknown data inconsistencies during training we decided to concentrate upon a single scanner used by one laboratory. Similarly we wanted to minimise true biological variation and concentrated upon the software technology. Therefore we chose one well studied family and the Solexa data provided by the Broad Institute, Cambridge, MA. This gives a large pool of homogeneous data. The Solexa data includes sequences of a number of lengths (from 25 to 489 DNA bases) and so we further limited ourselves to all the Solexa data with exactly 36 DNA bases per sequence. These sequences are “single ended” and give “high coverage”. We initially trained our GP using data from 11 different Solexa-3623 scans of the same female (NA12878) from Utah (a total of 89 087 344 DNA sequences).
The Solexa data quality is highly variable. In addition to its quality indicators, the Solexa data use “N” to indicate a DNA base which it cannot decide which of the four bases (A, C, G, T) it really is. In one dataset less than 1 in a thousand sequences has an N. In the worst training dataset (SRR001752), every record had at least one (typically two or three). We selected data from the best, the worst and an intermediate dataset for training.
4 Genetic Programming
This section describes in sufficient detail to allow reproduction of our results the genetic programming system we used. Section 5 (page 5) describes the models it evolved, their performance and also explores how they work.
4.1 Preparing the Training Data
Solexa scanners optically read DNA sequences from 60 or more square tiles. It has been suggested that data quality may be worse near the borders of the tiles. However we do not see this effect. Nevertheless for each of the three training datasets, we selected sequences in narrow (11 pixels wide) vertical and horizontal (10 pixels) strips crossing the whole of a tile (at pixel 511,779) (Tile 119 was randomly selected for two scanner runs but proved to give a small data sample in the third case, so tile 78 was randomly chosen for the last set of NA12878 training data.) This gave 606, 565 and 1186 (total 2357) DNA sequences each with 36 bases for training.
In addition to BLAST’s default parameters, we used -task blastn-short and -num_threads 6, as it looked up each DNA sequence in the NCBI reference human genome. (Using 6 threads BLAST took approximately 7 hours on a 32GB 8 CPU 3GHz Intel server to process the 2357 sequences. The GP runs used a single CPU each.) In total for the 2357 queries BLAST generated 14.5 gigabytes of output containing 60 151 902 partial matches. For each partial match BLAST supplies a number of statistics. These include its expectation (or E-value), which is an estimate of how likely the match would be at random. (The E-values lie in the range to 6.6.) BLAST also reports the number of bases which match exactly between the query sequence and the human reference genome (0-36).
The NCBI reference database for the human genome contains DNA sequences from a number of sources [Aldecoa-Otalora et al. (2009), Langdon and Arno (2012)]. In many cases these sources overlap. Therefore to count the number of matches found by BLAST, we include only high quality matches (i.e. E) and restrict BLAST to the reference sequence for human chromosomes 1 to 22 and the human X and Y chromosomes.
4.2 Randomised Test Suite Sub-sampling
When a large volume of training data is available we had previously used a random sub-sample of the test data at each generation [Langdon (2010)] to reduce the volume of testing but also found it helped with generalisation. Here we also use it to spread the training data more uniformly.
We divided the training data into non-overlapping bins using the value to be predicted. (In the case of the two binary classification problems, Sections 4.5 and 4.6, there are just two bins.) Each generation equal numbers of training examples are randomly chosen from each bin. Where a bin contains more examples than are needed the examples are kept in the same random order and the next group are taken. Except where noted, this ensures the examples used in the next generation are not the same ones as used in the previous generation. If there are insufficient examples left, the bin’s examples are first put in a new random order. (This is somewhat reminiscent of Gathercole’s DSS [Gathercole and Ross (1994)], as used commercially [Foster (2001)].)
4.3 Predicting the Quality (E value) of DNA Matches
Typically BLAST reports many matches. However it sorts them so that the best match comes first. Therefore we simply took the E value of the first match to be GP’s target value. Where BLAST was unable to find any match this was presented to GP as an E value of 100. Due to the wide range of E values, GP works with (E) rather than the E value directly. Using the integer part of (E) we divided the training data into 13 groups (separated by powers of ten). Each generation 35 examples are randomly chosen from each group. This means each generation (of 2357) examples are used. (The twelfth bin contains only 11 examples.) Note, the bins are only used for training, data used to test the evolved predictors are drawn uniformly. The GP fitness function is the Pearson correlation between the value calculated by GP and (E).
4.4 Predicting the size of the Best BLAST Match
Again we took the best match to be GP’s target and this time asked GP to predict its length (i.e. the length of the first match reported by BLAST). There are 137 Solexa training sequences where BLAST was unable to find any match. These are treated as having a length of zero and placed in a group by themselves. All reported matches have a length of at least 18 bases. They are placed in ten groups: 18-19, 20-21, 22-23, …, 34-35 and length 36.) So of 2357 examples are randomly chosen for use in each generation. Fitness is the correlation between GP’s value and the actual length.
| Pass0 Terminals: | 1037 random constants pos len=36 A C G T Self Complement Samesize Opposite N Qual S Run CountN X Y Aux1 Aux2 |
|---|---|
| Pass1 Terminals: | 1037 random constants pos len=36 A C G T Self Complement Samesize Opposite N Qual S Run CountN X Y Aux1 Aux2 M Sum0 |
| Result Terminals: | 1037 random constants len=36 S Run CountN X Y Aux1 Aux2 Sum0 Sum1 |
| Functions: | IFLTE ORN ADD SUB MUL DIV LOOK01 set_Aux1 set_Aux2 sum_Aux1 sum_Aux2 |
| Fitness: | If predicting E or length, fitness is correlation. If classifying high quality match or repeated high quality match then fitness is the number of correct answers |
| Population: | Panmictic, generational. 10 000 members. 4 members per selection tournament. New training sample each generation. |
| Parameters: | Initial pop ramped half-and-half 6:2. 50% subtree crossover, 22.5% point mutation, 22.5% mutation which swaps constants, 2.5% shrink mutation, 2.5% subtree mutation. No depth limit, max size 1022. Stop after 100 generations. |
4.5 Predicting High Quality BLAST Matches
We evolve two classifiers for the number of BLAST matches. The first (this section) returns a positive value if GP thinks at least one high quality match will be found (i.e. ). Conversely, there are 997 (42%) training DNA sequences which either BLAST could not find any matches or where the matches had poor E values (E).
With both classifiers (i.e. this section and the next), each generation 300 positive and 300 negative randomly chosen examples are used to assess every individual’s fitness. Fitness is the number of training cases correctly classified.
4.6 Predicting Repeats in the Human Genome
When predicting repeats, a positive value is used to indicate GP expects there to be multiple instances of the DNA sequences in the Human genome. (Repeated sequences are quite common [IHGSC, (2001)].) However there are only 324 training sequences with multiple high quality matches. Selecting 300 positive examples means almost all of them are used every generation. In contrast each of the 2033 negative examples will have to wait at least six generations () before it is even eligible to be reused by the fitness function. (On average each negative example is used in 16 generations.) As with all our other predictors, the separate data used to validate the evolved predictor are drawn uniformly.
4.7 Genetic Programming Architecture and Primitives
The rest of Section 4 describes the GP representation, data flows within its three components, terminal and function sets and the speed of the GP system. We used a multiple tree GP (based on [Langdon (1998)]) with functions and terminals inspired by Koza’s transmembrane prediction work [Koza (1994)]. (Details are given in Table 1.)
4.7.1 Co-Evolving Three Trees
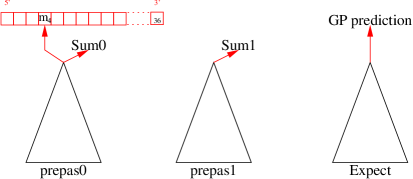
It seems clear that the evolved classifiers will need to scan the DNA sequence. It is unclear how many times they will want to scan it. To support serial processing of the sequence and still allow evolution some freedom of choice, we adopted a novel three tree architecture (Figure 1). The first two trees scan the sequence and pass data via memory to the final one. GP is free to decide how to use this architecture. It can readily use it to process the complete DNA sequence 0, 1 or 2 times. The first tree is called once for each member of the sequence from the start to the end. (In Bioinformatics this is known as 5’–3’ order). Thus the first GP tree is used 36 times. Then the second tree is called for each DNA base in the sequence in the same order. (Again making 36 times per fitness evaluation.) Finally the last tree is called once and its result is used to determine the fitness of the whole team.
The trees can also be thought of as team members or agents. They are independently evolved in that crossover and mutation act on a single agent but whole teams are forced to coevolve collaboratively. Each member is locked into its team and cannot act outside it. In earlier experiments with evolving memory we showed GP can coevolve such teams of agents. [Langdon (1998)] contains examples of teams of five and 15 agents. Recently GP has since been used to evolve even bigger teams [Moreno-Torres et al. (2009)]. GP can evolve individuals which pass results returned by earlier tree calls and previously calculated intermediate values amongst team members by using a variety of special purpose and general purpose memory cells. (As is common in machine learning, GP individuals cannot affect the fitness of other members of the population or influence their own behaviour on other test cases.)
4.7.2 Passing Data Between Trees via Memory
It is expected that passing along the DNA sequence will enable GP to calculate complex statistics somewhat similar to running averages. To assist this the sum of the 36 results produced by each of the prepass trees is stored and made available to the following parts of the GP individual via read-only terminals Sum0 and Sum1.
The GP leaf M refers to 36 read-only memory cells, which allows the second prepass to use the result returned by the first pass. It can be thought of a similar to an ADF [Koza (1994)] with a cache [Langdon (1998)].
We also have more conventional indexed memory [Teller (1994)]. There are two floating point memory cells, called Aux1 and Aux2, and routines to write to them, set_Aux1 and set_Aux2. As with [Langdon (1998)], functions set_Aux1 and set_Aux2 take one argument, which is assigned to the memory cell and return the memory’s new value.
Inspired by the work on “memory with memory” [Poli et al. (2009)] we also introduce two functions: sum_Aux1 and sum_Aux2. Instead of overwriting their memory cell’s contents they add their input’s value to it. (Again returning the memory’s new value.) Alternatively these can be thought of as parametrised memory increment instructions [Langdon (1998)].
4.7.3 DNA bases
Inspired by Koza’s work on protein sequences [Koza (1994)] we use five terminals (A, C, G, T and N) to indicate (in both prepass trees) if the current bases is an A, C, G or T. N indicates the scanner did not know which of the four bases it is. The leaf has the value 1 if is true and -1 otherwise. (Thus leaf N is always -1 unless the DNA scanner has indicated it cannot tell which of the four bases it is.)
4.7.4 Look Ahead
It may be convenient for GP to be able to compare nearby parts of the sequence. The function LOOK moves the active position (denoted by terminal pos) ahead one. Within the overall limit on program size, LOOK can be as deeply nested as evolution likes and so it allows arbitrary look ahead. I.e. special inputs, like A, when invoked by LOOK’s single argument, respond as they would do when the prepass tree is called later along the sequence. LOOK applies to all position dependent primitives (including Qual, Run, M, S and pos itself). Protection against looking pass the end of the DNA sequence is given.
4.7.5 DNA Specific Terminals
The complementary binding of A–T and C–G is well known. We sought to give ready access to such information. The four terminals: Self, Complement, Samesize and Opposite each compare the current base (as updated by LOOK) with the base at the standard position (i.e. without LOOK). Like A, C, G, T and N, they signal true and false with 1 and -1.
Self returns 1 if the current DNA base and the “LOOKed” at DNA base are the same. Complement returns 1 if they are members of a complementary pair. Samesize returns 1 if they contain the same number of rings. (C and T are “small” and have one ring. A and G are large and have 2 rings. Arbitrarily N is given 0 rings.) Opposite is true only if Self, Complement and Samesize are all false.
4.7.6 Solexa Quality Terminals
As well as N, the Solexa scanner includes a quality value for each base. These are presented to the GP via the Qual terminal as values in the range 0, 0.1, 0.2, …, 3.9, 4.0. (4.0 indicates the DNA scanner has the highest confidence in its output. 0 means it has no confidence in it.)
4.7.7 Runs of the Same DNA Base
It is known that sequences of the same base can affect Bioinformatics equipment [Upton et al. (2008)], so we provide GP with a primitive which counts the length of identical bases up to and including the current point. (Run’s value is therefore in the range 1, 2, 3, … theoretically up to 36.) No special treatment for N is provided. I.e. an N value terminates a run of other letters but we can also have runs of Ns.
4.7.8 CountN
CountN is simply the number of “N” (i.e. unknown) bases in the current DNA sequence. Typically CountN takes the value 0, 1, 2, or 3. Since CG ratio is known to be important to the Solexa scanner [Cheung et al. (2011)], we might also have provided similar CountA, CountC, CountG and CountT terminals.
4.7.9 Entropy S
The terminal S holds the entropy or information content of the string in bits from its start up to the current position. I.e. S. Where, for example, is the number of As in the current DNA sequence from its start up to the current position divided by the number of all four bases up to the current position. Since N indicates an unknown base, it is accounted for by adding to each of the four bases’ totals. S in the third tree yields the entropy of the whole sequence.
4.7.10 X and Y
The leafs X and Y tell the GP where the DNA sequence was located on the Solexa tile. (See Section 4.1). They are both normalised to the range 0..1 by dividing by the width of the tile in pixels.
4.7.11 Ephemeral Random Constants
1000 values were randomly selected from a tangent distribution [Langdon (1998)]. (I.e. a value is randomly chosen from the range and its tangent is taken.) This gives a few very large numbers (the largest was 632.124324 and the smallest -425.715953) but about half the values lie in the range . This was supplemented by the 37 integer values: 0, 1, … 36.
4.7.12 Functions
In addition to LOOK and the four usual arithmetic operations (+, -, and protected division, which returns 1 on divide by zero) we include if-less-than-or-equal [Langdon (1998)] and Koza’s ORN [Koza (1994)]. ORN takes two arguments. If the first is true (i.e. ) the second is skipped and ORN returns 1. Otherwise it evaluates its second argument and returns 1 if it is true. If the second argument is false (i.e. ), ORN returns -1.
Mostly default behaviour is applied for special values like NaN or infinities. However care is needed with calculating correlation based fitness and protecting against rounding errors etc. causing numerical instabilities (e.g. leading to negative variance). Members of the GP population causing unresolved numerical problems are given low fitness values.
4.7.13 GP Speed
The special GPquick interpreter [Singleton (1994)], [Langdon (1998)] we used processes on average 213 million GP primitives per second. In [Langdon (2010)] we reported a GPU based GP interpreter running more than a thousand times faster, however this was build to exploit both the graphics hardware accelerator and the bit level parallelism inherent in Boolean problems [Poli and Langdon (1999)], rather than floating point numbers as used here. Our GPquick compares well with tinyGP [Poli et al. (2008)], which processes in the region of 20–80 MGPops-1 (C version). [Langdon (2011)] discusses the speed of recent compiled and interpreted GP approaches, particularly those using graphics hardware accelerators. (See also [(13), Table 15.3].)
5 Evolved Prediction of BLAST Matches
In each of the four problems, we extracted the best of generation individuals at generation ten and generation one hundred. (Details are given in Table 1.) Figure 2 shows the evolution of the best of generations fitness, both on its per generation training data (lines with ) and on the whole of the training data (solid lines).

In each of the four prediction tasks and at generation ten and generation one hundred, we tested the smallest of the best of population individuals on a validation set of 31 000 Solexa DNA sequences. The validation data came from completely new sets of sequences firstly chosen uniformly at random from the eleven NA12878 data sets (a 1000 from each). There were only two other individuals in the 1000 genomes project with more than ten data scans from similar Illumina2 Solexa scanners. These are NA12891 and NA12892, who are her father and mother respectively. Ten data scan were chosen at random for each and then 1000 DNA sequences were chosen from each scan. (This entailed running BLAST in total another 31 000 times, taking about 108 hours.)
In all four cases GP was to some degree successful at predicting BLAST’s output. Although there are statistically significant differences between the thirty one validation DNA scans (e.g. SRR001770), performance of the evolved predictors held up well. See Figures 3, 4, 5, 6 and 11. In contrast to the other scans of NA12878’s DNA, scan SRR001770 has about half as many high quality matches. (I.e. BLAST matches with .) The reduction in high quality matches, being approximately the same as the increased fraction of intermediate quality matches, i.e. . Even on the most difficult problem, predicting the existence of repeated short sequences in the Human genome, across all 31 000 verification sequences, GP’s predictions are much better than random guessing, = 108 (1 dof).


5.1 Predicting BLAST “E” Values
After 100 generations GP evolved a program whose correlation with BLAST’s E-value is r=0.76 on the training data and whose median correlation is r=0.77 on all 31 000 validation sequences, see in Figure 3.
Generation 100’s 77 primitive program can be simplified to an almost equivalent program (see Figure 7)
prepas0Ψ= (sum_Aux2 (DIV (set_Aux2
(LOOK (ADD (LOOK
            Samesize)
  (ADD Qual ((ADD
  (LOOK (ADD (ADD ((
    (LOOK (ADD
      (LOOK (ADD Qual (ORN (MUL Samesize T)
        (LOOK C)))
      )
      ((ADD Qual (ORN (MUL Samesize T) (ADD T (SUB (ORN Opposite Self) T))))))
    )))
    (SUB (ORN Opposite Self) T))
    (ADD Qual ( (ADD Qual (ORN (MUL Samesize T) (LOOK C))))))
  )
(MUL Samesize T))))))
) Qual))
prepas1Ψ= (0)
ExpectΨ= (DIV -0.551039 (ADD 11 (Sum0)))
whose final output depends upon the sum over all 36 position in the Solexa DNA sequence of the value calculated by prepas0. The use of sum_Aux2 at the root of prepas0 frequently occurs and gives more weight to the 3’ end of the sequence. GP uses nested LOOKs to compare nearby DNA bases and their reported quality. In fact the best of generation 10 individual from the same run uses only Solexa’s quality indicator to predict BLAST’s E-value. Although performance is not as good, it still obtains r=0.68 on the training data and is almost equivalent to Qual Qual. (Remember division is protected, Section 4.7.12.) The formula suggests lower quality Solexa data contains more mistakes which in turn leads to BLAST matches where more DNA bases do not align exactly and hence BLAST assigns them poorer E-values. Notice again the 3’ end is weighted 36 times more important than the 5’ start of the Solexa DNA sequence. This suggests that GP has learnt that the probability of errors accumulate as the scanner moves along the DNA sequence from the 5’ start. Thus GP assigns more importance to data from the 3’ end of the sequence than from the 5’ start of the sequence.
The evolved model (Figure 7) gives a quick way of predicting how good the match between the DNA sequence and the human genome is. Thus redundant sequences which are predicted to give poor quality matches could be given reduced priority or even ignored in favour of better DNA sequences generated by the scanner.
5.2 Predicting Match Length
Predicting the length of the match found by BLAST proved more difficult with the smallest best of generation 100 predictor having a correlation on all the training data of r=0.61. However again this holds up well on the validation data, with a median correlation r=0.60, see in Figure 4. The error bars confirm the results are highly statistically significantly different from the null hypothesis (no correlation).
The best of generation 100 program is shown in Figure 8.
prepas0Ψ= (1.090291)
prepas1Ψ= (IFLTE (IFLTE (MUL N A) Qual (sum_Aux2 Sum0)
                        (sum_Aux2 (set_Aux2 (sum_Aux1 1.784881))))
                 (IFLTE (IFLTE (MUL N A) Qual (sum_Aux2 Sum0)
                               (sum_Aux2 (set_Aux2 (sum_Aux1 2.105103))))
                        Qual
                        (set_Aux2 (sum_Aux1 2.235319))
                        (sum_Aux2 (set_Aux2 (MUL T Aux1))))
                 (sum_Aux2 Sum0)
                 (IFLTE (MUL N (SUB Opposite X)) Qual (sum_Aux2 Sum0)
                        (sum_Aux2 N)))
ExpectΨ= (ADD (ADD (sum_Aux1 (DIV (ADD (IFLTE CountN Y len Aux2) Sum1)
                                   (IFLTE CountN Y len Aux2)))
                     Sum1) Sum1)
The best program at generation ten has a similar performance (r=0.60) and being smaller it is easier to simplify. It is similar to a predictor which returns if(Qual1) else -. Notice that again the 3’ end is weighted 36 times more important than the 5’ start. This formula means high quality levels (i.e. bigger than 1.0) especially near the end of the DNA sequence, suggest longer BLAST matches (r=0.54). The evolved formula includes ignoring low quality values on A bases. If we add just this, we can get back almost all the performance (r=0.59). Whereas only using Qual1 by itself, excluding the location weighting , still gives a correlation of r=0.48.
Again we see the quality of the sequence generated by the scanner playing a dominant role. Poorer quality sequences tend to have more errors leading to BLAST finding sequences in the human genome which do not match exactly. A single mismatch at the end of the query sequence reduces the length of the reported match marginally, whereas if its in the middle it can half the length of the exactly matching region.
Typically sequencing tools like BLAST assume a minimum length of exactly matching sequences. (If the query sequence is disrupted so the number of consecutive matching DNA bases is less than this, then the sequence will not be found.) Sub-sequences of the minimum length are used as hash keys into the reference genome. Longer keys tend to mean the hash tables are smaller and there are fewer hits which speeds the search. Also both fewer hits and longer hash keys tend to mean the subsequent fuzzy matching has less work to do and so is faster. BLAST relies on the user to set the correct hash key size. However users typically use the supplied default, which is fixed (for a given class of queries). If GP could tell us in advance how long the exact matching region was going to be, the optimum hash key size could be used.
5.3 Predicting High Quality BLAST Matches
The smallest of the best of generation 100 programs evolved to predict if BLAST will find a high quality match (Figure 9), gets 80% of the training data correct. The plot in Figure 5 shows this holds up well on the verification sequences (median 79%). Again this is highly statistically significant. (Across all 31 000 verification sequences = 8400, 1 dof).
prepas0Ψ= (SUB 1.744647 pos)
prepas1Ψ=
(IFLTE (LOOK (IFLTE 1.370267 N 0.496664 Qual))
       (ORN (sum_Aux1 (DIV (LOOK (LOOK Aux2))
                      (sum_Aux2 (DIV (MUL Aux2 G) (sum_Aux2 N)))))
            (ORN Aux1 Samesize))
       (DIV (IFLTE (sum_Aux1 (DIV (ORN (set_Aux1 T) (ORN Complement G))
                               (sum_Aux2 (LOOK A))))
               (ORN (set_Aux1 T) (ORN Complement G))
               (DIV (MUL Aux2 G) (sum_Aux2 N))
               (set_Aux1 (DIV (set_Aux1 X) (ORN (ORN (set_Aux1 T)
                           (ORN Complement G)) (ORN Complement G)))))
            (sum_Aux2 N))
       (set_Aux1 (LOOK (LOOK Aux2))))
ExpectΨ= (sum_Aux2 len)
Since the generation 100 code is large (Figure 9), we again start from the smallest best of generation 10 program which is slightly less accurate (74%) but smaller. It can be simplified to the code shown in Figure 10.
prepas1Ψ= (DIV (LOOK (SUB Qual G)) Qual)
Expect  = (SUB 72 (ADD Sum1 (MUL S 1.177709)))
The simplified code also has a training accuracy of 74%. Remember the prediction is given by the sign of the “Expect” tree and so essentially the predictor works by comparing the sum calculated by the second scan of the sequence with 72.0. The second prepass calculates Sum1. Sum1 takes values spread widely around a median value of 71.1. The average value of S is 1.9 so on average the last term (MUL S 1.177709) comes to about 2.2. This enables entropy (Section 4.7.9) to play a marginal role where is near its average value but the evolved predictor’s performance comes mostly from the prepass through the whole DNA sequence. The prepass uses the Solexa quality values and whether or not the next DNA base is a G. However the presence or absence of G bases is relatively unimportant.
Again we see the Solexa quality data playing a dominant role in the evolved predictor. Since, in this case, we are asking GP to predict the quality of the match found by BLAST this is perhaps less surprising. However evolution has managed to find other information and weave it into the classifier to improve it above simply using the quality indicators provided by Solexa.
5.4 Predicting Repeats in the Human Genome
After one hundred generations GP evolved a program which scores 54% on all the training data. Its median score is 46% on the validation data (see in Figure 6). Although obviously reduced from its performance on its training data, again this is highly significant. Across all 31 000 verification sequences = 910 (1 dof).
Only 14% of the training data give rise to multiple high quality BLAST matches. So although each generation the fitness function tests the evolving population on a 50:50 balanced dataset (see Section 4.6) good multiple matches are very much the minority class. Despite this class imbalance the median fraction of multiple matches correctly predicted is 83% on training data and 83% across the verification datasets (Figure 11).

The three trees of the smallest best of generation 100 program have a combined size of 254. Hence we try to explain each part of it individually. GP’s overall prediction is given by the sign of Sum1M36. However M36 tends to be small compared to Sum1. Thus the sign of Sum1 plays the major role in predicting repeated Human DNA sequences.
Even the simplified prepas1 tree used to calculate Sum1 has 96 elements. Each DNA base it forms a non-linear composition of data calculated by prepas0, data from the last time it was called and G (i.e. if the current base is a G or not, Section 4.7.3). Thus the prediction depends only on G and, via prepas0, Qual and Run. In fact G only plays a minor role, suggesting GP has found a way to predict if BLAST will find multiple high quality matches which mostly uses the quality of the Solexa scan and BLAST’s dislike of simple patterns (which tend to give Run larger values).
Obviously predicting repeated patterns in the three billion Human DNA bases from a sample of just 36 is very hard. So it is surprising that the evolved predictor can find 83% of those reported by BLAST. However the above analysis hints that GP is not only using the 36 bases but also inferring something about the way BLAST deals with and reports repeats.
6 Conclusions
Considerable manual effort is needed to create programs. In many cases problems do not have clear cut solutions but instead there may be a range of solutions which make different compromises between various benefits and differing types of cost. Where the solutions involve software, it may be impossible to know how good a trade-off a solution offers until the software has been coded. Today even identify new operating points is often highly labour intensive and few projects can afford to even explore more than one possibility by hand. Automated software production offers the prospect of exploring complete Pareto trade-off surfaces, for example, between functionality and speed.
As a prelude to this, we have explored modelling critical aspects of an important non-trivial program (BLAST). Since in future we hope to consider automatically generating bespoke software, we deliberately restricted our analysis to one of the many applications where the program might be applied. We chose mapping human genetic variation using Next-Gen DNA sequences from the 1000 genomes project. This is an important task for which the data are both plentiful and freely available online and it is well beyond our target program’s current abilities. Our goal is not to make better generic code but to improve existing code by specialising it to each task. The importance of the 1000 genomes project and the shear volumes of data make this an ideal candidate for dedicated software. If software was cheap enough other applications would each have their own bespoke code.
Although our models were created by considering BLAST’s outputs, BLAST is the de facto standard for Biological string matching which other programs seek to emulate. Thus although our models deliberately apply only to short (36 bases) human DNA sequences generated by the Solexa scanners used by the 1000 genomes project, they can be thought of as embodying to a greater or less extent aspects of an idealised mapping between this Solexa data and the reference human genome. Thus they might also apply to other tools (e.g. BWA and Bowtie2) which emulate BLAST but are much faster. Our models cannot replace such programs but where data are plentiful they might be used to prioritise them. E.g. so that DNA sequences which are expected to yield unique high quality matches are processed first.
One of the critical components of string matching is the use of prefect match “seed” regions. These are short fixed length sequences which exactly match the database and so correspond to our length of matching region. As explained in Section 5.2, correctly choosing the seed length has a considerable impact on performance. Thus, although our models are not perfect, being able to predict the length of the region where the string match exactly would be of great benefit.
This modelling work shows GP can predict the quality of the match (E) (Section 5.1), length of matching sequences (Section 5.2), if a sequence will match (Section 5.3), and can even find 83% of multiple matches (Section 5.4). Analysis of the evolved predictors of E value and length of match shows a strong dependence on Solexa’s two quality indicators. Solexa’s Qual also figures in the evolved prediction of whether there is a match or not. It also depends upon the sequence’s entropy. Whilst other factors seem to relate to quality of the input data, the use of entropy hints at a degree of reverse engineering of BLAST, which does not return low entropy sequences.
There are many repeated sequences in the human genome. They make it difficult to map genetic differences, such as SNPs, (one of the main goals of the 1000 genomes project) and therefore “reads that map to multiple sites in the genome are usually discarded” [Cheung et al. (2011), page 1]. Not only are such matches useless they also slow down search and yet GP can predict 83% of them in advance.
Although it took BLAST 108 hours, excluding I/O, to process 31 000 DNA sequences (Section 5), the GP predictors take on average less than 0.3 seconds.
Acknowledgements
I would like to thank Caroline Johnston, Jeremy Leipzig, Keith James, Pablo Pareja, Pierre Lindenbaum and Larry Parnell. Funded by EPSRC grant EP/I033688/1.
References
- Aldecoa-Otalora et al. (2009) Estibaliz Aldecoa-Otalora, William B. Langdon, Phil Cunningham, and Matthew J. Arno. Unexpected presence of mycoplasma probes on human microarrays. BioTechniques, 47(6):1013–1016, December 2009.
- Altschul et al. (1997) Stephen F. Altschul, Thomas L. Madden, Alejandro A. Schaffer, Jinghui Zhang, Zheng Zhang, Webb Miller, and David J. Lipman. Gapped BLAST and PSI-BLAST a new generation of protein database search programs. Nucleic Acids Research, 25(17):3389–3402, 1997.
- Cheung et al. (2011) Ming-Sin Cheung, Thomas A. Down, Isabel Latorre, and Julie Ahringer. Systematic bias in high-throughput sequencing data and its correction by BEADS. Nucleic Acids Research, 39(15):e103, August 2011.
- Durbin, et al. (2010) Richard M. Durbin, et al. A map of human genome variation from population-scale sequencing. Nature, 467(7319):1061–1073, 28 Oct 2010.
- Foster (2001) James A. Foster. Review: Discipulus: A commercial genetic programming system. Genetic Programming and Evolvable Machines, 2(2):201–203, June 2001.
- Gathercole and Ross (1994) Chris Gathercole and Peter Ross. Some training subset selection methods for supervised learning in genetic programming. Presented at ECAI’94 Workshop on Applied Genetic and other Evolutionary Algorithms, 1994.
- (7) Mark Harman, Yue Jia, William B. Langdon, Tim Menzies, and Shin Yoo. ALERTI: adaptive learning to evolve radical tuning iteratively. International Journal on Software Tools for Technology Transfer. Invited opinion corner.
- Harman et al. (2012) Mark Harman, William B. Langdon, Yue Jia, David R. White, Andrea Arcuri, and John A. Clark. The GISMOE challenge: Constructing the Pareto program surface using genetic programming to find better programs. In The 27th IEEE/ACM International Conference on Automated Software Engineering (ASE 12), pages 1–14, Essen, Germany, September 3-7 2012. ACM.
- Hotelling (1953) Harold Hotelling. New light on the correlation coefficient and its transforms. Journal of the Royal Statistical Society. Series B (Methodological), 15(2):193–232, 1953.
- IHGSC, (2001) International Human Genome Sequencing Consortium. Initial sequencing and analysis of the human genome. Nature, 409(6822):860–921, 15 Feb 2001.
- Karplus et al. (1998) K Karplus, C Barrett, and R Hughey. Hidden Markov models for detecting remote protein homologies. Bioinformatics, 14(10):846–856, 1998.
- Koza (1994) John R. Koza. Genetic Programming II Automatic Discovery of Reusable Programs. MIT Press, 1994.
- (13) William B. Langdon. Large scale bioinformatics data mining with parallel genetic programming on graphics processing units. In Shigeyoshi Tsutsui and Pierre Collet, editors, Massively Parallel Evolutionary Computation on GPGPUs, Natural Computing Series, chapter 15. Springer. Forthcoming.
- Langdon and Arno (2012) W. B. Langdon and M.J. Arno. In Silico infection of the human genome. In Mario Giacobini, Leonardo Vanneschi, and William S. Bush, editors, 10th European Conference on Evolutionary Computation, Machine Learning and Data Mining in Bioinformatics, EvoBIO 2012, volume 7246 of LNCS, pages 245–249, Malaga, Spain, 11-13 April 2012. Springer Verlag.
- (15) William B. Langdon and Mark Harman. Optimising existing software with genetic programming. IEEE Transactions on Evolutionary Computation. Accepted.
- Langdon and Harman (2010) W. B. Langdon and M. Harman. Evolving a CUDA kernel from an nVidia template. In Pilar Sobrevilla, editor, 2010 IEEE World Congress on Computational Intelligence, pages 2376–2383, Barcelona, 18-23 July 2010. IEEE.
- Langdon (1998) William B. Langdon. Genetic Programming and Data Structures. Kluwer, Boston, 1998.
- Langdon (2010) W. B. Langdon. A many threaded CUDA interpreter for genetic programming. In Anna Isabel Esparcia-Alcazar, Aniko Ekart, Sara Silva, Stephen Dignum, and A. Sima Uyar, editors, Proceedings of the 13th European Conference on Genetic Programming, EuroGP 2010, volume 6021 of LNCS, pages 146–158, Istanbul, 7-9 April 2010. Springer.
- Langdon (2011) W. B. Langdon. Graphics processing units and genetic programming: An overview. Soft Computing, 15:1657–1669, August 2011.
- Langdon (2012) W. B. Langdon. Genetic improvement of programs. In Radomil Matousek, editor, 18th International Conference on Soft Computing, MENDEL 2012, Brno, Czech Republic, 27-29 June 2012. Brno University of Technology. Invited keynote.
- Langdon (2013) W. B. Langdon. Which is faster: Bowtie2GP Bowtie Bowtie2 BWA. In Francisco Luna, editor, GECCO 2013 Late breaking abstracts workshop, Amsterdam, 6-10 July 2013. ACM.
- Langmead and Salzberg (2012) Ben Langmead and Steven L Salzberg. Fast gapped-read alignment with Bowtie 2. Nature Methods, 9(4):357–359, 4 March 2012.
- Langmead et al. (2009) Ben Langmead, Cole Trapnell, Mihai Pop, and Steven Salzberg. Ultrafast and memory-efficient alignment of short DNA sequences to the human genome. Genome Biology, 10(3):R25, 2009.
- Moreno-Torres et al. (2009) Jose Garcia Moreno-Torres, Xavier Llora, David E. Goldberg, and Rohit Bhargava. On the homogenization of data from two laboratories using genetic programming. In Jaume Bacardit, Will N. Browne, Jan Drugowitsch, Ester Bernadó-Mansilla, and Martin V. Butz, editors, Learning Classifier Systems, volume 6471 of Lecture Notes in Computer Science, pages 185–197. Springer, 2009.
- Petke et al. (2013) Justyna Petke, William B. Langdon, and Mark Harman. Applying genetic improvement to MiniSAT. In Gordon Fraser, editor, Symposium on Search-Based Software Engineering, Leningrad, August 24-26 2013. Short Papers.
- Poli and Langdon (1999) Riccardo Poli and William B. Langdon. Sub-machine-code genetic programming. In Lee Spector, William B. Langdon, Una-May O’Reilly, and Peter J. Angeline, editors, Advances in Genetic Programming 3, chapter 13, pages 301–323. MIT Press, 1999.
- Poli et al. (2008) Riccardo Poli, William B. Langdon, and Nicholas Freitag McPhee. A field guide to genetic programming. Published via http://lulu.com and freely available at http://www.gp-field-guide.org.uk, 2008. (With contributions by J. R. Koza).
- Poli et al. (2009) Riccardo Poli, Nicholas Freitag McPhee, Luca Citi, and Ellery Crane. Memory with memory in genetic programming. Journal of Artificial Evolution and Applications, 2009. Article ID 570606.
- Singleton (1994) Andy Singleton. Genetic programming with C++. BYTE, pages 171–176, February 1994.
- Teller (1994) Astro Teller. The evolution of mental models. In Kenneth E. Kinnear, Jr., editor, Advances in Genetic Programming, chapter 9, pages 199–219. MIT Press, 1994.
- Upton et al. (2008) Graham JG Upton, William B Langdon, and Andrew P Harrison. G-spots cause incorrect expression measurement in Affymetrix microarrays. BMC Genomics, 9:613, 2008.