Interacting spin- bosons in a two-dimensional optical lattice
Abstract
We study, using quantum Monte Carlo (QMC) simulations, the ground state properties of spin-1 bosons trapped in a square optical lattice. The phase diagram is characterized by the mobility of the particles (Mott insulating or superfluid phase) and by their magnetic properties. For ferromagnetic on-site interactions, the whole phase diagram is ferromagnetic and the Mott insulators-superfluid phase transitions are second order. For antiferromagnetic on-site interactions, spin nematic order is found in the odd Mott lobes and in the superfluid phase. Furthermore, the superfluid-insulator phase transition is first or second order depending on whether the density in the Mott is even or odd. Inside the even Mott lobes, we observe a singlet-to-nematic transition for certain values of the interactions. This transition appears to be first order.
pacs:
05.30.Jp, 03.75.Hh, 67.40.Kh, 75.10.Jm 03.75.MnI Introduction
Ultracold atoms in optical lattices have been used in the recent years to explore the physics of well known quantum statistical discrete models bloch08 , such as the Bose Greiner02 and Fermi Schneider08 ; Jordens08 single-band Hubbard models. Purely optical traps Stamper1998 allow the trapping of alkali atoms, such as , , and , in the hyperfine state without freezing . The presence of these spin degrees of freedom allows the study of multi-band condensed matter Hamiltonians and the interplay between magnetism and superfluidity Vengalattore08 ; Vengalattore10 .
Such systems are governed by extended Hubbard Hamiltonians, with spin-dependent terms ho ; ohmi98 , able to describe the spinful nature of the particles. The on-site spin-spin interaction can be tuned by using optical Feshbach resonance Theis and the nature of the spin-spin interaction can be either ferromagnetic () or antiferromagnetic () depending on the relative magnitudes of the scattering lengths in the singlet and quintuplet channels Stamperbook . In the strong coupling limit and with integer filling, the spinor Bose-Hubbard model can be mapped onto the Heisenberg model with biquadratic interactions which exhibits singlet, dimerized or nematic phases imambekov04 ; Kawashima02 ; Tsuchiya04 .
Several approaches have been used to study the spin-1 bosonic model: mean field methods pai08 ; tsuchiya05 , variational Monte Carlo toga , analytical imambekov04 ; Katsura , strong coupling expansion Kimura13 , Density Matrix Renormalization Group (DMRG) Rizzi05_dmrg ; Bergkvist06_dmrg , and quantum Monte Carlo simulations in 1D apaja06 ; batrouni2009 . The overall picture emerging at zero temperature is that, as expected, the system adopts Mott-insulating (MI) phases, when the filling is commensurate with the lattice size and for large enough repulsion between particles, and a superfluid phase (SF) otherwise. The richness of these systems comes from the magnetic behavior of these phases that changes dramatically with the sign of the spin-dependent interaction parameter .
For negative spin-dependent interaction (see below) corresponding to the ferromagnetic case, a 1D QMC study batrouni2009 shows that all Mott lobes shrink, and eventually disappear, as one increases . The whole phase diagram is ferromagnetic and the same is expected in larger dimension. This was confirmed by a recent theorem that shows that the ground state of such a system is always ferromagnetic Katsura .
The positive antiferromagnetic case exhibits a richer phase diagram. For even densities, , the Mott lobes are expected to have spin singlets on every site but a first order transition to a nematic state is predicted for in two dimensions imambekov04 ; demler02 ; snoek04 . For odd , a nematic order is also expected in two dimensions, depending on the interaction imambekov04 (in one dimension, this nematic phase is changed into a dimerized phase Rizzi05_dmrg ; batrouni2009 ). The superfluid phase is expected to be polarized: superfluidity is carried either by the component or by the components pai08 . The theorem previously mentioned Katsura proves that the global magnetization is zero in the whole phase diagram in the subspace of zero total spin along the axis (). This is compatible with the nematic or dimerized phases observed in other studies.
As for the nature of the MI-SF phase transitions, it was predicted to be affected by the spin-spin interactions pai08 ; tsuchiya05 . For it is argued to be first-order for small positive (and second order in all other cases) whereas the transition for should always be second order. The one-dimensional QMC investigation batrouni2009 presented evidence of singlet and dimerized phases but found only second order transitions, which is expected in one dimension. Recent 1D and 2D QMC studies deforges10 ; deforges11 of a similar system with only two species showed a first order transition for even lobes occurring in two dimensions, as predicted by previous mean-field studies kruti04 ; kruti05 , but not in the one-dimensional case.
The purpose of this paper is to extend the QMC study of the spin-1 system to the two-dimensional square lattice at zero temperature. The paper is organized as follows: in Sec. II, we will introduce the model and QMC techniques used to study it. Secs. III and IV will be devoted to the presentation of the results obtained for the and cases, respectively. In Sec. V, we will summarize these results and give some final remarks.
II Spin-1 model
We consider a system of bosonic atoms in the hyperfine state characterized by the magnetic quantum number . When these atoms are loaded in an optical lattice, the system is governed by the Bose-Hubbard Hamiltonian ho ; demler02 :
| (1) | |||||
where operator () annihilates (creates) a boson of spin (also denoted when needed) on site of a periodic square lattice of size .
The first term in the Hamiltonian is the kinetic term which allows particles to hop between neighboring sites . The hopping parameter sets the energy scale and the number operator counts the total number of bosons on site . will denote the total number of bosons, the corresponding density, and the total density. The operator is the spin operator where , and the are standard spin-1 matrices. Once developed, the term exhibits contact interaction terms and conversion terms between the species. The parameters and are the on-site spin-independent and spin-dependent interaction terms. The nature of the bosons will give the sign of and consequently the nature of the on-site spin-spin interaction whereas the spin independent part is always repulsive, . The case (e.g. ) will maximize the local magnetic moment . Therefore, this is referred to as the “ferromagnetic” case whereas the case (e.g. ) which favors minimum on-site spins is referred to as “antiferromagnetic”.
To simulate this system, we used the Stochastic Green Function algorithm (SGF) SGF with directed updates directedSGF , an exact Quantum Monte Carlo technique that allows canonical or grand canonical simulations of the system as well as measurements of many-particle Green functions. In particular, this algorithm can simulate efficiently the spin-flip term which appears in the development of the term. In this work we used mostly the canonical formulation where the total density is conserved whereas the individual densities fluctuate. The QMC algorithm also conserves the total spin along , , which adds a constraint to the canonical one. The value of in a given canonical simulation is then fixed by the choice of the initial numbers of particles. Due to this constraint, the magnetic physical quantities, involving operators, are identical for the and axes but may be different for the axis. The initial symmetry, where all three axes should behave identically, is broken in our simulations. Using this algorithm we were able to simulate the system reliably for clusters going up to and . We generally compared the results for sizes , and 12 to check that there was no appreciable difference in the behaviour of the system within the limit of the precision we could achieve.
At zero temperature, we relate the density to the chemical potential using
| (2) |
where is the total number of bosons, and is the average energy, equal to the free energy in the ground state.
The superfluid density is given by roy
| (3) |
where the total winding number is a topological quantity, and . The analysis of the magnetic structure requires the equal-time spin-spin correlation functions
| (4) |
The global magnetization is given by
| (5) |
and the magnetic structure factor by
| (6) |
where and are integer multiples of . Other important quantities are the diagonal components of the nematic order parameter traceless tensor given by demler02
| (7) |
These are the indicators of the on-site spin isotropy if for all , and of the spin anisotropy characteristic of the nematic order if and if, at the same time, no magnetic order is present. As in our simulations, then and it is sufficient to calculate . Since nematic order can develop along any axis and as there is not always an ergodicity breaking in MC simulations on finite clusters, can change sign and average to zero even if it is non-zero in each individual measurements. To avoid such an effect, we use the absolute value of the sums of spin operators in .
We also calculate the Green functions
| (8) |
which measure the phase coherence of particles. The anticorrelated motions of particles, which govern the dynamics inside Mott lobes, as the particles of different types exchange their positions are described by the two-particle anticorrelated Green functions
| (9) |
If perfect phase coherence is established by means of particle exchange, reaches its limiting upper value of at long distances . Due to its definition, if there is no correlation between the movements of particles of spin and .
III Ferromagnetic case:
We start with the ferromagnetic case, . Several approaches have been used to study this case. A recent theorem by Katsura and Tasaki, independent of the lattice dimension, shows that the ground state universally exhibits saturated ferromagnetism both in superfluid and Mott insulator phases Katsura . Mean field analyses predicted the same magnetic behavior and continuous MI-SF phase transitions pai08 ; tsuchiya05 . The 1D investigation batrouni2009 , by means of QMC simulations, showed that the magnetic local moment on a site with bosons is maximized and that the whole phase diagram is ferromagnetic, in agreement with the above theorem. In the 2D system, studied with variational Monte Carlo at toga , Mott and superfluid phases were also found to be ferromagnetic. In the first subsection, we calculate the 2D phase diagram in the plane at a fixed ratio and we discuss the phase transitions in the second subsection.
III.1 Phase diagram
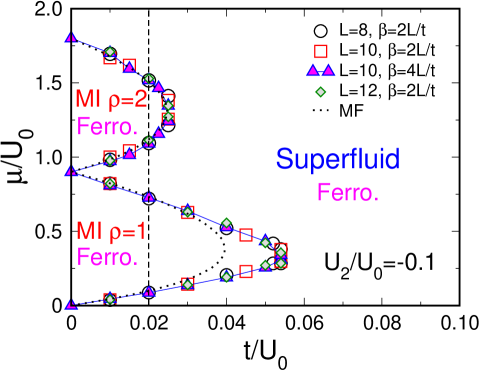
In the no-hopping limit, , the system is in a MI phase with bosons per site with energy per site when satisfies the condition . Therefore, the bases of both the odd and even Mott lobes, given by , shrink with increasing and disappear completely when . The on-site energy is minimized by maximizing the quantum number corresponding to , that is by adopting any of the triplet states for and any of the quintuplet states for . Thus, in the limit, the Mott phases are highly degenerate. As increases, the MI regions are reduced and eventually disappear, giving the familiar Mott lobes (Fig. 1). Outside the MI region the system is superfluid. Note that the shape of the lobes is very different from the 1D case batrouni2009 where the lobes end in cusps. The MF results obtained with the technique used in pai08 are in very good agreement with QMC results at large interactions, as expected. The tip of the is also well reproduced by the MF approximation whereas there is a quantitative difference between QMC and MF for .
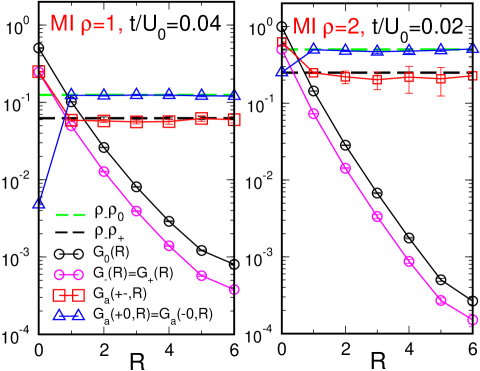
In the Mott insulator phases, the superfluid density is zero and the densities are . The degenerate states of the MI phases in the limit are coupled by second-order contributions from the hopping term which exchange the position of different particles. The degeneracy is, then, lifted by establishing a phase coherence of such exchanges Kuklov2003 ; svistunov2 ; deforges11 . Figure 2 shows single-particle and anticorrelated Green functions in the MI phases for and . As expected in the MI phase, we see that the individual Green functions decay exponentially to zero with distance . Figure 2 shows that the quickly saturate to a constant value at large separations, indicating coherent exchange moves in the MI phase for both and . Furthermore, the plateau reached by this function takes on its maximum possible value at large distances, , showing perfect phase coherence. The equalities and are due to the constraint. As , the Green functions involving spin-0 particles ( and ) are larger than Green functions involving only particles, which will also be true in the superfluid case.
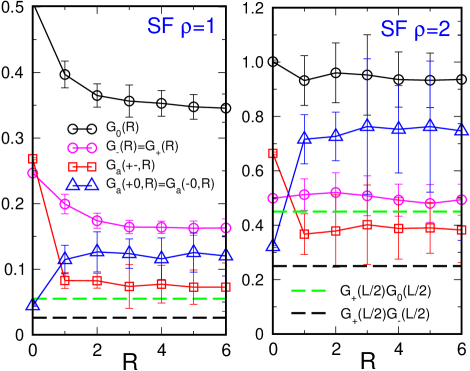
In the superfluid phase, we observe the same density distribution
. Figure
3 shows phase coherence both for
exchange moves and for individual movements of particles. The
saturation of the single-particle Green functions
to a constant value at large separations is the signature of the
existence of a Bose-Einstein condensate as the condensed fraction is
given by , where
the are Fourier transforms of single-particle
Green functions. For both densities, and , the three
species remain correlated, of course, since the system is still in a
strongly interacting regime . This correlation can be
inferred from the fact that and at
large separations. This means that, while particles can move
independently, exchanges of different particles are still present.
This is typical of a strongly correlated superfluid where different
kinds of phase coherence can be observed: phase coherence of the
individual particles, but also, at the same time, phase coherence of
exchange moves of particles.
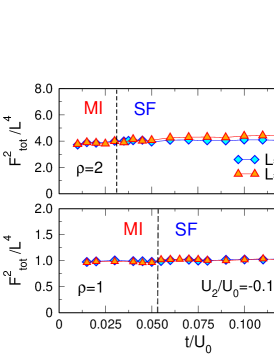
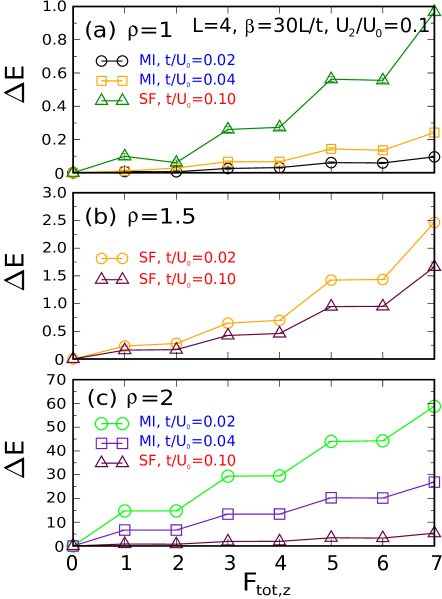
We now focus on the magnetic properties of MI and SF phases for . The ground state exhibits saturated ferromagnetism in the whole phase diagram, as predicted by Katsura and Tasaki’s theorem Katsura and previously observed in batrouni2009 ; toga . In both MI and SF phases with integer density we measure the largest possible spin on-site, given by . Furthermore, the ground state has the maximum possible total spin , thus (Fig. 4) in the whole phase diagram, in the superfluid phase as well as in the Mott phase. Figure 5 shows that the ground state energy is independent of the chosen in the simulation, in the MI or in the SF phase with or 2. As mentionned earlier, is imposed by the initial values of and used in a given simulation. The ground states are then -fold degenerate, as expected if . This also shows that the constant we impose just select one of these states and does not alter the physics.
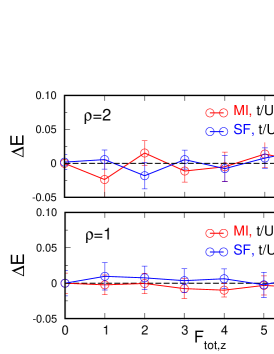
Figure 6 shows , , and the superfluid density versus the density . It shows that and that the magnetic properties are not influenced by the superfluid or solid nature of the underlying phases. The linear step by step evolution of is simply explained by the strong on-site repulsion . For a density we define , the integer part of the density (for , ). To minimize the repulsion cost, a system with density will have the minimal number of sites occupied by particles, that is . These sites contribute to the local moment and the remaining sites occupied by particles contribute . Averaging these contributions yields the observed dependence which is .
III.2 Phase transitions
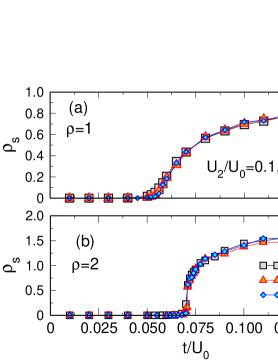
Figure 7 shows the evolution of the superfluid density at the MI-SF transition at fixed total density while varying , in other words the transition at the tip of the Mott lobe. All quantum phase transitions appear to be continuous and there are no signs of possible discontinuities in the superfluid density at the transition between the MI and SF phases. The finite size effects are small and the transitions appear continuous, which means that they should be in the universality class of the three-dimensional XY model, which is expected from general scaling arguments fisher . These results are in agreement with the mean field analysis pai08 .
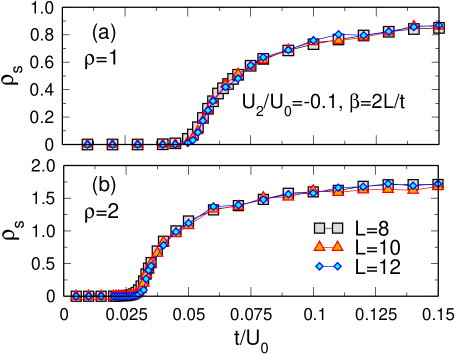
Figure 8
shows a cut in the phase diagram as a function of at (dashed vertical line in
Fig. 1) and clearly
exhibits the first three incompressible Mott plateaux where the
superfluid density vanishes.
Here again, we do not observe discontinuities in or
and conclude that the transitions are continuous.
IV Antiferromagnetic case:
IV.1 Phase diagram
In the no-hopping limit, , the system is in a MI phase with bosons per site when satisfies the condition for odd density and for even density. Therefore, the base of the Mott lobes for odd filling is , whereas it is for even filling. The even lobes grow at the expense of the odd ones, which disappear entirely for .
The on-site energy is minimized by minimizing , that is by adopting one of the triplet states for and a unique singlet state for , which is given at site by
| (10) | |||||
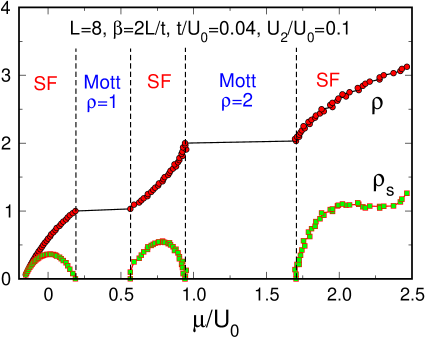
This defines the singlet creation operator. Thus, in the limit, the MI phase is highly degenerate (as in the case) whereas the MI state is unique. As increases, quantum fluctuations cause the MI region to shrink and eventually disappear. The system is superfluid outside the MI region (Fig. 9). As in the case, the MF approximation pai08 reproduces well the base of the Mott lobes and the tip of the lobe, whereas there is a significant difference for the position of the tip of the lobe.
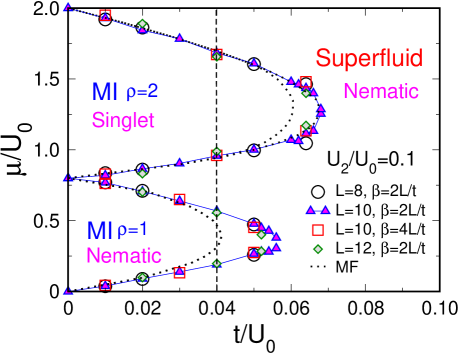
Throughout phase diagram the global magnetization is zero, , in the subspace . Despite this, we will see below that the two Mott lobes exhibit distinct behavior: the lifting of degeneracy in the first lobe will yield a nematic phase whereas the second lobe exhibits in most cases a singlet phase, with a transition to a nematic phase under certain conditions imambekov04 .
For the MI, the density distribution (Fig. 10 (a)) shows that the system is essentially composed of the components. These results agree with Ref. toga . This is in contradistinction to the case where was larger than . Accordingly, in the present case, the largest Green functions will be those involving particles. As observed for the case, Fig. 10 (c) shows that quickly saturates to its maximum possible value at large distances and is larger than . This indicates the presence of coherent exchange moves, whereas the individual decay exponentially with distance.
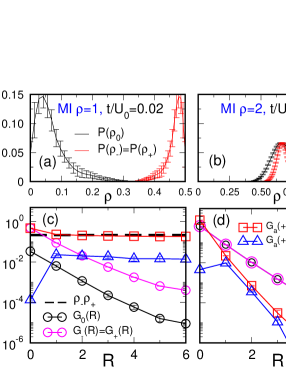
In the MI phase, the system is frozen in a state with two particles per site, which form a singlet pair. In this phase, the singlet density, defined as
| (11) |
is approximately equal to 1 (see, for example,
Fig. 20). The
densities are, accordingly, as shown in
Fig. 10 (b) where the density
distributions are all centered around . All the Green functions
decay exponentially to zero with distance
(Fig. 10 (d)):
the anticorrelated movements are absent in this phase because there is
no degeneracy to lift when .
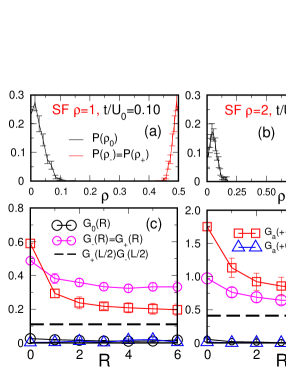
In the superfluid phase, Fig. 11 (a) and (b) show that the peak of spin- distribution approaches the density , while the peak for spin-0 approaches for both densities . Consequently, the superfluid is mostly composed of particles, same as in the Mott phase. This density distribution, observed in Ref. toga for , differs from the mean field one which predicts that superfluidity is carried either by the component or by the components pai08 . Furthermore, Figure 11 (c) and (d) show a phase coherence both for exchange moves and for individual movements of spin- particles in a way similar to the case.
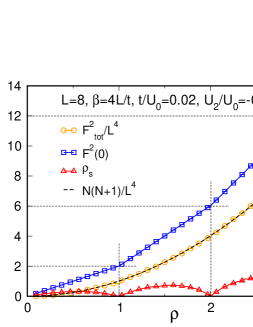
We now focus on the dependence of the global magnetization and energy on . According to Ref. Katsura , the ground state is unique, for all values of the parameters, and has a global magnetization with quantum number if is even and if is odd (we focus on the even case). Fig. 12 shows that the global magnetization agrees very well with the theoretical predictions of Ref. Katsura and behaves in the same way whatever and , as expected.
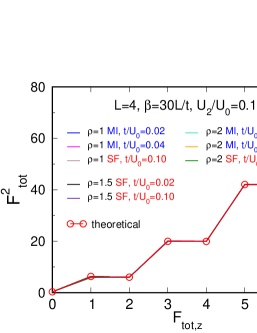
According to Ref. Katsura , the ground state energy satisfies if is even and if is odd. Fig. 13 shows that this result is also verified in the whole phase diagram. This confirms that the energy is minimized when the spins are in the plane and that this constraint used in the rest of the study allows us to reach the ground state.
IV.2 Phase transitions
An important difference between one and two dimensions is that first-order phase transitions may appear in the latter whereas they are rather rare in the former batrouni2009 . Since MFT predicts a first-order phase transition for even Mott lobes tsuchiya05 ; pai08 , we used QMC simulations to study this transition in detail. Figure 14 shows the evolution of the superfluid density, , at the MI-SF transition at fixed total density while varying . The MI-SF transition with is continuous (Fig. 14 (a)), whereas it is discontinuous with (Fig. 14 (b)): the jump in the superfluid density indicates a first-order phase transition. In Fig. 14, the finite size effects are small and the MI-SF transition with is continuous which disagrees with Ref. toga where a first order phase transition is observed. The transition should be in the universality class of the three dimensional XY model fisher .
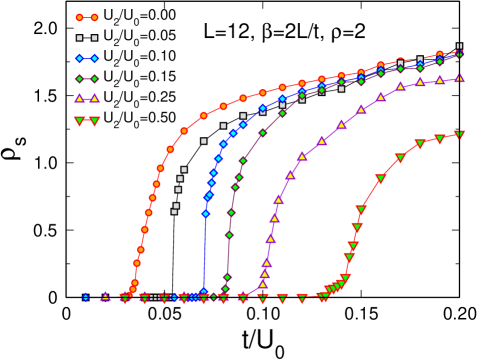
The jump in at the MI-SF phase transition with is observed for different values of . Fig. 15 shows that the transition is continuous for , then it becomes discontinuous for small values, , and is again continuous for . The jump in the superfluid density varies continuously from zero at to a maximum for and then decreases back to zero as is increased further. This interval disagrees with the variational study tsuchiya05 which predicted the first-order transition for smaller than 0.32. A similar behavior was observed for a spin 1/2 model in Ref. deforges11 .
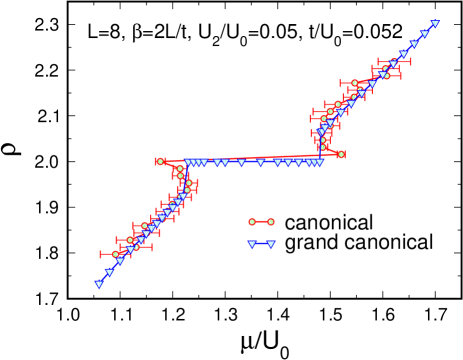
To confirm the presence of first-order phase transitions near the tip
of the MI lobe for even densities, we studied the behavior of
as a function of as one cuts across the lobe at fixed ,
using QMC simulations in the canonical and grand canonical ensembles.
In the canonical ensemble, a first-order transition is signaled by
negative compressibility batrouni2000 , . In the grand canonical
ensemble, there will be a corresponding discontinuous jump in the
versus curve.
Figure 16 shows both these
cases. The canonical simulations clearly show negative just
before and after the Mott plateau at . On the other hand,
the grand canonical ensemble shows discontinuous jumps in at
the corresponding values of . The canonical and grand canonical
simulations are in quantitative agreement on the size of the unstable
region, which is extremely narrow; the system is stable for densities
smaller
than or larger than for the chosen value of
with .
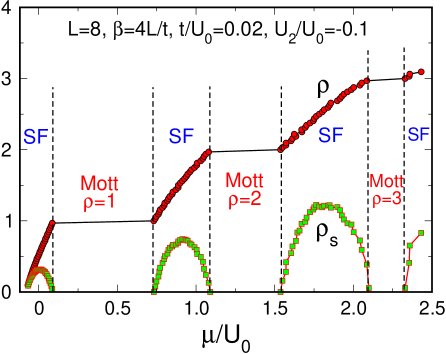
Figure 17 shows a vertical slice of the phase diagram for (Fig. 9). This slice goes through the first two incompressible Mott plateaux ( and ) but remains outside of the Mott phase. MFT predicts that the MI-SF transition near the tip of the even Mott lobes is first order pai08 ; tsuchiya05 . For , vanishes continuously as a function of as the MI phase is approached and the compressibility is positive for all , indicating that the MI-SF transitions are second order. Nevertheless, , increases to a huge value as the MI phase is approached. This behavior is not observed as the MI phase is approached and indicates one approaches the metastable region close to the tip of the even Mott lobes.
IV.3 Magnetic properties
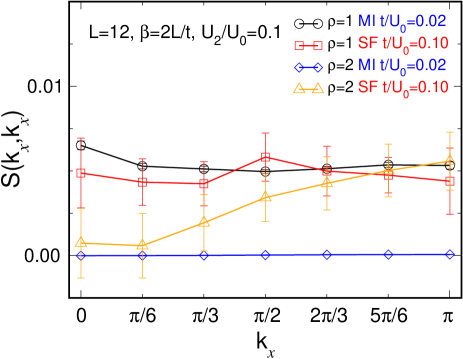
We now examine in detail the magnetic properties of the system and their behavior across the phase transitions. For (Fig. 18), the local moment is constant in the Mott lobe, as one have exactly one particle per site, and slightly decreases to at because of the fluctuations of the density in the superfluid phase. The global magnetization, equal to zero, is not affected by the transition. The nematic order parameter is always non zero in the Mott and superfluid phases, which indicates a spin anisotropy in these phases. At the same time, the magnetic structure factor (Fig. 19) shows no trace of magnetic order anywhere in the phase diagram, especially no sign of antiferromagnetic spin order that would be compatible with zero total magnetization. We, therefore, conclude that there is nematic order in these two phases. Figure 18 also shows the evolution of the singlet density (Eq. 11) which is zero in the MI phase and remains weak in the superfluid.
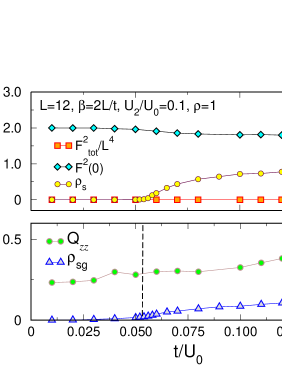
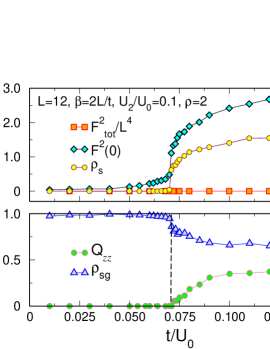
Whereas the nature of magnetism does not change for the MI-SF transition with , things change dramatically for . In Fig. 20, the values of take the system from deep in the second Mott lobe () to the superfluid phase (). As shown for (Fig. 18), the global magnetization is zero all along the transition. Deep in the MI lobe, the system has only singlets: with , while it is nematic in the superfluid phase: and . In spite of the nematic order in the superfluid phase, pairs of singlet are still present: . The precision of our results does not allows us to study the coherence of singlet pairs. Thus, we cannot conclude if the superfluidity is carried by individual particles or by the singlet pairs. In the Mott lobe, close to the transition, at , the local magnetic moment increases because of the quantum fluctuations, whereas the spin remains isotropic: . At the transition, simulations show discontinuous jumps in both and . The spin anisotropy, , grows continuously from zero in the superfluid close to the transition.
According to Refs. imambekov04 ; demler02 ; snoek04 , for insulating states with an even number of particles per site, there is always a spin singlet phase, but there may also be a first order transition between a singlet and a nematic phase inside the Mott phase for small values of in two dimensions. In Fig. 21, we elucidate this question by using smaller values of : 0.01 and 0.005. As observed for , the system is singlet deep in the Mott lobe and nematic in the superfluid phase. Figure 21 (top) shows that the SF-MI transition, , occurs at a larger than the transition to nematic order for . Thus the singlet-nematic transition seems to take place inside the MI phase, but quite close to the MI-SF transition. More interestingly, we see that the position of the singlet-nematic transition is shifted to the left with increasing sizes whereas the position of the MI-SF transition is almost unchanged, which gives a clearer separation of the two transition points for larger sizes. For example, for , the MI-SF transition happens for , whereas the nematic transition happens for . This effect is more pronounced in the second case (Fig. 21 (bottom)) where the transitions take place at and respectively and where the nematic region in the Mott phase is much wider. In both these cases, it is difficult to conclude if there is a first or a second order MI-SF transition. We observe a seemingly continuous transition but we are close to where the transition is continuous. If there is a discontinuity, we would except the jump in to be very small and, hence, very difficult to observe. In the case, there is also no evidence of a first-order transition for the singlet-nematic transition, as and evolve in a seemingly continuous way with our precision (Fig. 21 (top)). However, a discontinuity is observed in these quantities (Fig. 21 (bottom)) for the largest size, , for ; this signals a discontinuous transition. A rigorous investigation with larger sizes , currently inaccessible with QMC, would be required to specify the exact point where the transition occurs and to see if this discontinuous transition is also present in the case. We have also studied the case but it was impossible to distinguish the MI-SF phase transition from the singlet-nematic one, which then appears similar to the case.
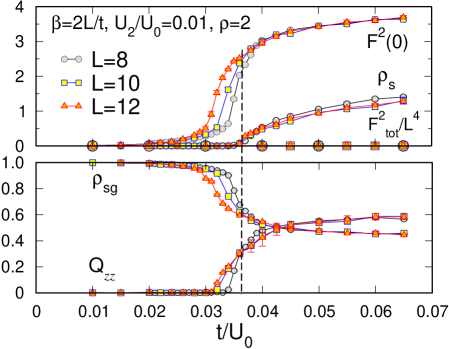
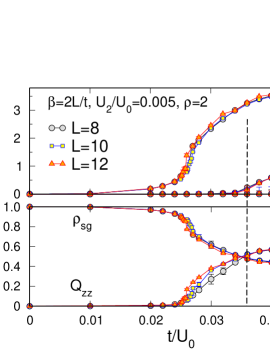
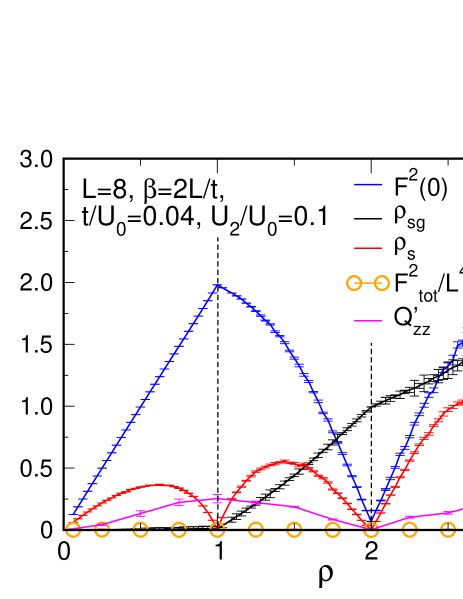
Figure 22 shows the local magnetic moment, , the singlet density, , the superfluid density, , the nematic order parameter, , and the global magnetization, , versus the density taken from Fig. 17. All along this slice, the global magnetization is zero, as expected. As the density is increased, we see that the number of singlet increases regularly for as expected. The behavior of the local magnetic moment can be understood in terms of a minimization process. For an even number of particles on a site, the minimum value of the local moment is zero whereas it is for an odd number of particles. We then observe this alternation of increases of the local moment when the number of sites with an odd number of particles is increasing ( or ) and of decreases when the number of sites with an even number is increasing (). In this case, we measured because is ill behaved for , as explained in section II. We find that the spin anisotropy and nematic order is present in the whole superfluid phase, whatever the density. It is also present, as seen before, in odd density Mott phases and essentially absent from even density Mott phases.
V Conclusion
We studied spin-1 bosons with interactions on a lattice. The interactions are among the simplest possible for such a system: an on-site repulsion independent of spin and an on-site ferromagnetic or antiferromagnetic coupling between spins on the same site.
We have shown that, for both ferromagnetic () and antiferromagnetic () interactions, our QMC results are in good agreement with the theorem of Ref. Katsura .
For we showed that all MI-SF transitions are continuous and that the whole phase diagram is ferromagnetic. This is very similar to what was observed in the one dimensional case batrouni2009 , although the nature of the MI-SF transitions with fixed integer density differs from the 1D case. The ferromagnetism of the whole phase diagram was demonstrated by Katsura and Tasaki and we verified numerically their theorem. We also determined the extent of the different Mott and superfluid phases and showed that the magnetic behavior is indeed not affected by the different natures (superfluid or solid) of theses phases. This is rather surprising as our model does not include explicit coupling between spins on different sites. These couplings arise due to the movement of the particles, and these movements are quite different in solid and superfluid phases.
For , the situation is more interesting as Katsura and Tasaki’s theorem only predicts the global value of the magnetization to be zero in the simple case where . This value is compatible with several magnetic orders, namely an antiferromagnetic order or a nematic order, and the theorem does not specify which order, if any, will emerge in the ground state. Analysing the magnetic structure factor, we excluded the possibility of antiferromagnetic order. The first Mott lobe was expected to be nematic imambekov04 ; toga via a mapping on a spin-1 Heisenberg model and, indeed, we found that the nematic order parameter was non zero in this phase. More surprinsingly, nematic order is also present in the superfluid phase. Furthermore, the density distribution differs from that expected from MFT pai08 which predicts another possible ground state where the spin-0 population dominates. In the second Mott lobe, we observe the formation of singlet order for , and a singlet-nematic transition inside the Mott lobe, close to the tip of the lobe with and as expected imambekov04 . We observed such a transition on the sizes we could study, and were able to find evidence of a first order transition for the case (although we did not observe such evidence for ) as predicted with MFT in imambekov04 ; demler02 ; snoek04 . Finally, we demonstrate that the MI-SF transition in the lobe is continuous, independently of , whereas the transition in the lobe is discontinuous (first-order) for and continuous for larger values.
Acknowledgements.
This work was supported by: the CNRS-UC Davis EPOCAL LIA joint research grant; by NSF grant OISE-0952300; and ARO Award W911NF0710576 with funds from the DARPA OLE Program.References
- (1) I. Bloch, J. Dalibard, and W. Zwerger, Rev. Mod. Phys. 80, 885 (2008).
- (2) M. Greiner, O. Mandel, T. Esslinger, T.W. Hänsch, and I. Bloch, Nature 415, 39 (2002).
- (3) U. Schneider, L. Hackermüller, S. Will, Th. Best, I. Bloch, T. A. Costi, R. W. Helmes, D. Rasch, and A. Rosch, Science 322, 5907 (2008).
- (4) R. Jördens, N. Strohmaier, K. Günter, H. Moritz, and T. Esslinger, Nature 455, 204 (2008).
- (5) D. M. Stamper-Kurn, M. R. Andrews, A. P. Chikkatur, S. Inouye, H.-J. Miesner, J. Stenger, and W. Ketterle, Phys. Rev. Lett. 80, 2027 (1998).
- (6) M. Vengalattore, S. R. Leslie, J. Guzman, and D. M. Stamper-Kurn, Phys. Rev. Lett. 100, 170403 (2008).
- (7) M. Vengalattore, J. Guzman, S. R. Leslie, F. Serwane, and D. M. Stamper-Kurn, Phys. Rev. A 81, 053612 (2010).
- (8) T.-L. Ho, Phys. Rev. Lett. 81, 742 (1998).
- (9) T. Ohmi and K. Machida, J. Phys. Soc. Jpn. 67, 1822 (1998).
- (10) M. Theis, G. Thalhammer, K. Winkler, M. Hellwig, G. Ruff, R. Grimm, and J. H. Denschlag, Phys. Rev. Lett. 93, 123001 (2004); G. Thalhammer, M. Theis, K. Winkler, R. Grimm, and J. H. Denschlag, Phys. Rev. A 71, 033403 (2005).
- (11) D. M. Stamper-Kurn and W. Ketterle, in Coherent Atomic Matter Waves, edited by R. Kaiser, C. Westbrook, and F. David (Springer, Berlin, 2001), p. 137.
- (12) A. Imambekov, M. Lukin, and E. Demler, Phys. Rev. A 68, 063602 (2003) and Phys. Rev. Lett. 93, 120405 (2004).
- (13) N. Kawashima, Prog. Theor. Phys. Suppl. 145, 138 (2002).
- (14) S. Tsuchiya, S. Kurihara, and T. Kimura, Phys. Rev. A 70, 043628 (2004).
- (15) R.V. Pai, K. Sheshadri, and R. Pandit, Phys. Rev. B 77, 014503 (2008).
- (16) T. Kimura, S. Tsuchiya, and S. Kurihara, Phys. Rev. Lett. 94, 110403 (2005).
- (17) Y. Toga, H. Tsuchiura, M. Yamashita, K. Inaba, and H. Yokoyama, J. Phys. Soc. Jpn. 81, 063001 (2012).
- (18) H. Katsura and H. Tasaki, Phys. Rev. Lett. 110, 130405 (2013).
- (19) T. Kimura, Phys. Rev. A 87, 043624 (2013).
- (20) M. Rizzi, D. Rossini, G. De Chiara, S. Montangero, and R. Fazio, Phys. Rev. Lett. 95, 240404 (2005).
- (21) S. Bergkvist, I.P. McCulloch, and A. Rosengren, Phys. Rev. A 74, 053419 (2006).
- (22) V. Apaja and O. F. Syljuåsen, Phys. Rev. A 74, 035601 (2006).
- (23) G. G. Batrouni, V. G. Rousseau, and R. T. Scalettar, Phys. Rev. Lett. 102, 140402 (2009).
- (24) E. Demler and F. Zhou, Phys. Rev. Lett. 88, 163001 (2002).
- (25) M. Snoek and F. Zhou, Phys. Rev. B 69, 094410 (2004).
- (26) L. de Forges de Parny, M. Traynard, F. Hébert, V. G. Rousseau, R. T. Scalettar, and G. G. Batrouni, Phys. Rev. A 82, 063602 (2010).
- (27) L. de Forges de Parny, F. Hébert, V. G. Rousseau, R .T. Scalettar, and G. G. Batrouni, Phys. Rev. B 84, 064529 (2011).
- (28) K. V. Krutitsky and R.Graham, Phys. Rev. A 70, 063610 (2004).
- (29) K. V. Krutitsky, M.Timmer, and R.Graham, Phys. Rev. A 71, 033623 (2005).
- (30) V. G. Rousseau, Phys. Rev. E 77, 056705 (2008).
- (31) V. G. Rousseau, Phys. Rev. E 78, 056707 (2008).
- (32) D. M. Ceperley and E. L. Pollock, Phys. Rev. B 39, 2084 (1989).
- (33) A. B. Kuklov and B. V. Svistunov, Phys. Rev. Lett. 90, 100401 (2003).
- (34) B. Capogrosso-Sansone, S. G. Söyler, N. V. Prokofév and B. V. Svistunov, Phys. Rev. A 81, 053622 (2010).
- (35) M. P. A. Fisher, P. B. Weichman, G. Grinstein, and D. S. Fisher, Phys. Rev. B 40, 546 (1989).
- (36) G. G. Batrouni and R. T. Scalettar, Phys. Rev. Lett. 84, 1599 (2000).