A Luminous and Fast-Expanding Type Ib Supernova SN 2012au
Abstract
We present a set of photometric and spectroscopic observations of a bright Type Ib supernova SN 2012au from d until d after maximum. The shape of its early -band light curve is similar to that of an average Type Ib/c supernova. The peak absolute magnitude is mag, which suggests that this supernova belongs to a very luminous group among Type Ib supernovae. The line velocity of He I 5876 is about km s-1 around maximum, which is much faster than that in a typical Type Ib supernova. From the quasi-bolometric peak luminosity of erg s-1 , we estimate the 56Ni mass produced during the explosion as 0.30 M⊙. We also give a rough constraint to the ejecta mass – M⊙ and the kinetic energy – erg. We find a weak correlation between the peak absolute magnitude and He I velocity among Type Ib SNe. The similarities to SN 1998bw in the density structure inferred from the light curve model as well as the large peak bolometric luminosity suggest that SN 2012au had properties similar to energetic Type Ic supernovae.
1 Introduction
Type Ib supernovae (SNe Ib) are one of subtypes of core-collapse supernovae (CC-SNe), whose early spectra are characterized by strong helium features around maximum (see Filippenko, 1997, for review). SNe Ib belong to a larger group of ‘stripped-envelope’ CC-SNe (Clocchiatti & Wheeler, 1997), together with SNe Ic (SNe without hydrogen nor helium) and SNe IIb (showing hydrogen only during early phase). It is commonly accepted that a progenitor star of a stripped-envelope CC-SN has lost its hydrogen envelope via either a strong stellar wind in a Wolf-Rayet (WR) phase or an interaction with a binary companion. Deep pre-imaging studies suggest that the former, massive WR path is not always the case (e.g., Maund & Smartt, 2005; Crockett et al., 2008). Also, all SNe associated with gamma-ray burst (GRBs) have been found to be SNe Ic, with the most solid cases belonging to broad-line SNe Ic (SNe Ic-BL), attributed to a large kinetic energy of the expansion (sometimes called hypernovae). But details of the connection are still under debate.
In recent years, many detailed observations have been performed for SNe Ib, and a large diversity has been recognized, e.g., a normal SN Ib SN 1990I (Elmhamdi et al., 2004), a mildly energetic SN 2008D (Mazzali et al., 2008; Tanaka et al., 2009; Modjaz et al., 2009), transitional SNe Ib/IIb SN 2008ax (Taubenberger et al., 2011), 1999dn (Benetti et al., 2011), and 2011ei (Milisavljevic et al., 2013a), a rapidly-evolving faint SN 2007Y (Stritzinger et al., 2009), faint Ca-rich SNe 2005E (Perets et al., 2010) and 2005cz (Kawabata et al., 2010), a slowly-evolving SN 2009jf (Sahu et al., 2011), an intermediate sample between SNe Ib and Ic SN 1999ex (Hamuy et al., 2002), and a very peculiar SN 2005bf (Anupama et al., 2005; Tominaga et al., 2005; Maeda et al., 2007). In this Letter, we report optical photometry and spectroscopy of SN Ib 2012au in the early phase and discuss the results based on the observations. We show that SN 2012au has observational properties similar to GRB-associated energetic SNe Ic rather than normal SNe Ib/c.
2 Observation and Data Reduction
SN 2012au was discovered by Catalina Real-Time Transient Survey SNHunt project on 2012 Mar 14 UT (Howerton et al., 2012) in NGC 4790 ( Mpc; Tully, 1988; Theureau et al., 2007), and subsequently classified as SN Ib (Silverman et al., 2012; Soderberg et al., 2012; Milisavljevic et al., 2013b). We carried out photometric (54 nights) and spectroscopic (19 nights) observations of SN 2012au from 2012 Mar 15 through Aug 19 with HOWPol (Kawabata et al., 2008) attached to 1.5m Kanata telescope at Higashi-Hiroshima Observatory. We used and filters for the photometric observation. We performed PSF-photometry in each obtained image. Landolt standard fields were used for photometric calibration of several nearby comparison stars. For spectroscopy, we calibarated flux scale using spectrophotometric standard star HR 4963 obtained in the same nights. We used the sky emission lines simultaneously recorded on the SN spectra for wavelength calibration, and then achieved a wavelength error of Å over wavelength range 4500–9200Å with the resolution of . It is noted that the bright nucleus of the host galaxy exists only east from this SN and it may contaminate our photometry in the latest phase. However, this effect would be negligible in our discussion. In addition to the spectra of SN 2012au, we present our unpublished spectra of SN 2009jf (two epochs) obtained with GLOWS installed to the 1.5m telescope at Gunma Astronomical Observatory.
3 Results
3.1 Extinction and Light Curves
We first correct Galactic extinction of mag (Schlegel et al., 1998). For the extinction within the host galaxy, we place a limit as mag from the upper-limit of the equivalent width of Na I D absorption line (Poznanski et al., 2012) in the averaged spectra. The extinctions in the host galaxy is thus negligibly small ( mag in band) 111This is consistent with mag suggested by Milisavljevic et al. (2013b).. Therefore, we adopt the total extinction toward SN 2012au as mag.
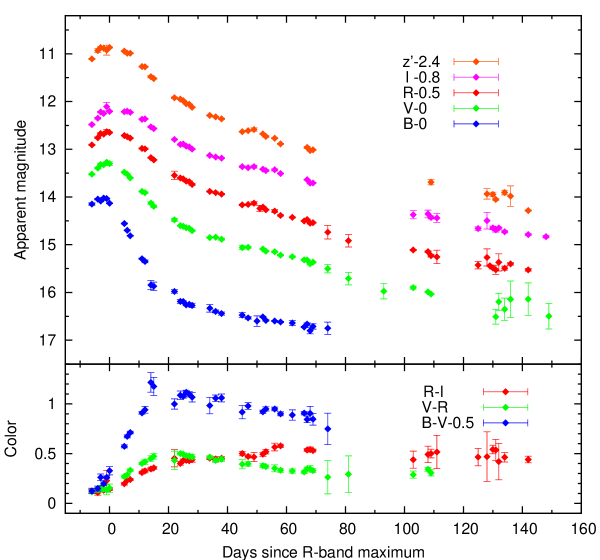
The light curves (LCs) and color curves are shown in Figure 1. The SN reached peak brightness mag on Mar (which is set to be d), corresponding to the absolute magnitude mag. A compilation by Lick Observatory Supernova Search (LOSS) indicates that the mean absolute magnitude of SNe Ib/c is mag (Li et al., 2011). Another systematic study suggests that mag for SNe Ib (and mag and mag for SNe Ic and SNe Ic-BL, respectively; Drout et al., 2011). SN 2012au belongs to a very luminous group among SNe Ib. The post maximum decline within 15 d is estimated to be mag, which locates near the center of the cluster of Drout et al.’s samples, which ranges from 0.4 to 0.8 mag. After d, the SN showed a slow decline with the rate mag d-1 (average in 34–111 d) in band.
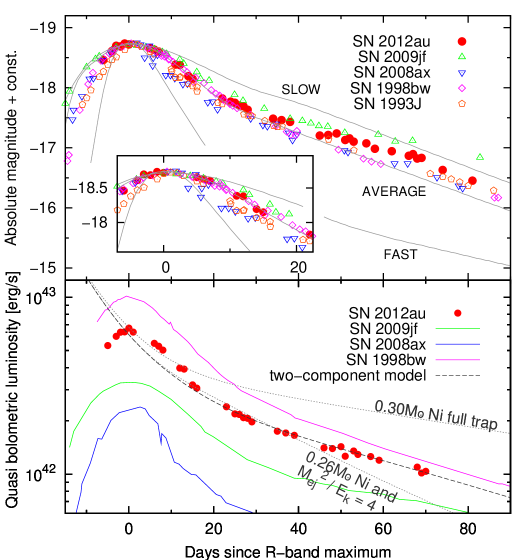
In the upper panel of Figure 2, we show a comparison of -band LC with other CC-SNe, SN 2008ax (Ib/IIb), SN 2009jf (Ib), SN 1998bw (Ic-BL) and SN 1993J (IIb) and also with the LOSS averages. Around maximum, the LC of SN 2012au is very similar to those of SN 1998bw and the LOSS average, showing a slightly slower evolution than LCs of SNe 2008ax and SN 1993J. On the other hand, in the tail of LC ( d), SN 2012au shows slower evolution than these SNe except for the slowly-evolving SN Ib 2009jf. These facts suggest that the trapping efficiencies of optical and -ray photons within the ejecta are larger than the typical.
The color evolution is shown in the lower panel of Figure 1. It becomes progressively redder until 20 d and then its slopes becomes rather flat, which is similar to those seen in other SNe Ib/c. Drout et al. (2011) suggested that the intrinsic colors fall in a relatively narrow range mag around 10 d. In case of SN 2012au, mag at 10 d, which is slightly redder than the mean value.
3.2 Spectra
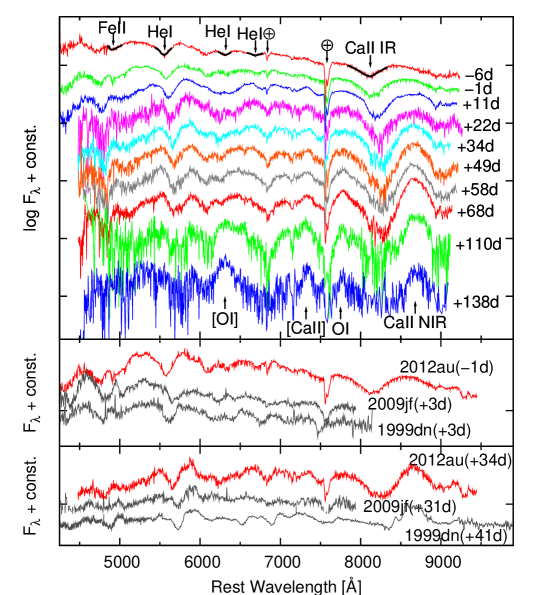
We show the spectral evolution from d to d in Figure 3. Around maximum, the absorption line of He I 5876 is conspicuous as in other SNe Ib. We can see other He I lines ( 6678, 7065), Fe II 5169 and Ca II IR triplet. After d, nebular emission lines, [O I] 6300,6364 and [Ca II] 7291,7323, appear. A comparison of the spectra around maximum and d are shown in the bottom panels of Figure 3. It is clear that the blueshift of He I and other lines in SN 2012au is larger than other SNe, which is discussed in §4.2.
4 Discussion
4.1 Bolometric luminosity and 56Ni mass
From our photometry, we calculated quasi-bolometric luminosity, assuming that the bands occupy about 60% of the bolometric one around the peak (Tomita et al., 2006). Because of this simple assumption, this bolometric luminosity may well have a large systematic error (%). The derived quasi-bolometric LC is shown in the bottom panel of Figure 2. It reaches erg s-1 at maximum. This is clearly larger than those of SN 2009jf ( erg s-1; Sahu et al., 2011) and SN 2008ax ( erg s-1; Taubenberger et al., 2011) (cf. erg s-1 for luminous SN 1998bw; Nakamura et al., 2001, see below).
A general interpretation of the radiation source of SNe Ib/c around maximum is that the energy generated by the decays of 56Ni and 56Co emerges out of the photosphere as optical radiation (Arnett, 1982). Therefore, the 56Ni mass, , can be derived from the peak bolometric luminosity and the rising time (Stritzinger et al., 2006) as
| (1) |
With d (Milisavljevic et al., 2013b) and erg s-1, we obtain M⊙. This 56Ni mass is larger than that in other SNe Ib (e.g., 0.07–0.15 M⊙ in SN 2008ax and 0.14–0.20 M⊙ in SN 2009jf; see also Drout et al., 2011).
Next, we try to constrain the 56Ni mass from the tail component of the quasi-bolometric LC (– d) using a simple one-zone model (Maeda et al., 2003) as shown in Figure 2. At first, with a simplified assumption that -rays are fully trapped and deposit their energy in the ejecta, this model gives 56Ni masses of 0.30 M⊙ for the peak bolometric luminosity (as is equivalent to equation 1). For a more realistic treatment where the -rays can only be partly absorbed, we need to provide the optical depth to -ray within the ejecta, . In this case the bolometric luminosity in the later phase ( d) can be written as 444We show only 56Co decay contribution here for simplicity. The model curves plotted in Figure 2 contain both 56Ni and 56Co decay contributions.
| (2) |
and
| (3) |
where is time after the explosion in day (), and are energy deposits by -ray and positrons, respectively, and is the ejecta mass in solar mass unit. By changing these parameters, however, it turns out that we are unable to reproduce the peak and tail simultaneously with a single component (for example, the case of = 0.26 M⊙ and is shown in figure 2). The tail luminosity requires a small value of , while tail slope requires a large value of instead.
Therefore, we introduce a two-component model similar to Maeda et al. (2003), consisting of an inner region having large optical thickness and an outer region having small . The luminosity is then expressed as
| (4) |
| (5) | |||||
| (6) |
The observation is reproduced reasonably well using this model with
,
,
,
and (the bottome panel of Figure 2).
This result favors that a dense core exists in their inner region.
It is interesting that a similar density contrast has also been derived for the luminous SN Ic-BL 1998bw which possibly produced a jet-like, asymmetric ejection (Maeda et al., 2003);
,
,
,
and .
The fraction of 56Ni in the high velocity component is smaller in SN 2012au, which might suggest either a difference in details of the explosion or a different viewing direction (see also Milisavljevic et al., 2013b).
In this two-component model, the sum of the 56Ni mass is 0.26 M⊙. The difference from 0.30 M⊙ derived from the peak luminosity suggests that the ratio of peak bolometric to radioactive luminosities, , is not unity, but (e.g., Howell et al., 2006). Therefore, the 56Ni mass of 0.26 M⊙ is likely a better estimation. However, to provide a better comparison to other SNe (where 1 is typically assumed), we adopt 0.30 M⊙ throughout this Letter.
4.2 Line Velocity and Explosion Parameters
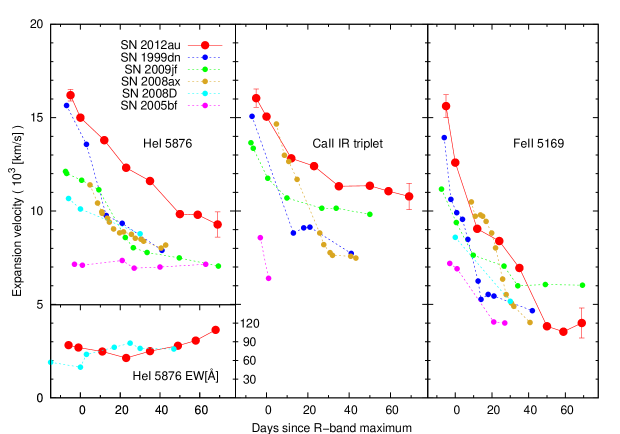
We derived the line velocities of He I 5876, Ca II IR triplet (assumed to the absorption peak at 8571 Å ) and Fe II 5169 by fitting a quadratic-function to each absorption feature (Figure 4). Around maximum, the He velocity of SN 2012au is km s-1, which is significantly larger than those of the SNe Ib samples in Branch et al. (2002) that clustered around km s-1. After 30 d, the He velocities in most SNe Ib decrease and tend to converge at – km s-1 (Fig. 4; see also Branch et al., 2002). On the other hand, SN 2012au exhibits large He velocity, km s-1 even at d. We also derived the line velocities at He I 6678 and 7065 up to d and confirmed that their velocities are consistent with that of He I 5876 within km s-1, suggesting that the contamination by Na I D to He I 5876 is negligible during the period. The line velocities of Ca II IR triplet and Fe II 5169 are also as large as that of He I at d (Fig. 4). The Fe velocity shows a steep decrease from km s-1 around maximum to an asymptotic value of km s-1 after d. This trend is also seen in other SNe Ib, while the velocity in other SNe Ib is lower than km s-1 at maximum (Branch et al., 2002). This may suggest that the distribution of iron is rather widespread, up to the outermost region, in the ejecta.
We show the equivalent width (EW) of He I 5876 absorption line in Figure 4. It is about 80 Å at d, which is larger than that of SN 2008D at similar phase. This might be related with the He enevelope mass and/or the distribution of 56Ni .
We estimate the ejetcta mass, , and kinetic energy, , using scaling relations. The relevant basic equations are
| (7) | |||||
| (8) |
where is absorption coefficient for optical photons, and is a typical expansion velocity (Arnett, 1982). We apply this relation to the case of SN 2012au using the parameters derived for well-studied SN 2008D (Tanaka et al., 2009) as the scaling template. We derive the parameters of SN 2012au as – M⊙ and – erg, where we adopt the He I line velocities around maximum as the expansion velocities555When we use the velocities around d, the parameters show only a small fractional changes as – M⊙ and – erg..
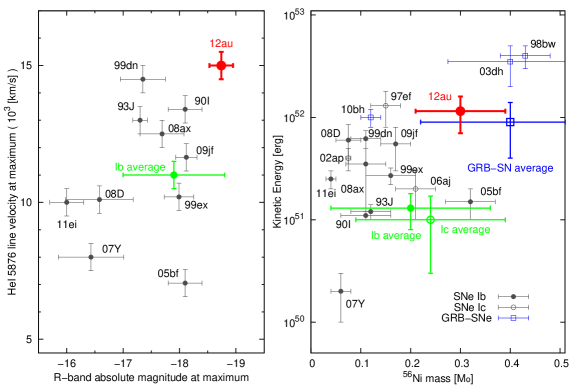
In Figure 5, we plot the peak -band absolute magnitude vs. the He I 5876 line velocity around maximum (left panel) and the 56Ni mass vs. the kinetic energy (right panel) in SN 2012au with those of other SNe Ib (and also SNe Ic in the right panel) for comparison. We see weak positive correlations both in and except for very peculiar SN 2005bf. To our knowledge, the former correlation has not been pointed out so far; the data point of SN Ib 2012au makes it much clearer. Also in the right panel, the point of SN 2012au is apart from the average of SNe Ib and Ic, and rather near of the average of GRB-associated SNe. These results may indicate that SN 2012au have observational properties similar to hypernova.
5 Conclusions
We presented early phase optical photometric and spectroscopic observations of SN 2012au and discussed that (i) SN 2012au is a very luminous SN Ib whose peak quasi-bolometric luminosity reached erg s-1 , and that (ii) this SN shows large He I velocity from maximum through d, and (iii) there is a possible positive correlation between and among SNe Ib.
We derived constraints on the explosion parameters for SN 2012au as follows: – M⊙ and – erg. While this may contain a large error, the ejecta mass points to the main-sequence mass of – (see Tanaka et al., 2009). Together with the large explosion energy and the large 56Ni mass, the progenitor of SN 2012au likely had a large main sequence mass as , for which the outer hydrogen envelope had been stripped away but the helium layer still remained.
Although SN 2012au is spectroscopically classified as SN Ib, the bolometric luminosity is large and close to that of SN 1998bw, and the bolometric LC modeling also suggests that although SN 2012au had the helium envelope at the explosion, the structure of the ejecta in SN 2012au is similar to that of SN 1998bw. These, together with the high velocity absorption features, suggest that SN 2012au has a character close to hypernovae. Finally, we note that independently similar results and discussions were given by Milisavljevic et al. (2013b), mostly based on later phase data than we analyzed in this Letter666At the final stage of preparing this draft, an independent work by Milisavljevic et al. (2013b) has appeared on arXiv.. This may allow us to get an important insight because no GRB-associated SNe Ib has been ever discovered.
References
- Anupama et al. (2005) Anupama, G. C., Sahu, D. K., Deng, J., Nomoto, K., Tominaga, N., Tanaka, M., Mazzali, P. A., & Prabhu, T. P. 2005, ApJ, 631, L125
- Arnett (1982) Arnett, W. D. 1982, ApJ, 253, 785
- Benetti et al. (2011) Benetti, S., et al. 2011, MNRAS, 411, 2726
- Branch et al. (2002) Branch, D., et al. 2002, ApJ, 566, 1005
- Bufano et al. (2012) Bufano, F., et al. 2012, ApJ, 753, 67
- Clocchiatti & Wheeler (1997) Clocchiatti, A., & Wheeler, J. C. 1997, ApJ, 491, 375
- Crockett et al. (2008) Crockett, R. M., et al. 2008, MNRAS, 391, L5
- Deng et al. (2000) Deng, J. S., Qiu, Y. L., Hu, J. Y., Hatano, K., & Branch, D. 2000, ApJ, 540, 452
- Drout et al. (2011) Drout, M. R., et al. 2011, ApJ, 741, 97
- Elmhamdi et al. (2004) Elmhamdi, A., Danziger, I. J., Cappellaro, E., Della Valle, M., Gouiffes, C., Phillips, M. M., & Turatto, M. 2004, A&A, 426, 963
- Filippenko (1997) Filippenko, A. V. 1997, ARA&A, 35, 309
- Hamuy et al. (2002) Hamuy, M., et al. 2002, AJ, 124, 417
- Howell et al. (2006) Howell, D. A., et al. 2006, Nature, 443, 308
- Howerton et al. (2012) Howerton, S., et al. 2012, Central Bureau Electronic Telegrams, 3052, 1
- Kawabata et al. (2010) Kawabata, K. S., et al. 2010, Nature, 465, 326
- Kawabata et al. (2008) Kawabata, K. S., et al. 2008, in Society of Photo-Optical Instrumentation Engineers (SPIE) Conference Series, Vol. 7014, Society of Photo-Optical Instrumentation Engineers (SPIE) Conference Series
- Li et al. (2011) Li, W., et al. 2011, MNRAS, 412, 1441
- Maeda et al. (2003) Maeda, K., Mazzali, P. A., Deng, J., Nomoto, K., Yoshii, Y., Tomita, H., & Kobayashi, Y. 2003, ApJ, 593, 931
- Maeda et al. (2007) Maeda, K., et al. 2007, ApJ, 666, 1069
- Matheson et al. (2001) Matheson, T., Filippenko, A. V., Li, W., Leonard, D. C., & Shields, J. C. 2001, AJ, 121, 1648
- Maund & Smartt (2005) Maund, J. R., & Smartt, S. J. 2005, MNRAS, 360, 288
- Mazzali et al. (2002) Mazzali, P. A., et al. 2002, ApJ, 572, L61
- Mazzali et al. (2006) —. 2006, Nature, 442, 1018
- Mazzali et al. (2003) —. 2003, ApJ, 599, L95
- Mazzali et al. (2000) Mazzali, P. A., Iwamoto, K., & Nomoto, K. 2000, ApJ, 545, 407
- Mazzali et al. (2008) Mazzali, P. A., et al. 2008, Science, 321, 1185
- Milisavljevic et al. (2013a) Milisavljevic, D., et al. 2013a, ApJ, 767, 71
- Milisavljevic et al. (2013b) —. 2013b, ArXiv e-prints
- Modjaz et al. (2009) Modjaz, M., et al. 2009, ApJ, 702, 226
- Nakamura et al. (2001) Nakamura, T., Mazzali, P. A., Nomoto, K., & Iwamoto, K. 2001, ApJ, 550, 991
- Patat et al. (2001) Patat, F., et al. 2001, ApJ, 555, 900
- Perets et al. (2010) Perets, H. B., et al. 2010, Nature, 465, 322
- Poznanski et al. (2012) Poznanski, D., Prochaska, J. X., & Bloom, J. S. 2012, MNRAS, 426, 1465
- Richmond et al. (1996) Richmond, M. W., Treffers, R. R., Filippenko, A. V., & Paik, Y. 1996, AJ, 112, 732
- Sahu et al. (2011) Sahu, D. K., Gurugubelli, U. K., Anupama, G. C., & Nomoto, K. 2011, in Astronomical Society of India Conference Series, Vol. 3, Astronomical Society of India Conference Series, 126
- Schlegel et al. (1998) Schlegel, D. J., Finkbeiner, D. P., & Davis, M. 1998, ApJ, 500, 525
- Silverman et al. (2012) Silverman, J. M., Cenko, S. B., Miller, A. A., Nugent, P. E., & Filippenko, A. V. 2012, Central Bureau Electronic Telegrams, 3052, 2
- Soderberg et al. (2012) Soderberg, A., et al. 2012, The Astronomer’s Telegram, 3968, 1
- Stritzinger et al. (2002) Stritzinger, M., et al. 2002, AJ, 124, 2100
- Stritzinger et al. (2009) —. 2009, ApJ, 696, 713
- Stritzinger et al. (2006) Stritzinger, M., Mazzali, P. A., Sollerman, J., & Benetti, S. 2006, A&A, 460, 793
- Tanaka et al. (2009) Tanaka, M., et al. 2009, ApJ, 692, 1131
- Taubenberger et al. (2011) Taubenberger, S., et al. 2011, MNRAS, 413, 2140
- Theureau et al. (2007) Theureau, G., Hanski, M. O., Coudreau, N., Hallet, N., & Martin, J.-M. 2007, A&A, 465, 71
- Tominaga et al. (2005) Tominaga, N., et al. 2005, ApJ, 633, L97
- Tomita et al. (2006) Tomita, H., et al. 2006, ApJ, 644, 400
- Tsvetkov et al. (2009) Tsvetkov, D. Y., Volkov, I. M., Baklanov, P., Blinnikov, S., & Tuchin, O. 2009, Peremennye Zvezdy, 29, 2
- Tully (1988) Tully, R. B. 1988, Science, 242, 310
- Young et al. (1995) Young, T. R., Baron, E., & Branch, D. 1995, ApJ, 449, L51