Herschel-SPIRE-Fourier Transform Spectroscopy of the nearby spiral galaxy IC342††thanks: Herschel is an ESA space observatory with science instruments provided by European-led Principal Investigator consortia and with important participation from NASA
Abstract
We present observations of the nearby spiral galaxy IC342 with the Herschel Spectral and Photometric Imaging Receiver (SPIRE) Fourier Transform Spectrometer. The spectral range afforded by SPIRE, 196-671 m, allows us to access a number of 12CO lines from J=4–3 to J=13–12 with the highest J transitions observed for the first time. In addition we present measurements of 13CO, [CI] and [NII]. We use a radiative transfer code coupled with Bayesian likelihood analysis to model and constrain the temperature, density and column density of the gas. We find two components, one at 35 K and one at 400 K with CO column densities of 6.31017 cm-2 and 0.41017 cm-2 and CO gas masses of 1.26107 M⊙ and 0.15107 M⊙, for the cold and warm components, respectively. The inclusion of the high-J 12CO line observations, indicate the existence of a much warmer gas component (400 K) confirming earlier findings from H2 rotational line analysis from ISO and Spitzer. The mass of the warm gas is 10% of the cold gas, but it likely dominates the CO luminosity. In addition, we detect strong emission from [NII] 205 m and the and [CI] lines at 370 and 608 m, respectively. The measured 12CO line ratios can be explained by Photon-dominated region (PDR) models although additional heating by e.g. cosmic rays cannot be excluded. The measured [CI] line ratio together with the derived [C] column density of 2.11017 cm-2 and the fact that [CI] is weaker than CO emission in IC342 suggests that [CI] likely arises in a thin layer on the outside of the CO emitting molecular clouds consistent with PDRs playing an important role.
keywords:
Galaxies: ISM – galaxies: starforming – Infrared: galaxies1 Introduction
Far-infrared fine-structure lines of abundant elements such as carbon, oxygen, nitrogen and sulphur either in their neutral or ionised state contribute significantly to the gas cooling of the interstellar medium (ISM, e.g. Hollenbach & Tielens 1999). Far-infrared lines of ionised atoms are useful probes of HII regions while the main cooling of the neutral ISM is carried out by [CII] and [OI] (e.g. Malhotra et al., 2001). In molecular gas, cooling is due to [CI] and the carbon monoxide molecule CO. As potential tracers of the gas cooling, submillimeter [CI] and CO lines are expected to provide information on the gas heating rate, which is dominated by the incident FUV radiation, mainly due to massive and young stars.
Neutral atomic carbon can be found in all types of neutral clouds from diffuse to molecular. The ratio of the two ground state fine-structure lines is a sensitive tracer of the total gas pressure (e.g. Gerin & Phillips 2000). Emission from the two ground state fine-structure lines of atomic carbon is seen by COBE throughout the Milky Way and makes a significant contribution to the gas cooling. Despite the high abundance of atomic carbon [CI] in cool interstellar media and the importance in controlling the overall thermal budget only a handful of measurements of the ground state fine structure lines at 370 and 608 m have been achieved from the ground. The first detection was reported by Buttenbach et al. (1992) in IC342. A handful of galaxies have been detected since, including NGC 253 (Harrison et al. 1995), M82 (Stutzki et al. 1997), M83 (Petitpas & Wilson 1998), and M33 (Wilson 1997).
The molecular CO transitions have been extensively studied from the ground. However, the diagnostic power of the CO rotational transitions has not been fully exploited since only the lowest transitions are easily accessible with ground-based telescopes. In recent years higher rotational transitions have been observed in a handful of nearby (mostly) starburst galaxies (e.g. Papadopoulos et al. 2010). The so called “CO Spectral Line Energy Distribution (SLED)” is used to probe the physical properties of the molecular gas such as temperature and column density.
IC342 is a nearby (D=1.8 Mpc, 1”=8.7pc, McCall 1989) spiral galaxy. Because of its proximity, face-on grand spiral appearance, enhanced star-forming activity in the central region (e.g. Becklin et al. 1980) and strong millimetre and submillimetre emission IC342 has been a popular target for infrared and submillimetre observations. With a far-infrared luminosity 1.251010L⊙ (Dale et al. 2012), IC342 has been an early target of many investigations of molecular gas and/or atomic far-infrared fine structure lines. [CI] emission has already been detected from the ground (Buttenbach et al. 1992) while a number of CO transitions have also been observed (e.g. Bayet et al. 2004, 2006) allowing some constraints to be placed on the properties of the neutral and molecular ISM.
In this paper we present new spectroscopic observations of IC342 obtained using the SPIRE instrument on the Herschel Space Observatory (Pilbratt et al. 2010) covering the 194 to 671 m regime. This spectral region is particularly important as it allow us to access a number of high-J CO line transitions and consequently investigate the properties of the molecular gas. In particular, the current observations allow us to probe the peak of the CO SLED and enable modeling of the physical properties of the molecular ISM. In addition the detection of the two ground state [CI] and [NII] lines allow us to investigate the conditions in the PDRs. The current observations demonstrate the power of far-infrared and submillimetre spectroscopy to probe the diffuse and ionised media in external galaxies. The imminent availability of the Atacama Large Millimetre Array (ALMA) will enable this kind of science in distant galaxies. With a moderate FIR luminosity IC342 is representative of a typical high-redshift galaxy and can serve as a template when designing ALMA observations.
2 Observations, Data Reduction and Results
The present observations were taken as part of Herschel’s Performance Verification (PV) phase using SPIRE (Griffin et al. 2010) as an imaging Fourier-Transform Spectrometer (FTS). The SPIRE astronomical calibration methods and accuracy have been presented in Swinyard et al (2010). SPIRE-FTS was used in the high spectral resolution mode, sampling across a field of view of 2.6’ in diameter. The pointing of the observation was centered at R.A.=56.70322 deg. and Dec=68.09614 deg and the total on-source integration time was 9240 seconds. The SPIRE-FTS measures the Fourier transform of the spectrum of a source using two detector arrays: SSW covering the 194-313 m and SLW covering 303–671 m wavelength bands simultaneously. The FWHM beamwidths of the SSW and SLW arrays vary from 17” at 194 m to 42” at 671 m, respectively. The size of the beams varies within this range in a complex fashion due to the nature of the SPIRE detectors (Swinyard et al. 2010, Wu et al. 2013). The FTS observations consisted of 132 seconds repetitions using single pointing mode, sparse spatial sampling and high spectral resolution (FWHM0.048cm−1). The data were processed using the standard pipeline described in the Observers Manual (SPIRE Observers Manual 2012) and Fulton et al. (2008)
The interferograms were cosmic ray, temperature and time-domain phase corrected. The repetitions were then averaged and Fourier transformed into the spectral domain. By taking the inverse transform of the observed interferogram we can restore the original source spectrum. Although IC342 is a grand-design spiral, it has been found that a significant fraction of the CO J= and J=1 emission arises from a 20”13” central region (e.g. Eckart et al. 1990) which is well matched to the size of the FTS SSW and SLW beams.
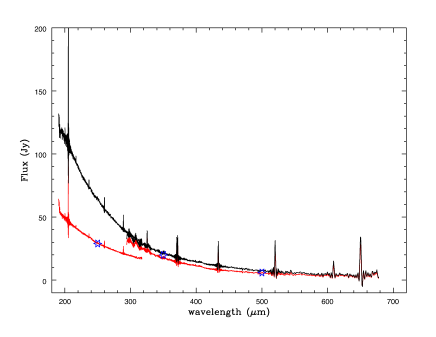
The (uncorrected) FTS spectrum of IC342 is shown in Figure 1 (right) in red. Blue asterisks indicate the peak fluxes taken from the SPIRE photometric images (these are quoted in fluxesbeam, Dale et al. 2012). The prominent mismatch between SLW and SSW is the result of two effects: the variations of the FTS spectral response with frequency and, of the way the beam couples to sources of varying extent. The first effect has been modeled with a combination of Hermite-Gauss (HG) polynomials, which follow the form of the expected native feedhorn modes (Ferlet et al., in prep.). The efficiency with which the beam couples to a given source has been estimated using observations of Neptune and Uranus to establish the point source response, and a model of the flux from the Herschel telescope itself to establish the fully extended response. IC342 fills the SSW beam (low frequency) but can be considered a point source in the SLW beam (high frequency). Following the method described above and detailed in Fletcher et al. (2012) and Wu et al. (2013, in prep) we infer the FWHM size of the source to be 19 arcsec. The corrected FTS spectrum (corresponding to a 19” FWHM core) is shown in Figure 1 (black).
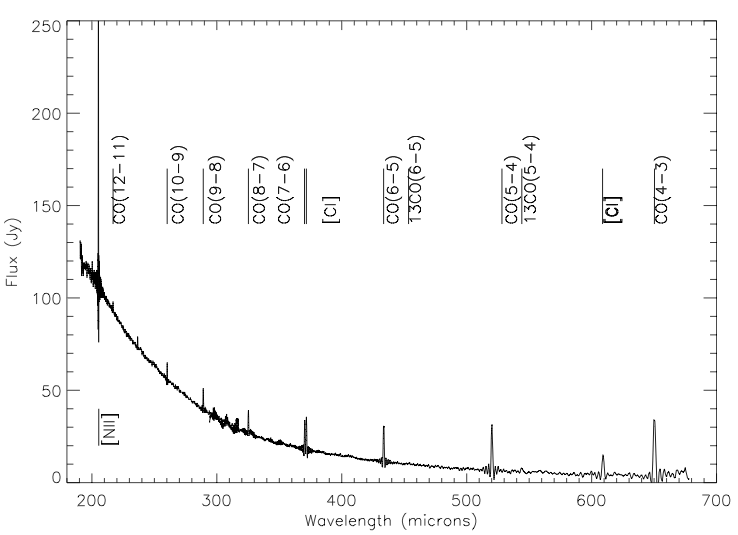
We measured line fluxes from the calibrated unapodized spectrum using our own IDL-based routines. In brief, from each of the SSW (SLW) spectrum we first fit the underlying continuum which must be removed before fitting the lines. After subtracting the continuum fit each line is fitted separately using a sinc function with central frquency, line width, amplitude and residual value(in most cases this equals zero since we have removed the continuum) as free parameters. We also measured fluxes using another IDL based line fitting program called SLIDE developed by A. Rykala (priv. comm.). The integrated line fluxes derived from the two independent methods agree very well. We note that the errors reported in Table 1 are 1 uncertainties estimated from the fitting method. Figure 2 shows the atomic, ionic and molecular lines identified in the IC342 FTS spectrum.
| Species | Transition | Wavelength | Fλ | Fνd |
|---|---|---|---|---|
| (rest, m) | (10 -17 W m-2) | (103 Jy km s-1) | ||
| 12CO | J=4–3 | 650.245 | 40.150.811 | 26.38 |
| 12CO | J=5–4 | 576.268 | 35.620.75 | 18.73 |
| 12CO | J=6–5 | 433.556 | 31.230.69 | 13.68 |
| 12CO | J=7–6 | 371.650 | 24.230.87 | 9.10 |
| 12CO | J=8–7 | 325.225 | 19.270.82 | 6.33 |
| 12CO | J=9–8 | 289.118 | 17.121.14 | 5.00 |
| 12CO | J=10–9 | 260.238 | 12.520.73 | 3.30 |
| 12CO | J=11–10 | 236.611 | 8.9120.95 | 2.13 |
| 12CO | J=12–11 | 216.925 | 6.3420.82 | 1.39 |
| 12CO | J=13–12 | 200.271 | 3.591.24 | 0.72 |
| 12CO | J=1–0 | 2606.869 | 2.250.212 | 5.93 |
| 12CO | J=2–1 | 1303.434 | 8.850.762 | 11.66 |
| 12CO | J=3–2 | 868.956 | 22.511.192 | 19.77 |
| 13CO | J=5-4 | 544.156 | 3.310.85 | 1.82 |
| 13CO | J=6-5 | 453.494 | 1.180.40 | 0.54 |
| 3PP0 | 205.226 | 117.658.2 | 54.64 | |
| 3PP0 | 370.466 | 21.700.8 | 8.124 | |
| 3PP1 | 608.812 | 9.040.9 | 5.57 |
1Quoted errors represent 1 errors from the line fitting
procedure and do not include (e.g.) instrumental uncertainties.
Values from Bayet et al (2006) and references therein, data
taken with beamsize 21.9”.
3 Modeling the CO lines
The properties of the molecular gas in IC342 have been studied through low-J (J6) CO emission lines by, amongst others, Eckart et al. (1990), Harris et al. (1991) and Bayet et al. (2006). Extensive modeling of the low-J CO lines by Bayet et al. (2006) revealed gas densities of the order of a few 103 cm-3 and gas (kinetic) temperatures around 40 K, for the low density, low temperature component. Through spatially resolved kinematics of the CO(6–5) line, Harris et al (1991) suggest that the warm gas is not originating from the same location as the CO low-J lines. With the SPIRE-FTS we can now sample a large part of the 12CO-ladder from J=4–3 to J=13-12. These high-J CO lines, inaccessible from the ground, supplemented with detections of lower-J CO transitions allow us to carry out a full investigation of the physical conditions of the molecular gas in IC342.
For the present investigation of the physical conditions of the molecular gas we used the non-LTE radiative transfer code RADEX (van der Tak et al. 2007) to compute CO intensities (from J=1–0 to J=13–12) for a large grid of temperatures Tkin, density n(H2), column density (NCO) and source size. We use the uniform expanding sphere approximation and a 2.73 K blackbody to represent the cosmic microwave background (CMB). As discussed by Kamenetzky et al. (2012) the choice of background does not affect the resulting kinetic temperature of the model component(s). The code starts off with the optically thin case and generates level populations. The process continues until a stable self-consistent solution is found where the optical depth of the lines remain stable from one iteration to the next. Using the code we have searched a large grid of parameters in Tkin: 10 – 3000 K, n(H2) : 102 – 108 cm-3, NCO : 1015–1024 cm-2 and, source size : 0–1000 arcsec2. During the search procedure we reject those models where: (a) the optical depth of the low-J lines modeled is outside the range -0.1 100 (e.g. Van der Tak 2007, Kamenetzky et al. 2012) and (b) Mgas becomes larger than Mdyn, the dynamical mass of the galaxy. We note that Mgas is defined as:
| (1) |
where, xCO=310-4 is the relative COH2 abundance, DA is the angular distance diameter in cm2, is the angular source size and D is the source size. The mean molecular weight, =1.4, is in units of m. The source size remains the same for all transitions. We finally assume a line width of 54 km s-1 (Bayet et al 2006).
The parameter space is searched using the nested sampling routine MULTINEST (Feroz et al. 2008). In brief, MULTINEST is a Bayesian inference tool for model selection and parameter estimation. It is based on the Monte Carlo technique of nested sampling (Skilling 2004), which can evaluate the Bayesian evidence (useful for model selection) and sample from posterior distributions with (often an unknown number of) multiple modes andor degeneracies between parameters. The posterior distribution P gives the probability of the model parameters (M) given a set of measurements x. Using Bayes theorem, the posterior can be expressed as:
| (2) |
where P is the prior probability that a set of parameters is either physical or unphysical and is set to the grid ranges described above. P is the likelihood of reproducing the observational measurements with a RADEX SLED, given a specific set of model parameters. We use the standard Gaussian likelihood measure to calculate the likelihood. P is the normalisation parameter or Bayesian Evidence which is used for model selection. In order to find the posterior distribution for one parameter, e.g. Tkin, we need to marginalise over all other parameters to find the probability P(Tkin).
4 Results and Discussion
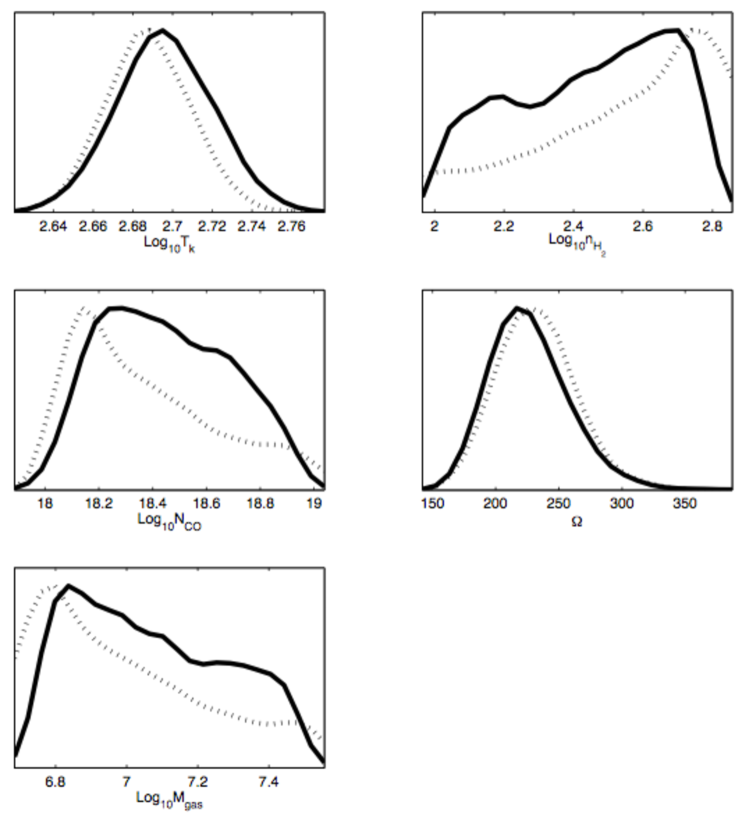
We use RADEX and the nested sampling routine MULTINEST, described above, to model the CO line intensities. All the CO lines reported in Table 1 are used in the analysis supplemented with low-J CO lines reported in the literature. For the total uncertainty, we take the 1 statistical uncertainty in the total integrated intensity from the line fitting procedure and add 10% calibration error in quadrature. We first consider a one-component model (assuming a uniform temperature for all transitions). The highest likelihood model is shown in Figure 3. The resulting ‘posterior’ distributions for each parameter marginalised over the other parameters used in the model are shown in Figure 4. In Table 2 we report the mean, standard deviation and maximum likelihood (ML) values for the Tkin, , N(CO) and .
| Tkin | n(H2) | NCO | Mgas | ||
|---|---|---|---|---|---|
| K | cm-3 | 1018 cm-2 | 107M⊙ | arcsec | |
| mean | 398 | 251 | 2.5 | 1.15 | 227 |
| std dev | 1.04 | 1.65 | 1.69 | 1.62 | 40 |
| ML | 398 | 549 | 1.25 | 0.63 | 224 |
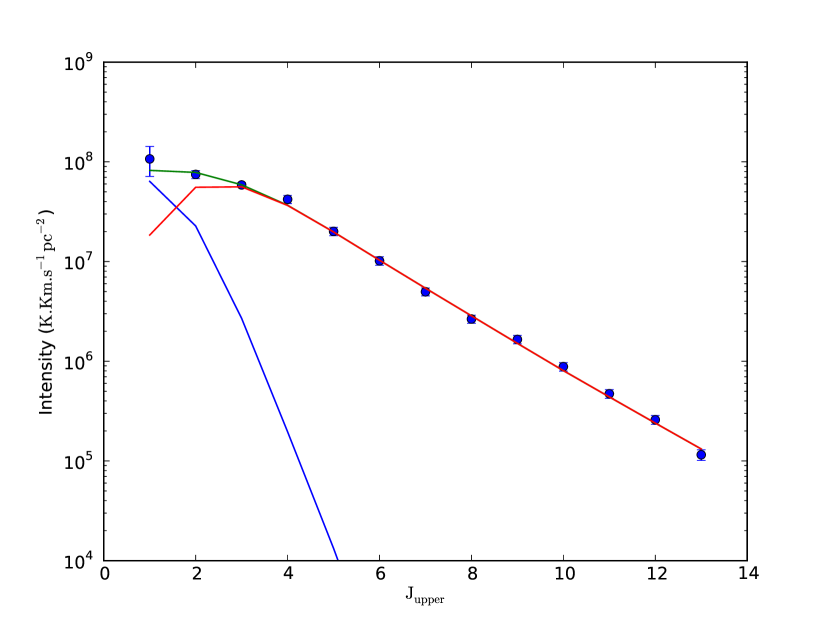
The deviation of the low J (J3) transitions from our highest likelihood model indicates the presence of a second (possibly colder) gas component primarily responsible for the low-J lines. We thus consider a two-component model to fit the CO-SLED following the same procedure as before. In our two component model we allow the three RADEX parameters , and to vary independently for both components, giving us 6 free parameters to search over. We restrict the temperatures of the two components to be in the range 10200K and 2003000, thus, defining a warm and cold component. We fix the source size to the size of the FTS beam () as the cold gas is likely to fill the entire beam and, place an upper limit to the dynamical mass of the combined gas mass from both components.
Unlike previous studies that model the CO-SLED of galaxies (e.g. Kamenetzky et al. 2012) we do not restrict the components to any particular subset of CO lines. That is, both components are combined to give the overall line luminosity. Since there are few constraints on the actual source size of the emitting region from the different CO lines, we also fix the source size of both components to the size of the FTS beam (2140arcsec2). In order to ensure that our results are not significantly biased by fixing the source size we have repeated our models allowing the source size to vary. Such runs have indicated that there exist a degeneracy between source size and column density which is rather difficult to break. As a result we decided to fix the source size so that we can have an independent estimate for the CO column density of the two components without concerns about possible degenerate values.
In Figure 5 we show the highest likelihood two-component model that provides the best fit to the available 12CO data. The low-J lines originate in the cold gas component (35 K) while the warmer gas component (398 K) is responsible for the higher-J lines. The marginalised plots for each parameter with the mean likelihood shown as dotted line are presented in Figure 6. In Table 3 we report the detailed values of the physical characteristics of the warm and cold gas.
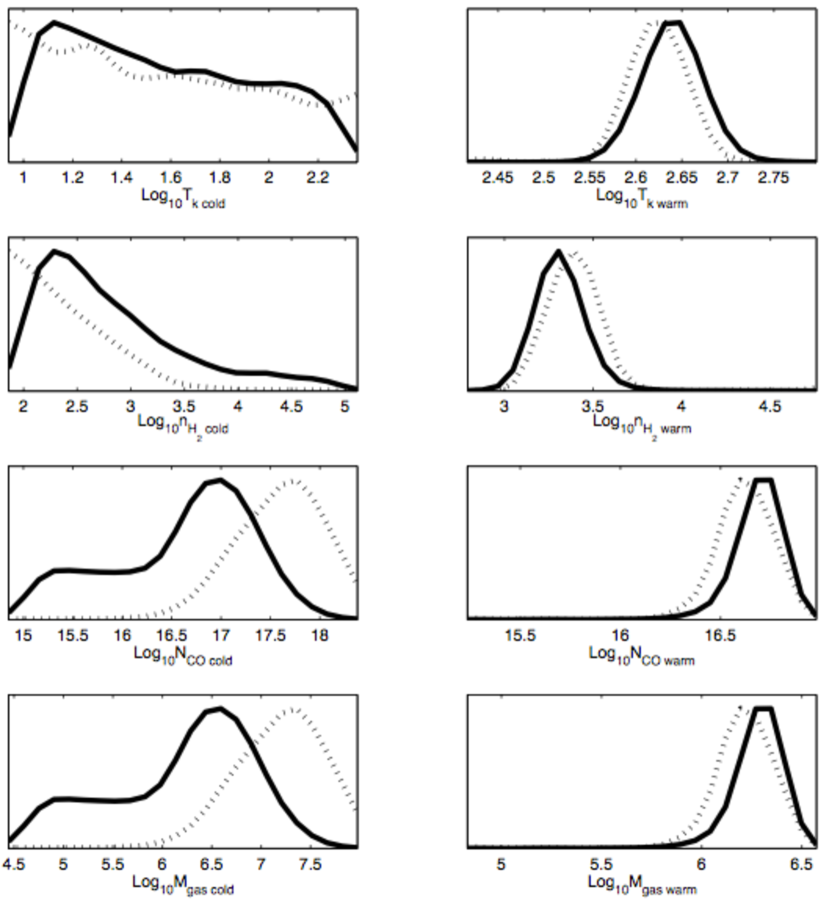
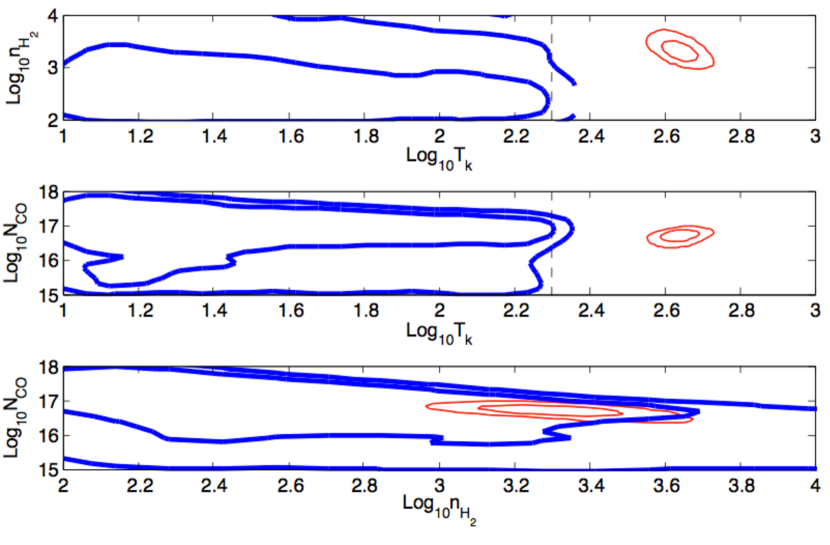
In Figure 7 we show the 2-d marginalised contour plots for the three main parameters, Tkin, and NCO. The plots (1 and 2 contours) show the range of parameters for the two temperature components (blue contours for the cold and red contours for the warm component). The range of temperatures for the cold component is much wider than for the warm component. Two reasons are likely contributing to this effect. First, MULTINEST is very sensitive to errors (of the CO line fluxes) and the error reported for the CO(1–0) transition is driving the fit. Second, for the two component model, we have fixed the apparent source size to the size of the FTS beam. It is very likely that the cold gas may originate in a more spatially extended area than gas at warmer temperatures. The equivalent parameters (Tkin, versus and NCO) for the warm component show a much narrower variation.
Following equation 1, in Table 3 we report the mean, standard deviation and MLM values for the gas mass for the each of the two components considered. For the the warm component the MLM warm gas mass value is 1.6106 M⊙ with a similar mean value of 1.5106 M⊙. Rigopoulou et al. (2002) reported the detection of mid-infrared rotational H2 transitions using ISO. Assuming an ortho-to-para ratio of 3 the S(1)–S(2) ratio can be used to estimate the temperature of the warm gas. For IC342 they report a warm gas temperature of 365 K which is consistent with our value of 398 K (taking into account differences in the beam sizes and calibration). Based on their sample, Rigopoulou et al. find that the warm gas mass (measured from H2) accounts for 1 to 10% of the total gas mass (measured from CO) in starburst galaxies which is consistent with our findings.
| Cold Component | ||||
| Tkin | n(H2) | NCO | Mgas | |
| K | cm-3 | 1017 cm-2 | 107M⊙ | |
| mean | 35.5 | 630 | 3.16 | 1.26 |
| std dev | 2.34 | 1.8 | 1.76 | 1.73 |
| ML | 32.11 | 145 | 6.3 | 2.57 |
| Warm Component | ||||
| mean | 398 | 2089 | 0.40 | 0.15 |
| std dev | 1.06 | 1.24 | 1.202 | 1.202 |
| ML | 407 | 2218 | 0.39 | 0.16 |
The ISM in IC342 has been studied in the past using ground based measurements of (primarily low-J) CO transitions. Using LVG calculations Eckart et al (1990) suggested T 20 K, Israel & Baas (2003) reported Tkin = 100 –150 K while Bayet et al. (2006) fit their data with a model of 40 K. All three models predict densities n(H2) of the order of 2–3 103 cm-3. The Tkin value we derive for the cold component is in good agreement with the values reported by Bayet et al. (2006) and Eckart et al . (1990) but lower than the value reported by Israel & Baas (2003). Our value also agrees with the T531 K and the Twarm443130 K derived by Mauersberger et al. (2003) for the cold and warm gas components based on NH3 observations. The maximum likelihood value for the H2 density of the cold temperature component predicted by our model is, however, lower than those reported in the literature. This is perhaps not surprising given that the cold gas component is in fact expected to have a lower density and a higher Mgas. The warm gas component however, has a higher n(H2) density, and a lower column density NCO. Based on the the lowest J 13CO lines, Meier et al (2000, 2001) inferred gas temperatures of 10–20 K and densities of 103.5cm-3. It is thus likely that there are multiple components to the molecular gas. Denser gas with n(H2) 106 is also present in IC342 as traced through CS and HC3N lines (Aladro et al. 2011). This dense gas is unlikely to contribute dominantly to the observed CO emission, instead it is found in the central core of the molecular clouds in IC342 where evidently (e.g. Martin et al. 2009) is it used to sustain high star formation efficiency.
5 The Origin of the Warm CO molecular Gas
A number of mechanisms can heat the CO molecular gas, including UV starlight in photodissociation regions (PDRs), X-ray heated gas (possibly associated with the presence of an AGN) in X-ray dominated regions (XDRs), mechanical heating (e.g. turbulence dissipation), powerful shocks and heating by cosmic rays. The absence of a strong AGN in IC342 together with the shape of the CO SLED can probably rule out XDRs as the origin of the warm CO emission. In the case of XDR dominance the CO SLED becomes flat at higher-J CO transitions (e.g. Mrk 231, van der Werf et al. 2010) which is clearly not the case in IC342.
A cosmic-ray ionisation rate of 510-17 s-1 (e.g. de Jong, Dalgarno and Boland 1980) is sufficient to heat the gas to about 10 K. For an n(H2) density of 6102 cm-3, CO column density of 3.161017 cm-3 and an excitation temperature of 35 K the cosmic-ray ionisation rate is 10-15 s-1 which is about 20 times higher compared to the standard rate. As Eckart et al. (1990) argue this is unlikely to be the case, especially in the nuclear region of IC342 as it would require a very strong 5 GHz non thermal radio component which is not observed. Therefore, although cosmic rays may contribute towards heating low temperature 10 K gas it is unlikely to be the dominant mechanism of CO heating.
Recentongoing star-forming activity in IC342 (e.g. Meier & Turner 2005, Boker et al. 1997) has resulted in an increased number of OB stars and therefore, in a more intense UV radiation field in this galaxy. The UV radiation heats up the surfaces of the molecular clouds by means of photoelectric heating and heating through far-UV pumping of H2 (e.g. Tielens & Hollenbach 1985). PDRs form in the outer layer of the clouds which are responsible for CO emission from warmhot gas. Using the grid of PDR models presented in Kaufman et al. (1999, 2006) we investigate predictions for the various 12CO lines. The rest of this section deals with models of the 12CO lines although for simplicity we refer to them as CO lines. The PDR models cover a wide range in H2 density (10–107 cm-3) and G0, the incident UV flux. The parameter G0, called the Habing interstellar radiation field, is defined as FUV flux =1.3 10-4 G0 erg cm-2 s-1 sr-1. The FUV flux is related to the FIR flux via the relation FIR flux=2 FUV. We note, however, that in our investigations of the PDR models we do not seek to determine the parameters that best fit the observed line ratios. Instead, in addition to the relative CO line intensities, we use the physical conditions determined from our LVG modeling as priors for PDR models. In our search we do not only consider the ML (or mean) value, instead, we make use of our likelihood analysis and take into account a larger parameter grid (see Figure 5).
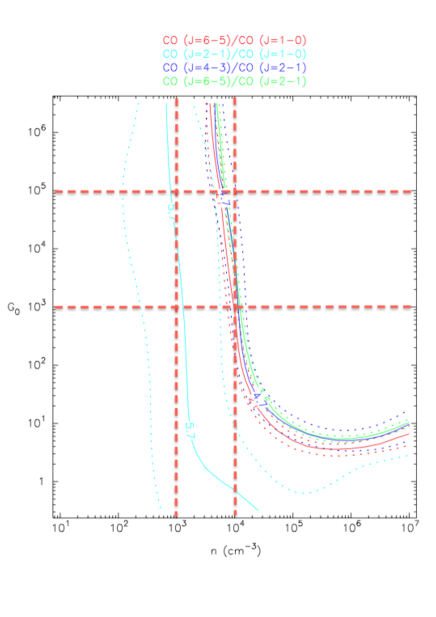
With the above caveats in mind, we have used the online PDR Toolbox program 111http://dustem.astro.umd.edu/pdrt/ (Kaufman et al. 2006, Pound & Wolfire 2008) to investigate the range of PDR parameters that would best match our CO line ratios. The PDR Toolbox program calculates the best values of G0 and cloud density for a given set of spectral line intensities. A description of the PDR models used for these tools can be found in Kaufman et al. (1999). For a given set of gas phase elemental abundances and grain properties, each model is described by a constant H nucleus density, n, and incident far-ultraviolet intensity G0. The models solve for the equilibrium chemistry, thermal balance, and radiation transfer through a PDR layer. We used the line intensities quoted in Table 1 supplemented by those from the literature. The FTS lines have been measured assuming a FWHM of 19 as discussed in Section 2. Figure 8 shows line ratios for various CO transitions. Assuming the range of n(H2) values determined from the likelihood analysis (103–104 cm-3) G0 should be in the range10G105 to match the observed CO line ratios. In fact the best-fit PDR models predicts n(H2) = 5.62103 cm-3 and G0=3.16105. Although at this stage a second mechanism (e.g. cosmic ray heating of the coldest gas) contributing to the CO lines cannot be excluded it is very likely that PDRs play an important, perhaps dominant, mechanism for the CO emission we have detected. Our measured line ratios can be matched with PDR models with n(H2) very close to the values found by the maximum likelihood analysis. Based on the models presented we conclude that a significant fraction of the CO emission in IC342 originates in PDRs.
6 Far Infrared Atomic Fine Structure Lines
As discussed in section 2 (and presented in Table 1) we detect three fine structure lines, the two [CI] 370 and 608 m and [NII] 205 m lines. Prior to Herschel only a handful of [CI] extragalactic measurements had been carried out from the ground. The [NII] 205 m line emission, in particular, is very difficult to observe from the ground because it lies near the long-wavelength cutoff for stressed Ga:Ge photoconductors, strongly limiting the sensitivity of spectrometers in this regime. Oberst et al. (2006) reported the detection of [NII] 205 m towards the Carina galactic star forming region. With SPIRE-FTS we now have additional [NII] 205 m measurements in M82 (Panuzzo et al. 2010, Kamenetzky et al. 2012), Arp220 (Rangwala et al. 2011).
The ratio of the [CI] lines can be used to estimate the physical properties of the atomic [CI] gas that arises predominantly in the CO dissociating regions. For IC342 we derive a I([CI]370m)I([CI]608m) ratio of 1.450.3 which is close to the value of 1.62 0.2 using the measurements reported for M82 in Kamenetzky et al. (2012) but higher than the value of 1.150.3 derived for Arp220 by Rangwala et al. (2011). We use the escape probability radiative transfer models presented in Stutzki et al (1997) and their Figure 2, to infer the [CI] column density N[CI], Tkin and hydrogen column density n(H2). When expressed in line temperature units (K km s-1) the [CI](J=21)[CI](J=10) ratio for IC342 becomes 0.54. For this observed line ratio, a brightness temperature of 15 K and assuming a line width of 54 km s-1 we estimate a column density N(C)=2.11017 cm-2 and H2 density of 5.4103 cm-3. These values are indicative of an excitation temperature 40Tkin60 K. The range of the inferred [CI] excitation temperature is slightly higher than the one derived from cold (low-J) CO (mean value of 36 K) although well within the uncertainties involved. It is, thus likely that that [CI] may originate in the same (cold) molecular gas. The column density ratio NNCO is 0.66 a value similar to that derived for M82 (e.g. Stutzki et al. 1997) but lower than the value of 1 reported for Arp 220 by Rangwala et al. (2011). It has been suggested (e.g. Wilson et al. 1997 but see also discussion in Rangwala et al. 2011) that [CI] emission is stronger for more luminous systems or those harboring intense starbursts or AGN.
Israel (2005) examined the [CI](21) and [CI](21) line ratios for a sample of quiescent, starburst and active galaxies. He found that in the majority of galaxies the [CI](21) ratio is 2. Lower ratios are expected in high-UV environments with high column densities where the majority of neutral C will be locked up in CO. For IC342 the [CI](21) value of 1.2 (Israel 2005) is smaller than the values found for the majority of strong starbursts or luminous systems. The line ratio together with the derived C column density of 2.11017 cm-2 and the fact that [CI] is weaker than CO emission in IC342 could be be indicative of [CI] arising in a thin layer on the outside of the CO emitting molecular clouds consistent with PDRs playing an important role.
The [NII]205 m and [CII]158 m lines have nearly identical critical densities for excitation in ionised gas regions. Their line ratio is thus insensitive to the hardness of the stellar radiation field (since the photon energies required to ionize each species to the next ionisation states are similar) and is only a function of the [NII]205/[CII] abundance ratio. The ratio [NII][CII] can, thus, give us an estimate of the fraction of [CII] arising in ionised gas for a given value of the ionised gas density. The [NII] 122205 m line ratio can be used to probe the density of the ionized gas.
Using [CII] and [NII]122 m measurements of IC342 from the ISO-LWS archive (but also in Brauher et al. 2008 for [CII]) we infer a [NII] 122205 m line ratio of 3.2 and a [CII][NII]205 ratio of 172.5. We compare these ratios to the model line intensity ratio as a function of ionized gas density in Figure 2 of Oberst et al. (2006). Their [NII] 122205 model line ratios range from 2.5 to 4.3, therefore, our estimated [NII] 122205 m line ratio of 3.2 indicates a density of 200 cm-3. For this density, if both lines arise from the ionized gas the expected [CII][NII] 205 ratio would have been 3. Given our estimate of 172.5 we infer that the contributions from ionised gas to [CII] is 17-20% with the remaining originating in warm gas PDRs. This result lends further support to the suggestion that PDRs must play an important role in IC342.
7 CO Ladder: an insight into the excitation of molecular gas of galaxies
The most widely used method to investigate the properties of the molecular gas of galaxies near and far, is through measurements of CO transitions. For nearby galaxies, a suite of low-J CO transitions are readily accessible from the ground and have been used to measure the excitation of the molecular gas (e.g. Boone et al. 2011). For high-redshift galaxies however, we can only obtain a handful of CO transitions, depending on redshift (e.g. Solomon & Vanden Bout 2005, Wagg et al. 2010), hence the resulting CO-SLEDs are very sparsely sampled. The situation is likely to change with the availability of the full ALMA array.
With the SPIRE-FTS we can now measure a number of high-J CO transitions (SPIRE-FTS can access up to J=13 although higher CO transitions up to J=20 can be observed with PACS) and when combined with ground based measurements we can determine the CO-SLED to much greater accuracy. As Kamenetsky et al (2012) point out, the diagnostic tools to model the high-J CO lines are still under development, however, we have already began to exploit the new information available. Extremely high CO line excitation implies the presence of an AGN and strong heating by XDRs or shocks. In star forming regions PDRs play a crucial role by heating the dust efficiently. The CO-SLED of Mrk 231 has been modelled as the result of contributions from PDRs and XDRs, the latter to account for the emission of the high-J lines (van der Werf et al. 2010). In lower luminosity AGN signatures of XDR heating are present close to the nucleus on small scales while in the starburst regions CO excitation originates in by PDRs (e.g Spinoglio et al. 2012). In Starbursts, such as M82, detailed analysis of the CO-SLED revealed that although PDRs could play a role they cannot provide high enough densities to match the observed CO line emission. Kamenetsky et al. (2012) have therefore concluded that mechanical energy (turbulent motions, shocks, cosmic ray heating) is likely to play a large role in the heating of the galaxy. A similar conclusion has been reached by Rangwala et al. (2011) for Arp220.
In the case of IC342, we have shown that the CO-SLED can be adequately explained with a combination of a cold (T35 K), low density component to explain the low-J transitions (with most contribution from J=1-0) and a warmer component (T400 K) necessary to account for the high-J transitions. There is convincing evidence that CO excitation in this quiescent star-forming galaxy can be provided by PDRs without invoking a need for extra heating mechanisms. Thus, IC342 may be used as a template for explaining the CO-SLED of high-redshift main-sequence galaxies that do not appear to be merger-driven (e.g. Elbaz et al. 2011).
8 Conclusions
We have presented spectroscopic observations of IC342 covering the wavelength range 194-671 m carried out with the SPIRE-FTS on board Herschel. We have detected a number of 12CO, 13CO molecular, [CI] atomic and [NII] ionic lines. We have used the radiative transfer code RADEX coupled with MULTINEST to model the 12CO SLED: the modeling procedure has revealed two gas components, a cold temperature component T35 K and, a much warmer component with T400 K. Our new SPIRE-FTS data and in particular the high-J 12CO lines have allowed us to constrain the physical properties of the warm gas component. Based on the observed CO line ratios and published models of PDRs we argue that the CO emission originates in PDRs although additional contributions from e.g. cosmic ray heating cannot be excluded. Using the observed atomic [CI] line ratio we discuss the origin of the [CI] and suggest that it arises in a thin layer on the outside of the CO emitting molecular clouds. This claim is further supported by the fact that the [CI] emission in IC342 is much weaker than the CO(4–3). Using [CII] 158 m measurements from ISO (Brauher et al. 2008) and the [NII] 205 measurement presented here we infer that up to 70% of [CII] arises in warm PDRs on the surface of molecular gas clouds. Such detailed studies of the properties of the atomic, molecular and ionised gas in nearby galaxies have only recently become available thanks to the capabilities of Herschel. These studies are however, very important since they provide templates for understanding the physics of the ISM of high redshift bright submillimetre galaxies that are currently impossible to study at the same level of detail. ALMA however, in its full potential will be able to access the CO-ladder of high redshift galaxies and extend our understanding of the properties of the ISM in extreme environments.
9 Acknowledgments
GEM acknowledges support from the John Fell Oxford University Press (OUP) Research Fund. DAR acknowledges useful discussions with Rob Kennicutt, Daniela Calzetti and Chad Engelbracht and, in particular, the availability of SPIRE data for IC342 ahead of publication. SPIRE has been developed by a consortium of institutes led by Cardiff Univ. (UK) and including: Univ. Leth- bridge (Canada); NAOC (China); CEA, LAM (France); IFSI, Univ. Padua (Italy); IAC (Spain); Stockholm Observatory (Sweden); Imperial College London, RAL, UCL-MSSL, UKATC, Univ. Sussex (UK); and Caltech, JPL, NHSC, Univ. Colorado (USA). This development has been supported by na- tional funding agencies: CSA (Canada); NAOC (China); CEA, CNES, CNRS (France); ASI (Italy); MCINN (Spain); SNSB (Sweden); STFC, UKSA (UK); and NASA (USA).
References
- Aladro ((2011) Aladro, R., Martin-Pintado, J., Martin, S., Mauersberger, R., Bayet, E., 2011, A&A, 525, 89
- Bayet (2004) Bayet, E., Gerin, M., Phillips, T. G., Contursi, A., 2004, A&A, 427, 45
- Bayet (2006) Bayet, E., Gerin, M., Phillips, T. G., Contursi, A., 2006, A&A, 460, 467
- Becklin (1980) Becklin, E., et al., 1980, ApJ, 236, 441
- Boker (1997) Boeker, T., Forster-Schreiber, N. M., Genzel, R., 1997, AJ, 114, 1883
- Boone (2010) Boone, F., et al., 2011, A&A 525,18
- Brauher (2008) Brauher, J.R., Dale, D.A., Helou, G., 2008, ApJS, 178, 280
- Dale et al (2012) Dale, D., et al., 2012, ApJ 745, 95
- deJongDalgarno (1980) de Jong, T., Boland, W., Dalgarno, A., 1980, A&A, 91, 68
- Eckart (1990) Eckart, A., Downes, D., Genzel, R., Harris, A. I., Jaffe, D. T., Wild, W., 1990, ApJ, 348, 434
- Elbaz (2011) Elbaz, D., et al., 2011, A&A, 533,119
- Feroz (2008) Feroz, F., Hobson, M.P., 2008, MNRAS, 384, 449
- Fletcher (2012) Fletcher, L.N., Swinyard, B., Salji, C., et al., 2012, A&A, 539, 44
- Fulton (2008) Fulton, T. R., Naylor, D. A., Baluteau, J.-P., et al. 2008, in SPIE Conf. Ser., 7010
- Gerin Phillips (2000) Gerin, M., Phillips, T., 2000, ApJ, 537, 644
- Griffin (2010) Griffin, M.J., et al. 2010, A&A, 518, 3
- HollenbachTielens (1999) Hollenbach,D.J., Tielens, A.G.G.M., 1999, Rev. of Modern Physics, Vol. 71, 173
- IsraelBaas (2003) Israel,F.P., Baas, F., 2003, A&A, 404, 495
- Israel (2005) Israel, F.P., 2005, A&A, 438, 855
- Kamenetzky (2012) Kamenetzky, J., et al., 2012, APJ, 753, 70
- Kaufman (2006) Kaufman, M., J., Wolfire, M. G., Hollenbach, D. J., 2006, ApJ, 644, 283
- Malhotra (2001) Malhotra, S., Kaufman, M. J., Hollenbach, D., Helou, G., et al., 2001, ApJ, 561, 766
- Martin (2009) Martin S., Martin-Pintado, J., Mauersberger, R., 2009, ApJ, 694, 610
- MeierTurner (2005) Meier, D.S., Turner, J.L., 2005, ApJ, 618, 259
- Meier2 (2001) Meier, D. S, Turner, J.L., Hurt, R.L., 2001, ApJ, 531, 200
- Mauers (2003) Mauersberger, R., Henkel, C., Weiß, A., Peck, A.B., Hagiwara, Y., 2003, A&A, 403, 516
- Oberst (2006) Oberst, T. E., Parshley, S. C., Stacey, G. J., Nikola, T., et al., 2006, ApJ, 652, 125
- Panuzzo (2010) Panuzzo, P., et al., 2010, A&A, 518, 37
- Papadopoulos (2010) Papadopoulos, P.P., van der Werf, P., Isaak, K., Xilouris, E. M., 2010, ApJ, 715, 775
- PetipasWilson (1998) Petitpas, G., Wilson, C., 1998, APJ, 503, 219
- Pilbratt (2010) Pilbratt, G., et al., 2010, A&A, 518, 1
- PoundWolf (2008) Pound, M.W., Wolfire, M.G., 2008, ADAS XVII, 394, 654
- Rangwala (2011) Rangwala, N., Maloney, P. R., Glenn, J., Wilson, C. D., et al., 2011, ApJ, 743, 94
- Rigopoulou (2002) Rigopoulou,D., Kunze, D., Lutz, D., Genzel, R., Moorwood, A. F. M., 2002, A&A, 389, 374
- Skilling (2004) Skilling, J., 2004, AIPC, 735, 395
- Spinoglio (2012) Spinoglio, L., Pereira-Santaella, M., Busquet, G., et al., 2012, ApJ, 758, 108
- SPIRE (2011) SPIRE Observers Manual 2011, HERSCHEL-HSC-DOC-0798, v2.4 edn., Herschel Science Centre,
- Stutzki (1997) Stutzki, J., et al., 1997, ApJ 477, 33
- Swinyard (2010) Swinyard, B., et al., 2010, A&A 518, 4
- vandenBout (2005) Solomon, P.M., Vanden Bout, P.A., 2005, ARA&A, 43, 67
- van der Werf (2010) van der Werf, P.P., Isaak, K. G., Meijerink, R., Spaans, M., 2010, A&A 518, 42
- van der Tak (2007) van der Tak, F.,F. S., Black, J. H., Schoier, F. L., Jansen, D. J., van Dishoeck, E. F.,2007, A&A 468, 627
- Wang (2010) Wagg, J., et al., 2010, A&A 519, 1
- Wilson (1997) Wilson, C.D., 1997, ApJ, 487, 49
- Young (1986) Young, J.S., et al., 1986, ApJ, 311, L17