Investigating solid N2 as a new source of ultra-cold neutrons
Abstract
The dynamical structure factor of solid 15N2 in the phase (K) is measured at the IN4 time-of-flight spectrometer at the Institut Laue Langevin, and the potential performance of this substance as a UCN converter is assessed. The cross-section to down-scatter neutrons to ultra-cold neutron energies is determined as a function of incident energy, as well as the up-scattering mean free path. The UCN production cross-section is found to be approximately of that of deuterium. However, UCN with energy neV have an up-scattering mean free path of cm at K, which is times larger than deuterium. Therefore, a large volume N2 source may produce an improved UCN density if sufficient isotopic purity can be achieved.
1 Introduction
Ultra-Cold Neutrons (UCN) are neutrons with energies ( neV) low enough to be trapped by suitable material and magnetic bottles[1, 2]. Due to long storage times (several hundred seconds or more), precise measurements of the neutron’s properties use UCN, and these measurements have implications for the theory of weak interactions and physics beyond the standard model[3, 5, 6]. Many of these experiments are statistically limited, and research of improved materials and technologies is necessary to develop new and intense UCN sources.
Several planned UCN sources use solid deuterium (D2) to down-scatter cold or thermal neutrons to UCN energies[7, 8, 9, 10]. Since it was first proposed and investigated[11, 12, 13], considerable recent effort has gone into understanding UCN production in D2[15, 16, 17, 18]. Deuterium is chosen for its low neutron absorption cross-section, low incoherent scattering cross-section (to minimize UCN elastic scattering within the source), and the presence of numerous phonon modes which can inelastically scatter neutrons down to UCN energies. However, aside from these phonon modes, the free rotation of D2 molecules can cause incoherent up-scattering (i.e. loss) of UCN in the deuterium. In order to suppress this up-scattering, the D2 sample is converted to the (ortho) state using paramagnetic catalysts[15, 19].
Solid N2 is a potential alternative to deuterium: its absorption cross-section is only % of that of D2, and it has a negligible incoherent scattering cross-section. Additionally, rotation of the N2 molecules in the lattice is inhibited due to the anisotropy of the N2 inter-molecular potential. This leads to dispersive modes for the rotational degrees of freedom (librons) which provide additional channels for neutron down-scattering, and eliminates the rotational incoherent up-scattering prevalent in D2.
Due to the primarily classical nature of its inter-molecular potential, the anharmonicity of the angular degrees of freedom, and phonon/libron coupling, solid nitrogen has been a testing-ground for ab initio lattice and molecular dynamics calculations[20]. Several models exist which utilize inter-molecular or atom-atom potentials of various forms[21, 22, 23, 24, 25, 26], and anharmonic effects have also been investigated experimentally and theoretically[27, 28, 29, 30]. Past interest notwithstanding, there is little data on the dynamical structure factor of -N2 from neutron scattering[31].
In this letter, we present a measurement of the dynamics of N2 using neutron scattering in order to investigate the performance of nitrogen as a UCN converter. The dynamical structure factor is measured using the time-of-flight (TOF) technique; the total scattering cross-section is then analyzed to determine the absolute intensity of the scattering. From this, the cross-section to convert neutrons to UCN energy is computed.
2 Experiment
The dynamical structure factor is measured using the IN4 TOF spectrometer at the Institut Laue Langevin (ILL) using incident neutrons of wavelength [32]. The sample environment, cryostat, and sample control system are the same as that used for previous studies of oxygen and deuterium as UCN converters[15, 34]. This provides a means of direct comparison between the different converters. Gaseous 15N2 (99.4% isotopic purity) is introduced into the mm annular cell through a needle valve, and condensed using the ILL’s orange helium-exchange cryostat (see [15, 34] for details). The detector array is calibrated using an isotropically scattering vanadium sample. The dynamical structure factor and related quantities are computed using the ILL’s standard data treatment software LAMP[33].
Total scattering from the sample cell is measured while condensing nitrogen to assure that the cell is completely filled, and the sample temperature is then lowered to the solid -phase. In order to ensure that the nitrogen sample did not consist of macro-crystals, the elastic scattering intensity is analyzed for various annealing times at the phase transition. We find little variation in the elastic peaks for different annealing times.
Data are then acquired with nitrogen at temperatures of , , , , and K. A background measurement of the empty cell is performed at K. The inelastic scattering background due to the aluminum phonons is temperature dependent, especially on the anti-Stokes () side, according to the Bose-Einstein occupation factor . We thus rescale the background intensity by the relative change in occupation number (as a function of ) prior to subtracting it from the nitrogen data. This is particularly important for computing UCN up-scattering mean free path for K (see below), where it is a % effect if uncorrected.
We also perform measurements using 14N2, and find that the dynamical structure is the same as that for 15N2, with a difference in scattering intensity commensurate with the isotopic difference in total scattering cross-section (). For this reason, data with 14N2 are used for the determination of the temperature dependence of the dynamical structure factor due to the accumulation of better statistics. The results are scaled by the above factor to determine the absolute 15N2 cross-sections.
3 Results
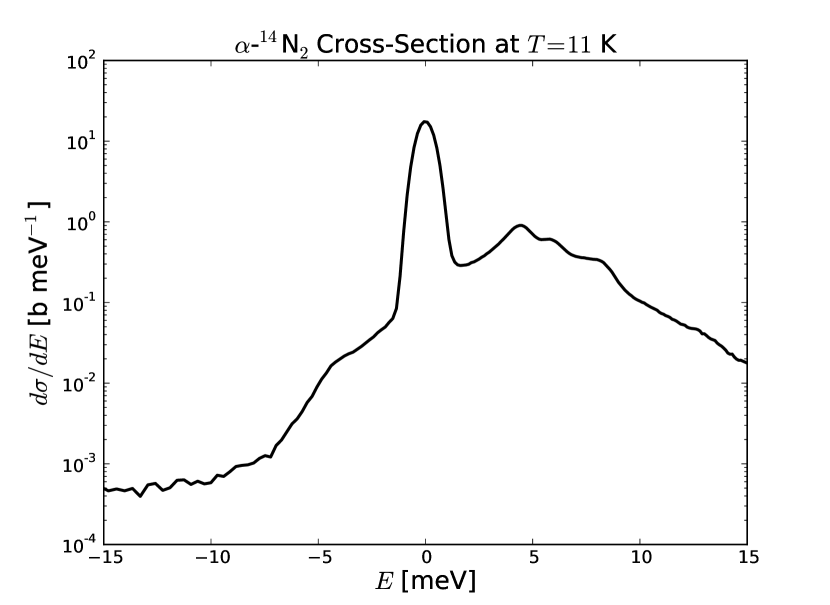
The differential scattering cross-section is shown in fig. 1. The vertical scale factor is set by demanding that
| (1) |
where is the total scattering cross-section per molecule. We find b, with the % uncertainty due primarily to the unknown contribution of scattering intensity outside the kinematic range of the instrument. The factor has units of barns so as to convert the data (which has an arbitrary normalization) into a cross-section. This normalization factor is used below to calculate the absolute UCN production and up-scattering cross-sections.
The dynamical structure factor (averaged over orientations of due to the polycrystallinity of the sample) is shown in fig. 2. The intensity at has peaks at , , and meV, in reasonable agreement with the Tg, Au, and Tu modes predicted by Kjems and Dolling[31]. However, it is difficult to comprehensively compare the data to various dynamical models due to the low energy resolution of the TOF method, as well as the polycrystalline nature of the sample.
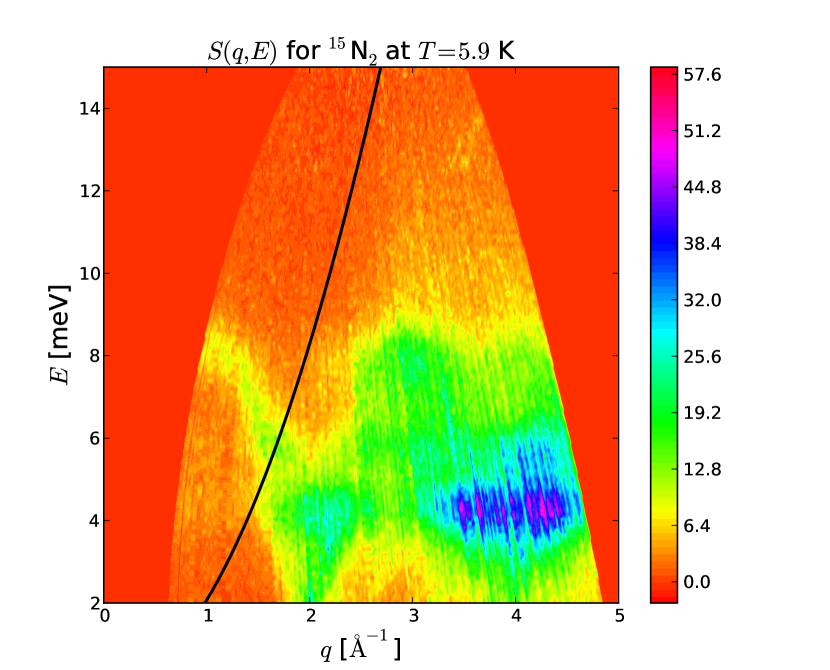
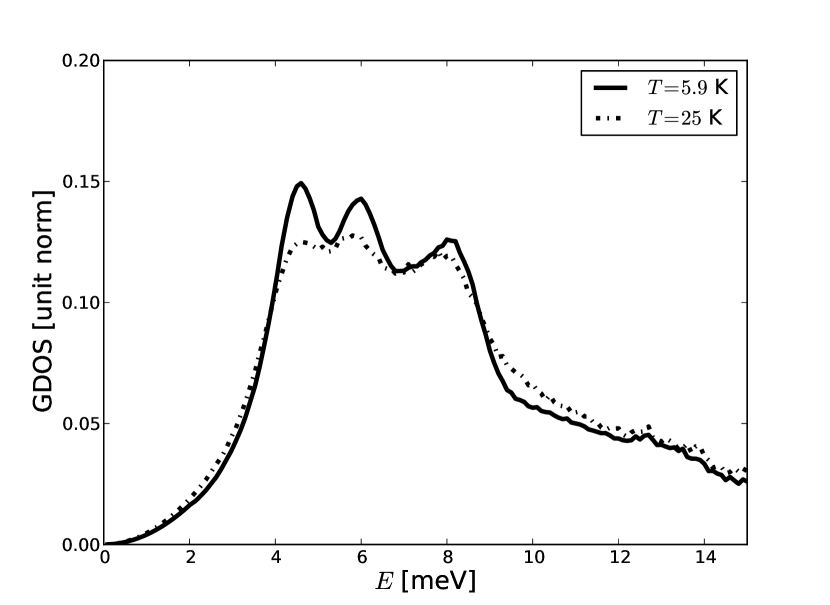
Fig. 3 shows the Generalized Density-Of-States (GDOS), which exhibits prominent peaks from one-phonon states, and broad low-lying intensity due to multi-phonon processes. Elastic contamination is removed by fitting the GDOS to for meV. The peaks in the to meV range broaden with increasing temperature due to phonon and libron conversion and dephasing, which has been studied experimentally in detail using infrared and Raman spectroscopy[28, 29].
4 Discussion
The black line in fig. 2 corresponds to the kinematical condition necessary for UCN down-scattering. As UCN energies are much less than cold and thermal neutron energies, we take the UCN energy and arrive at the following relation for the wave-vector transfer and energy transfer :
| (2) |
with the plus sign for UCN production, and minus sign for UCN up-scattering.
The intensity of parameterized along the curve given in eqn. 2 is then proportional to the cross-section to nearly “stop” a cold neutron, thereby converting it to a UCN. The UCN production cross-section versus incident energy integrated over final UCN energy from to some maximum UCN energy is given by
| (3) |
Upon escaping the nitrogen volume, UCN are boosted by the solid 15N2 Fermi potential of neV. We choose neV, which corresponds to a trappable energy of neV, commensurate with UCN production cross-section calculations in [34].
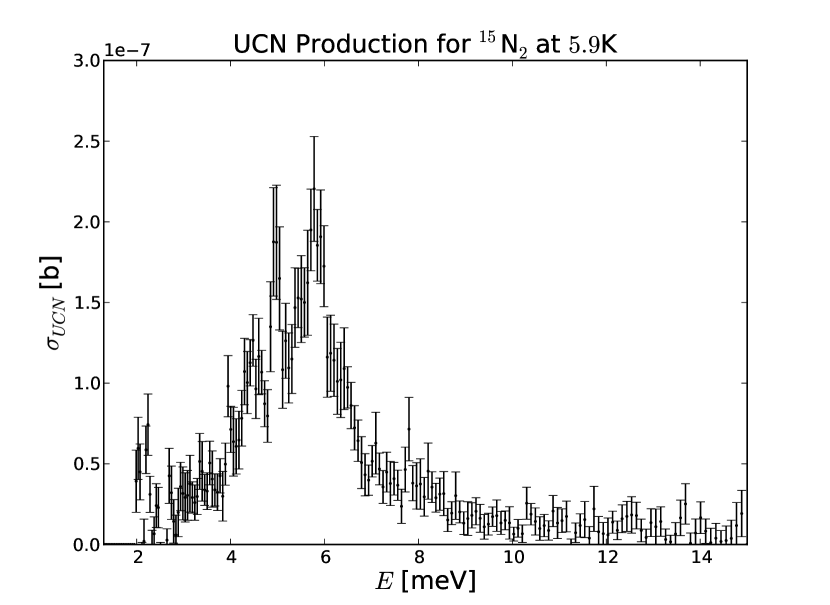
The energy-dependent production cross-section is shown in fig. 4. Production peaks near meV, most probably due to a combination of vibrational and librational down-scattering channels. The production cross-section can vary with temperature due to the temperature dependence of normal mode frequencies and their widths in the -phase: we find the variation in the cross-section to be no more than % in the range of to K (increasing slightly with increasing temperature).
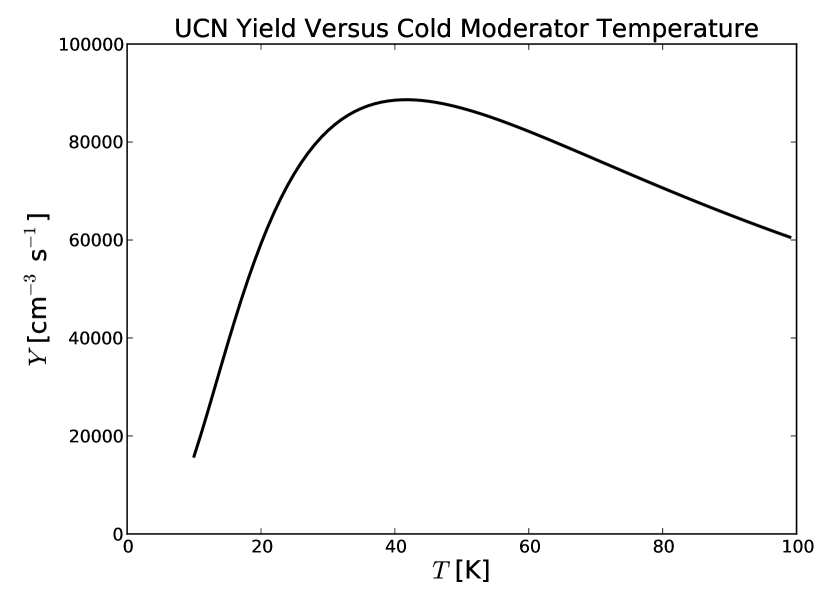
From the above, an estimated rate of UCN production in a source using 15N2 can be estimated, making reasonable assumptions about the incident neutron flux. For a UCN source illuminated with the neutron flux from a cold moderator at temperature , we define the UCN yield to be
| (4) |
where cm-3 is the number density of 15N2, and the cold neutron flux is given by
| (5) |
From this, we find an optimal moderator temperature of K (see fig. 5). For a UCN source with total incident cold neutron flux flux cm-2 s-1 at K, the yield is approximately UCN per second per cm3 of source volume.
In order to extract a UCN from the source for use in an experiment, its mean free path must be comparable to or larger than the thickness of the source. The mean free path contains contributions from different processes:
| (6) |
where corresponds to UCN up-scattering to non-UCN energies, to nuclear absorption, and to UCN elastically scattering within the nitrogen volume. Even for relatively poor isotopic purity, the incoherent scattering mean free path is negligibly long. The absorption mean free path is highly dependent on the isotopic purity, and purity % or higher is necessary for up-scattering to be the dominant contribution to the mean free path.
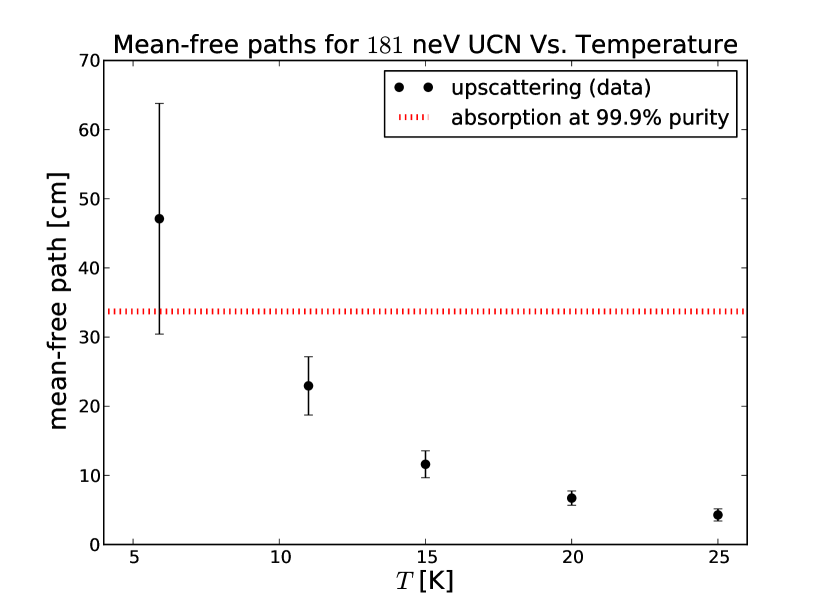
The (temperature dependent) up-scattering cross-section of UCN in the nitrogen can be computed from the data by choosing the minus sign in eqn. 2 and integrating over the final state energy:
| (7) |
We compute for UCN with neV for a range of temperatures (see fig. 6). We observe an increased with decreasing temperature due to the smaller population of lattice modes that can induce up-scattering. At K, the data suggest an up-scattering mean free path of approximately cm, which is greater than the thickness of D2 sources, such as the Los Alamos source ( cm) or the PSI source ( cm)[7, 9]. The thickness of a UCN source using 15N2 could therefore be made larger than a D2 source, the latter of which is limited by its cm incoherent scattering mean free path.
5 Conclusions
The dynamical structure factor of solid N2 has been measured over a range of temperatures. No appreciable difference in dynamics is observed between 14N2 and 15N2, and there is reasonable qualitative agreement between our data and previous studies of the dynamics of solid -nitrogen. However, a higher resolution neutron scattering technique would be necessary to thoroughly investigate the rich structure of the vibrational and librational modes.
The absolute UCN production cross-section is determined by normalizing the scattered intensity to the total molecular cross-section of the sample. The cross-section peaks strongly near meV, and the optimal incident cold neutron temperature is K. The measured cross-section is found to be somewhat lower than that of D2 and O2 (see [34]). However, we observe an up-scattering mean free path substantially longer than that of D2. Thus, for sufficiently high isotopic purity, an N2 source could be large while maintaining efficient UCN extraction to compensate for the lower production cross-section.
Further, a nitrogen-based source may benefit from operating temperatures below those used here, if the up-scattering cross-section can be further reduced at lower temperatures ( K). While deuterium is ultimately limited by its temperature independent absorption and incoherent scattering mean free paths, further improved isotopic purity of 15N may make an even lower temperature nitrogen volume a promising candidate for a new UCN source. This motivates future work in performing direct measurements of slow neutron mean free paths and UCN production rates in 15N2.
6 acknowledgments
This work is supported by the cluster of excellence “Origin and Structure of the Universe” Exc. 153 and the Maier-Leibnitz-Laboratorium (MLL) of the Technische Universität München and Ludwig-Maximilians-Universität München. Author DJS is supported by the DOE Office of Science Graduate Fellowship Program (DOE SCGF), made possible in part by the American Recovery and Reinvestment Act of 2009, administered by ORISE-ORAU under contract no. DE-AC05-06OR23100.
We thank S. Rols for the development of some of the TOFHR LAMP routines used in the analysis and for the management of the IN4 instrument. We also thank O. Meulien for assistance with the sample preparation and gas handling system.
References
- [1] R. Golub, D. Richardson, and S.K. Lamoreaux. Ultra-Cold Neutrons. Taylor & Francis (1991).
- [2] V.K. Ignatovich. The Physics of Ultracold Neutrons. Clarendon Press (1990).
- [3] T. Bhattacharya, et. al. Phys. Rev. D 85 (2012) 054512.
- [4] D. Dubbers and M.G. Schmidt. Rev. Mod. Phys. 83 (2011) 1111-1171.
- [5] H. Abele. Prog. in Part. Nucl. Phys. A 60 (2008) 1-81.
- [6] J.S. Nico. J. Phys. G: Nucl. Part. Phys. 36 (2009) 104001.
- [7] A. Saunders, et. al. Rev. Sci. Instr. 84 (2013) 013304.
- [8] U. Trinks, et. al. Nucl. Instrum. Methods Phys. Res. A 440 (2000) 666-673.
- [9] A. Anghel, et. al. Nucl. Instrum. Methods Phys. Res. A 611 (2009) 272-275.
- [10] E. Korobkina, et. al. Nucl. Instrum. Methods Phys. Res. A 579 (2007) 530.
- [11] R. Golub and K. Böning. Z. Phys. B 51 (1983) 95-98.
- [12] Yu.N. Pokotilovski. Nucl. Instrum. Methods Phys. Res. A 356 (1995) 412-414.
- [13] A. Serebrov, et. al. JETP Lett. 50 (1994) 11.
- [14] A. Serebrov, et. al. JETP Lett. 62 (1995) 10.
- [15] A. Frei, et. al. Phys. Rev. B 80 (2009) 064301.
- [16] C.-Y. Liu, A.R. Young, and S.K. Lamoreaux. Phys. Rev. B 62 (2000) 6.
- [17] F. Atchison, et. al. Nucl. Instrum. Methods Phys. Res. A 611 (2009) 252-255.
- [18] F. Atchison, et. al. Phys. Rev. Lett. 99 (2007) 262502.
- [19] C.-Y. Liu, et. al. Nucl. Instrum. Methods Phys. Res. A 508 (2003) 257-267.
- [20] T.A. Scott. Phys. Rep. 27 (1976) 89-157.
- [21] T. Luty and G.S. Pawley. Chem. Phys. Lett. 28 (1974) 4.
- [22] G. Filippini, et. al. Chem. Phys. Lett. 40 (1976) 2.
- [23] S. Romano, B. Jönsson, and G. Karlström. Int. J. Quantum Chem. XXIII (1983) 991-998.
- [24] G. Cardini and S.F. O’Shea. Phys. Rev. B 32 (1985) 4.
- [25] D.A. Goodings. Can. J. Phys. 55 (1976) 573-577.
- [26] T.H.M. van den Berg, M.M.G. Bongers, and A. van der Avoird. J. Phys.: Condensed Mat. 2 (1990) 8015.
- [27] S. Califano and V. Schettino. Int. Rev. Phys. Chem. 7:1 (1988) 19-57.
- [28] R. Ouillon, et. al. J. Chem. Phys. 93 (1990) 3005.
- [29] R. Bini. J. Chem. Phys. 104 (1996) 4365.
- [30] R.G. Della Valle, G.F. Signorini, and P. Procacci. Phys. Rev. B 55 (1997) 22.
- [31] J.K. Kjems and G. Dolling. Phys. Rev. B 11 (1975) 4.
- [32] H. Mutka. Nucl. Instrum. Methods Phys. Res. A 338 (1994) 144.
- [33] D. Richard, M. Ferrand, and G.J. Kearley. J. Neutron Res. 4 (1996) 33-39.
- [34] E. Gutsmiedl, et. al. Europhys. Lett. 96 (2011) 62001.