11email: stefan.uttenthaler@univie.ac.at
Period – mass-loss rate relation of Miras with and without technetium ††thanks: Table LABEL:taba1 is only available in electronic form at the CDS via anonymous ftp to cdsarc.u-strasbg.fr (130.79.128.5) or via http://cdsweb.u-strasbg.fr/cgi-bin/qcat?J/A+A/.
Abstract
Aims. We report the discovery that Mira variables with and without absorption lines of the element technetium (Tc) occupy two different regions in a diagram of near- to mid-infrared colour versus pulsation period. Tc is an indicator of a recent or ongoing mixing event called the third dredge-up (3DUP), and the near- to mid-IR colour, such as the colour where [22] is the the 22 m band of the WISE space observatory, is an indicator of the dust mass-loss rate of a star.
Methods. We collected data from the literature about the Tc content, pulsation period, and near- and mid-infrared magnitudes of more than 190 variable stars on the asymptotic giant branch (AGB) to which Miras belong. The sample is naturally biased towards optical AGB stars, which have low to intermediate (dust) mass-loss rates.
Results. We show that a clear relation between dust mass-loss rate and pulsation period exists if a distinction is made between Tc-poor and Tc-rich Miras. Surprisingly, at a given period, Tc-poor Miras are redder in than are Tc-rich Miras; i.e. they have higher mass-loss rates than the Tc-rich Miras. A few stars deviate from this trend; physical explanations are given for these exceptions, such as binarity or high mass.
Conclusions. We put forward two hypotheses to explain this dichotomy and conclude that the two sequences formed by Tc-poor and Tc-rich Miras are probably due to the different masses of the two groups. The pulsation period has a strong correlation with the dust-mass loss rate, indicating that the pulsations are indeed triggering a dust-driven wind. The location in the vs. period diagram can be used to distinguish between pre- and post-3DUP Miras, which we apply to a sample of Galactic bulge AGB stars. We find that 3DUP is probably not common in AGB stars in the inner bulge.
Key Words.:
Stars: AGB and post-AGB – Stars: late-type – Stars: evolution – Stars: mass-loss – Stars: oscillations1 Introduction
Miras are long-period variables in the asymptotic giant branch (AGB) phase of evolution of low- to intermediate mass stars. On the AGB, rich nucleosynthesis processes build up heavy elements in the deep interior of the star, most notably carbon and elements produced by the slow neutron-capture process (s-process, e.g. Busso et al.,, 1999). One of the elements produced by the s-process is technetium (Tc), which only has radioactively unstable isotopes. The products of nuclear burning are brought to the surface of the star by a deep mixing event called the third dredge-up (3DUP), which may happen after a powerful ignition of the He-burning shell, called a thermal pulse (TP). As a result, this phase is also referred to as the TP-AGB. The dredge-up of C may eventually turn an initially oxygen-rich (M-type, ) into a carbon star (C-type, ). Not every TP will be followed by a 3DUP mixing event; in particular, the first few (weak) TPs are thought to not be followed by 3DUP. It is thought that all powerful pulses on the upper AGB are followed by a 3DUP event, though current models require a parameterization to describe the mixing process (e.g. Cristallo et al.,, 2011). Lines of Tc, observable between 4200 – 4300 Å, can be used as a safe indicator of recent or ongoing 3DUP (e.g. Uttenthaler et al.,, 2007). It is important to know which stars undergo 3DUP, because only these can supply the interstellar matter with heavy elements.
The envelope of a Mira pulsates with a period of 100 to 1000 days, thereby causing the light variability. The pulsations are thought to play a crucial role in the mass-loss process from AGB stars because they lift dense atmospheric material to distances where temperatures are low enough to form dust grains that are pushed away from the star by radiation pressure, thereby dragging the gas along. This is a well-understood process in C-stars (e.g. Höfner & Dorfi,, 1997; Winters et al.,, 2000; Wachter et al.,, 2002; Nowotny et al.,, 2010, 2011), but not in the oxygen-rich case (Woitke,, 2006). As recently proposed, light scattering off large transparent silicate grains may be the driving mechanism in M-type giants (Höfner,, 2008; Bladh & Höfner,, 2012; Norris et al.,, 2012). The correlation between mass-loss rate and pulsation period is not very clear in observed samples (e.g. Jura et al.,, 1993), becomes apparent only when Miras with very long pulsation periods ( d) are included (Vassiliadis & Wood,, 1993; Groenewegen et al.,, 2009), or when the selection is restricted to C-rich Miras (Whitelock et al.,, 2006).
Near- to mid-infrared colours are a frequently used indicator for the dust mass-loss rate () of AGB stars. Traditionally, the colour, where is the magnitude in the IRAS 12 m band, has been used extensively (e.g. Whitelock et al.,, 1994, 2006). This type of colour is sensitive to the dust mass-loss rate because the near-IR (e.g. the K-band) probes the photosphere of the star, while in the mid-IR (e.g. [12]) a lot of the light is emitted by the dusty envelope of the star. The total mass loss of a star is, however, dominated by the gas mass-loss rate , which is related to via the gas-to-dust ratio .
In this paper we present the discovery that Tc-poor and Tc-rich Miras fall in two different regions in a diagram of near- to mid-IR colour (i.e. ) versus pulsation period. In both regions, the stars follow a clear trend towards increasingly red colour with increasing period. The separation in the two regions is particularly clear when using the K-band magnitude for the near-IR and the 22 m band of WISE ([22]) as mid-IR photometry source.
2 The data
Information on the Tc content was compiled from the following sources: Little et al., (1987), Smith & Lambert, (1988), Vanture et al., (1991), Lebzelter & Hron, (1999), Van Eck & Jorissen, (1999), Van Eck et al., (2000), Lebzelter & Hron, (2003), Uttenthaler et al., (2007), Uttenthaler & Lebzelter, (2010), Uttenthaler et al., (2011), and Smolders et al., (2012). Further data on the Tc content of carbon stars was taken from Abia et al., (2002) and Barnbaum (priv. comm., see also Barnbaum & Morris,, 1993). Only classifications “Tc no” and “Tc yes” were taken into account, “doubtful”, “possible”, and “probable” cases were disregarded. The different literature sources used data of various resolutions and signal-to-noise ratios (S/N), though a resolving power of is mandatory to safely detect the Tc lines in the crowded spectra of cool red giants. Several of the sample stars have been observed for their Tc content two or more times, and the results generally agree with each other. Nevertheless, it cannot be excluded that there are individual objects in the current sample that are misclassified with respect to their Tc content, though that fraction should be very small.
Those S- and C-type stars without a detection of Tc were not included in the sample. Thus, we reject any stars that owe their enrichment in C and s-process elements to mass transfer in a binary system and not to intrinsic nuclear processing and mixing. The present sample is naturally biased towards stars with low circumstellar extinction because the Tc lines are located in the blue spectral range, so that stars in the late superwind phase of the AGB are missing. Also, most sample stars have periods shorter than 500 d. It is known that the number density of optically visible Mira variables drops sharply between and 500 d (Wood & Cahn,, 1977).
Since Miras also show pronounced photometric variability in the near-IR, we made certain to use time-averaged magnitudes in these bands whenever available. Bands that mainly probe the photosphere of the star (i.e. the J- and K-bands, but also COBE/DIRBE mean fluxes in the 1.25 and 2.2 m bands) were collected from the following sources: Catchpole et al., (1979), Fouque et al., (1992), Whitelock et al., (1994), Kerschbaum & Hron, (1994), Kerschbaum, (1995), Kerschbaum et al., (1996), Whitelock et al., (2000), Skrutskie et al., (2006), Whitelock et al., (2006), Whitelock et al., (2008), and Price et al., (2010). The J- and K-band photometry was converted to the 2MASS system using the relations of Carpenter, (2001). Mid-IR photometry from IRAS, Akari (Ishihara et al.,, 2010), and WISE (Wright et al.,, 2010) was collected via VizieR111http://vizier.u-strasbg.fr/viz-bin/VizieR. In the following, these will be referred to as [12], [25], and [60] for the IRAS 12, 25, and 60 m bands; [9] and [18] for the Akari 9 and 18 m bands; and [22] for the WISE 22 m band.
Periods were taken mainly from Templeton et al., (2005) where available, or were also collected from VizieR. Preference was given to sources with available light curves that allowed for a critical evaluation of the period, such as ASAS (Pojmański,, 1998). Since some Miras have pulsation periods that change significantly in time (Wood & Zarro,, 1981; Templeton et al.,, 2005), we also analysed visual photometry from the AAVSO database222www.aavso.org and determined present-day periods with the program Period04 (Lenz & Breger,, 2005).
In total, data of 197 stars were collected. The data are presented in Table LABEL:taba1 in the on-line Appendix.
3 Results
Initially, we discovered that Tc-poor and Tc-rich Miras fall into two different regions in diagrams involving [12], [25], and [60], as well as [9] and [18] as mid-IR bands. However, it later turned out that the separation is clearest when using the colour. The WISE catalogue has advantages because of its all-sky coverage, its relatively high spatial resolution ( in the 22 m band), hence little source confusion, and its high sensitivity. The vs. pulsation period diagram of the Miras is presented in Fig. 1 and discussed in the following. Also Tc-rich semi-regular variables (SRVs) form a sequence of increasing colour at short periods ( d), but since their periods are less well-defined than those of the Miras we do not discuss them in detail here.
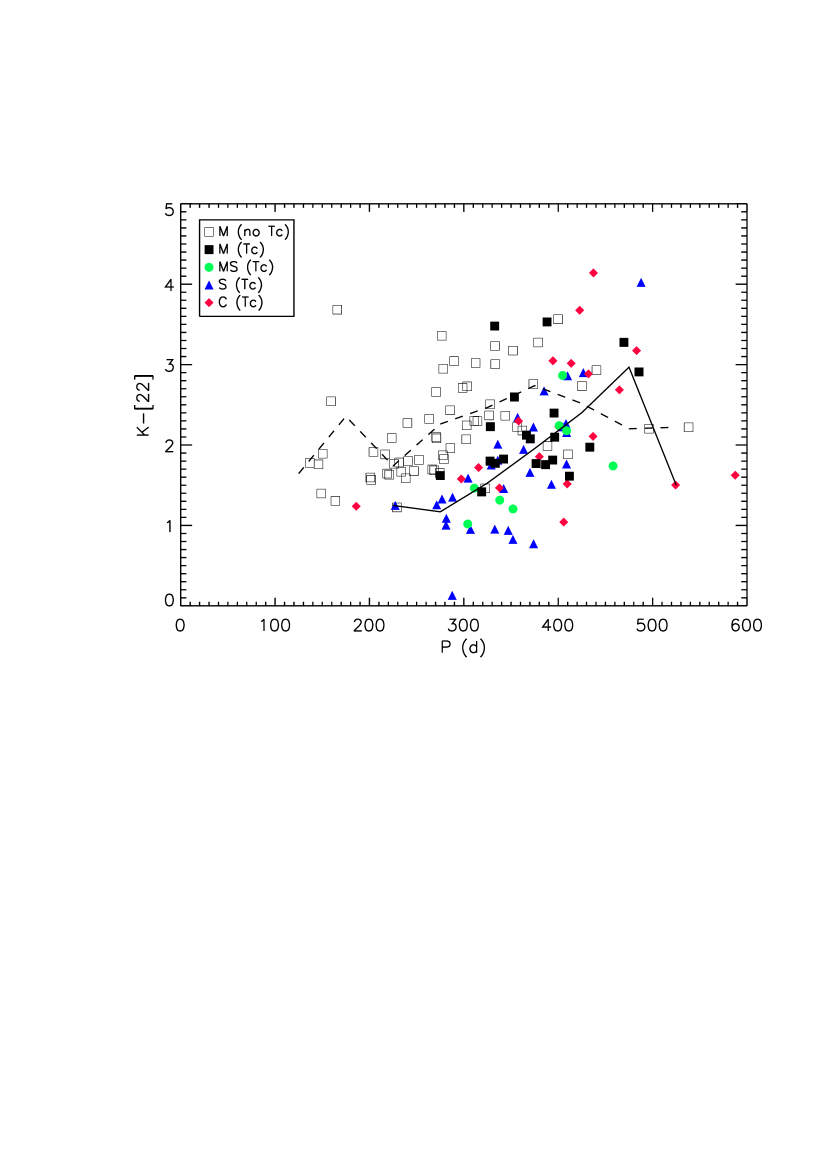
As can be seen from Fig. 1, the Tc-poor stars are redder in than the Tc-rich stars over a wide range in period. The run of the mean colour in 50 d period bins of the Tc-poor and Tc-rich stars shows that the difference is between and days of period. The distribution of stars is counter-intuitive because one might naively expect the Tc-rich stars to be more evolved than the Tc-poor ones, thus to have longer pulsation periods and higher dust mass-loss rates (redder colours). An interpretation of the distribution is attempted in Sect. 4.
In the meantime, we can notice several facts from this diagram. The two regions occupied by the Tc-poor and Tc-rich stars follow a trend towards increasing mass-loss rate with increasing period. This contrasts with previous results where no such clear trend was found (Jura et al.,, 1993). At d period, the two regions seem to be merging. Interestingly, all Tc-rich stars share roughly the same region in the diagram, regardless of being M-type (no ZrO bands), MS- (weak ZrO), S- (strong ZrO), or C-type (C2 and CN bands) stars.
There are two Tc-rich M-type stars (at d and 388 d) and one S-type star (at d) that have a much redder colour than other Tc-rich stars of the same spectral type and comparable periods. These deviating stars are $o$ Cet, R Aqr, and W Aql, all of which have close binary companions. The dusty environment of R Aqr and W Aql as observed in the far-IR is discussed in Mayer et al., (2013). It is possible that owing to the binary motion and/or tidal interaction, the companion causes an enhanced mass-loss rate from the AGB primary stars.
The star R Cet is a red, Tc-poor outlier (at d). Regarding the possibility that binary AGB stars suffer enhanced mass loss, we suggest that R Cet is also a member of a binary system. No information on a possible binary nature of R Cet was found in the literature, so this is somewhat speculative.
There are also Tc-poor, long-period outliers in the diagram. The two stars at d and 538 d are R Nor and R Cen. They are suspected of being intermediate-mass stars () undergoing hot bottom burning (HBB; e.g. Boothroyd et al.,, 1995), as signaled by their large lithium abundance (Uttenthaler et al.,, 2011; García-Hernández et al.,, 2013). It was suggested by observations that the 3DUP efficiency is low in these stars (García-Hernández et al.,, 2007), at least as long as the stars are on the early AGB with low mass-loss rates. As mentioned, highly obscured stars are missing in the sample because the Tc lines cannot be investigated for them. Other putative intermediate-mass, Tc-poor stars, such as W Hya at d, may be the cause of a slight dilution of the otherwise clear separation of Tc-poor from Tc-rich Miras.
There are also two long-period C-type stars with relatively blue colours in Fig. 1 (at d and 588 d); these are BH Cru and LX Cyg. They have changed their spectral type from SC to C only in the past decades, at the same time undergoing a strong increase in pulsation period. They are thus candidates for a recent 3DUP event, and so their mass-loss rates are expected to rise in the next centuries. Two forthcoming papers will be dedicated to these stars (Uttenthaler et al., in preparation).
4 Discussion
4.1 Attempt of interpretation
How can we interpret the two sequences? How do stars evolve in this diagram? We find from our data that Tc-poor and Tc-rich M- and MS-type stars are indistinguishable in their colour, so the reason for the separation in the colour cannot be any effect of increased molecular absorption in the K-band (and thus relatively fainter magnitudes). The reasons must therefore lie in the mid-IR bands. We propose two hypotheses.
Hypothesis 1: Third dredge-up events cause an increase in pulsation period and/or change the mass-loss properties: for example decrease the total mass-loss rate, increase the gas-to-dust ratio, and/or decrease the wind velocity of Miras. In this scenario, the stars start out as Tc-poor Miras, evolve towards longer period and redder colour until at some point they undergo a 3DUP event. The 3DUP brings up Tc but also C, thereby decreasing the free O in the atmosphere. The decreased amount of free O (most of it will be locked up in the CO molecule) changes the (molecular) opacities in the atmosphere that may lead to an increase in period and/or that changes the mineralogy and amount of the dust grains in a way that leads to less redistribution of stellar radiation from the near- to the mid-IR (bluer colour). After dredge-up, the star continues to evolve to longer period and higher mass-loss rate along the sequence of the Tc-rich Miras. In this scenario, the stars evolve along zigzag paths in this diagram.
Hypothesis 2: The two sequences are the result of different masses of the Tc-poor and Tc-rich stars. The stars that undergo 3DUP already do so before they start pulsating in the fundamental mode (Mira), that is, they may be irregular variables or SRVs when they undergo 3DUP, and only later become a Mira to show up in this diagram. They start out with a longer pulsation period when they become Miras, at a still relatively low mass-loss rate. Stars with lower masses, which are those that will never undergo a 3DUP event or do so only very late in their evolution, start out with shorter periods, but will have a higher mass-loss rate at a given period than do Tc-rich stars. The lower mass results in lower surface gravity, which eases mass loss.
We favour Hypothesis 2 for the following reasons. The two sequences are visible when using different sources of mid-IR photometry, from Akari [9] to IRAS [60]. This would mean that no individual dust feature causes the dichotomy, but rather a broad difference in near- to mid-IR flux between Tc-poor and Tc-rich stars, respectively. Thus, it could only be caused by featureless dust species. It has been suggested that amorphous carbon and metallic iron (McDonald et al.,, 2010) are present in the envelopes of C- and O-rich AGB stars, respectively. However, it is not immediately clear why a decrease in free O by 3DUP should lead to decreased formation of metallic iron grains (i.e. increased gas-to-dust ratio), thereby decreasing the mid-IR flux. Also, it would not be clear why Tc-rich M-type stars and C-type stars would then occupy roughly the same region in this diagram. On the other hand, an increase in the pulsation period by changing molecular opacities is only expected at the transition from M- to C-type stars (Lebzelter & Wood,, 2007). Furthermore, the difference in C/O between Tc-poor and Tc-rich M-type stars is expected to be small because the only difference seen in their spectra is in the Tc lines; Tc-rich M-type stars do not show any signs of ZrO bands in their spectra, which would indicate an enhanced C/O ratio. It is not clear how a small difference in C/O could lead to such a strong decrease in the mid-IR flux. After all, the stars are not expected to be formed with exactly the same C/O ratio, thus a little enhanced primordial C/O ratio would already shift a Tc-poor star into the Tc-rich regime. This is, however, not observed. Finally, the Tc-poor, intermediate-mass stars (e.g. R Nor and R Cen) may occupy another region at an even longer pulsation period, such that we have a sequence of increasing mass with increasing period, at a given mass-loss rate. In conclusion, it is unclear how a 3DUP event and the connected change of the chemistry could affect the pulsation period or the global mass-loss properties of a Mira variable.
The only drawback of Hypothesis 2 may be that there are no Tc-poor Miras observed at the base of the Tc-rich sequence. Some stars may be expected to undergo 3DUP only once they are in the Mira pulsation mode. It is possible, though, that 3DUP, hence Tc enrichment, start early on the AGB, as suggested by Jorissen et al., (1993), before Mira pulsation starts.
A test for Hypothesis 2 is the average distance of the stars from the Galactic plane. More massive, younger stars are expected to have a smaller Galactic scale height than less massive, older stars. To derive the distance to the stars, we applied the period-magnitude relation for fundamental-mode pulsators of Riebel et al., (2010, relation for all stars in Sequence 1 in their Table 6), assuming a distance modulus to the Large Magellanic Cloud of 1850. With this approach we find that the 49 Tc-poor, M-type Miras (excluding the bulge stars and the putative intermediate-mass stars R Nor and R Cen) have a mean absolute distance from the plane pc (median 431 pc), whereas the 74 Tc-rich Miras (all spectral types, excluding bulge stars) have pc (median 308 pc). Even if selection biases may plague this comparison, this result clearly argues in favour of the idea that we are dealing with two groups of different average masses. Different mass is a necessary but not sufficient condition for Hypothesis 2 to be correct. The sufficient condition would be that heavier stars start their Mira phase at longer periods and at lower mass-loss rates than less massive stars.
4.2 Application to Galactic bulge AGB stars
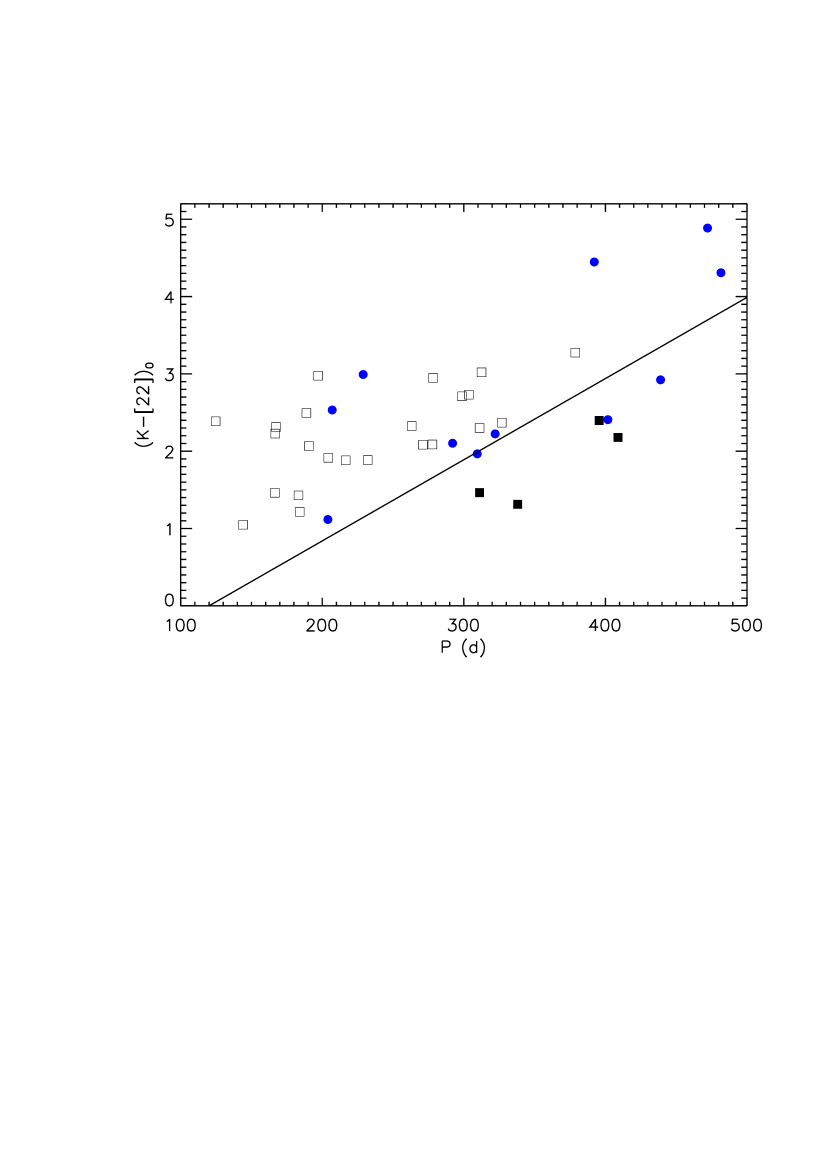
The separation between Tc-poor and Tc-rich Miras in the vs. diagram is so clear that it may actually be used to distinguish stars that did undergo a 3DUP event from those that did not. A line to separate pre- from post-3DUP stars may be drawn between the points and . In Fig. 1, 85.4% of the Tc-poor Miras are above this line and 87.2% of the Tc-rich Miras (all spectral types) below this line. As a result, pre-3DUP Miras can be distinguished from Miras that underwent a 3DUP event with 85% confidence. We plot this dividing line in Fig. 2, which includes AGB stars in the outer Galactic bulge (Plaut’s field) that have been investigated for the presence of Tc by Uttenthaler et al., (2007). These stars are also included in Fig. 1. The question of 3DUP in bulge stars is interesting because of the known lack of intrinsic carbon stars in the Galactic bulge (e.g. Ng,, 1997) and the question of mass and age of bulge stars connected to this. The line separates Tc-poor from Tc-rich stars of the Plaut sample well. The second group of stars included in Fig. 2 are AGB stars from the inner and intermediate bulge from Uttenthaler et al., (2013) whose near-IR spectra have been studied at high resolution. No information on the Tc content of these stars is available. The photometry of these stars has been de-reddened because they are located in bulge fields with considerable interstellar extinction. Only stars with d from that sample are shown because the shorter period stars are probably SRVs. All of the bulge stars are O-rich, M-type stars, and only three of the Tc-rich Plaut stars are of type MS (weak ZrO bands).
Three stars from the inner and intermediate bulge fall below the dividing line and are thus 3DUP candidates. The one at d (J174128.5-282733) was found to have and , but these values need to be considered as uncertain due to the poor fit achieved to its near-IR spectrum. Nevertheless, both these ratios are typical of the sample investigated by Uttenthaler et al., (2013) and are at the lower limit of what is expected for a star that underwent 3DUP (Smith & Lambert,, 1990). The other two stars at d and 439 d (J175432.0-295326 and J174127.3-282851) have very complex near-IR spectra from which it was impossible to derive the C/O or carbon isotopic ratio. Also, they are in a region in the vs. period diagram where Tc-poor and Tc-rich stars are intermingled. Even if no clear conclusion on the 3DUP behaviour of these two stars can be drawn, it seems that 3DUP is not wide-spread in this sample of AGB stars in the intermediate and inner bulge, as also concluded by Uttenthaler et al., (2013). It appears that relatively high metallicity () and too low a mass (, see Uttenthaler et al.,, 2013) act together to prevent efficient 3DUP from forming carbon stars in the Galactic bulge. The Tc-rich Plaut stars in the outer bulge probably have somewhat lower metallicity (Uttenthaler et al.,, 2012), which would allow for some 3DUP to take place.
5 Conclusions
In this paper we showed that Mira variables with and without absorption lines of technetium occupy two different regions in a diagram of near- to mid-IR colour () versus pulsation period. Both groups of stars follow a trend towards increasing () (dust mass-loss rate) with increasing period. This clear correlation between pulsation period and mass-loss rate has not been reported in the literature so far in this period range. Surprisingly, the Tc-poor stars have redder colours than the Tc-rich stars at any given period, implying that they have higher (dust) mass-loss rates. We propose two hypotheses for interpreting this dichotomy. The first one assumes an effect of the third dredge-up on the pulsation period or mass-loss properties of the stars (total mass-loss rate, gas-to-dust ratio, wind velocity). The second hypothesis explains the observed separation as an effect of the different masses of the two groups of Miras. The Tc-rich Miras would then undergo a dredge-up event early on the AGB when they are still semi-regular or irregular variables and would only become Miras later on, with relatively low mass-loss rates. Due to a number of arguments, we favour the second hypothesis. This conclusion is supported by the fact that Tc-rich Miras are on average more concentrated towards the Galactic plane, implying a younger age and a higher average mass of this group. If Hypothesis 2 is correct, it would mean that at a given pulsation period, more massive Miras have a lower mass-loss rate.
We note that the scenarios put forward to explain the dichotomy are complex and involve many details. It is beyond the scope of this paper to investigate the impact of an increased C/O ratio on the atmospheric structure and dust formation process or to study the evolution of stars with different masses in the vs. diagram. Nevertheless, these observations may constitute an important test of theoretical models of the evolution on the AGB, as well as of models of dynamic atmospheres and dust formation.
A correlation between pulsation period and colour (i.e. dust mass-loss rate) for Tc-poor and Tc-rich Miras, respectively, clearly supports the notion that pulsation-enhanced, dust-driven mass loss is also taking place in oxygen-rich, M-type stars (Bladh & Höfner,, 2012).
Acknowledgements.
The author thanks Cecilia Barnbaum for providing spectra and information on the technetium content of carbon stars, and Walter Nowotny and Stefan Meingast for careful reading of the manuscript and helpful discussion. The author acknowledges support from the Austrian Science Fund (FWF) under project P 22911-N16. We acknowledge with thanks the variable star observations from the AAVSO International Database contributed by observers worldwide and used in this research. This research has made use of the SIMBAD database and of the VizieR catalogue access tool, operated at CDS, Strasbourg, France. The original description of the VizieR service was published in A&AS 143, 23. This publication makes use of data products from the Wide-field Infrared Survey Explorer, which is a joint project of the University of California, Los Angeles, and the Jet Propulsion Laboratory/California Institute of Technology, funded by the National Aeronautics and Space Administration. This publication makes use of data products from the Two Micron All Sky Survey, which is a joint project of the University of Massachusetts and the Infrared Processing and Analysis Center/California Institute of Technology, funded by the National Aeronautics and Space Administration and the National Science Foundation.References
- Abia et al., (2002) Abia, C., Domínguez, I., Gallino, R., Busso, M., Masera, S., et al., 2002, ApJ, 579, 817
- Barnbaum & Morris, (1993) Barnbaum, C., & Morris, M., 1993, AAS, 182, 4617
- Bladh & Höfner, (2012) Bladh, S., & Höfner, S., 2012, A&A, 546, A76
- Boothroyd et al., (1995) Boothroyd, A. I., Sackmann, I.-J., & Wasserburg, G. J., 1995, ApJ, 442, L21
- Busso et al., (1999) Busso, M., Gallino, R., & Wasserburg, G. J., 1999, ARA&A, 37, 239
- Carpenter, (2001) Carpenter, J. M., 2001, AJ, 121, 2851
- Catchpole et al., (1979) Catchpole, R. M., Robertson, B. S. C., Lloyd-Evans, T. H. H., Feast, M. W., Glass, I. S., & Carter, B. S., 1979, South African Astronomical Observatory Circulars, 1, 61
- Cristallo et al., (2011) Cristallo, S., Piersanti, L., Straniero, O., Gallino, R., Domínguez, I., et al., 2011, ApJS, 197, 17
- Fouque et al., (1992) Fouque, P., Le Bertre, T., Epchtein, N., Guglielmo, F., & Kerschbaum, F., 1992, A&AS, 93, 151
- García-Hernández et al., (2007) García-Hernández, D. A., García-Lario, P., Plez, B., et al., 2007, A&A, 462, 711
- García-Hernández et al., (2013) García-Hernández, D. A., Zamora, O., Yagüe, A., Uttenthaler, S., Karakas, A. I., et al., 2013, accepted for publication in A&A Letters, arXiv:1306.2134
- Groenewegen et al., (2009) Groenewegen, M. A. T., Sloan, G. C., Soszyński, I., & Petersen, E. A., 2009, A&A, 506, 1277
- Höfner & Dorfi, (1997) Höfner, S., & Dorfi, E. A., 1997, A&A, 319, 648
- Höfner, (2008) Höfner, S., 2008, A&A, 491, L1
- Ishihara et al., (2010) Ishihara D., Onaka T., Kataza H., Salama A., Alfageme C., et al., 2010, A&A, 514, A1
- Jorissen et al., (1993) Jorissen, A., Frayer, D. T., Johnson, H. R., Mayor, M., & Smith, V. V., 1993, A&A, 271, 463
- Jura et al., (1993) Jura, M., Yamamoto, A., & Kleinmann, S. G., 1993, ApJ, 413, 298
- Kerschbaum & Hron, (1994) Kerschbaum, F., & Hron, J., 1994, A&AS, 106, 397
- Kerschbaum, (1995) Kerschbaum, F., 1995, A&AS, 113, 441
- Kerschbaum et al., (1996) Kerschbaum, F., Olofsson, H., & Hron, J., 1996, A&A, 311, 273
- Lebzelter & Hron, (1999) Lebzelter, T., & Hron, J., 1999, A&A, 351, 533
- Lebzelter & Hron, (2003) Lebzelter, T., & Hron, J., 2003, A&A, 411, 533
- Lebzelter & Wood, (2007) Lebzelter, T., & Wood, P. R., 2007, A&A, 475, 643
- Lenz & Breger, (2005) Lenz, P., & Breger, M., 2005, Comm. in Asteroseism., 146, 53
- Little et al., (1987) Little, S. J., Little-Marenin, I. R., & Bauer, W. H., 1987, AJ, 94, 981
- Mayer et al., (2013) Mayer, A., Jorissen, A., Kerschbaum, F., Ottensamer, R., Nowotny, W., et al., 2013, A&A, 549, A69
- McDonald et al., (2010) McDonald, I., Sloan, G. C., Zijlstra, A. A., Matsunaga, N., Matsuura, M., et al., 2010, ApJ, 717, L92
- Ng, (1997) Ng, Y. K., 1997, A&A, 328, 211
- Norris et al., (2012) Norris, B. R. M., Tuthill, P. G., Ireland, M. J., Lacour, S., Zijlstra, A. A., et al., 2012, Nature, 484, 220
- Nowotny et al., (2010) Nowotny, W., Höfner, S., & Aringer, B., 2010, A&A, 514, A35
- Nowotny et al., (2011) Nowotny, W., Aringer, B., Höfner, S., & Lederer, M. T., 2011, A&A, 529, A129
- Pojmański, (1998) Pojmański, G., 1998, Acta Astron., 48, 35
- Price et al., (2010) Price, S. D., Smith, B. J., Kuchar, T. A., Mizuno, D. R., & Kraemer, K. E., 2010, ApJS, 190, 203
- Riebel et al., (2010) Riebel, D., Meixner, M., Fraser, O., et al., 2010, ApJ, 723, 1195
- Skrutskie et al., (2006) Skrutskie, M. F., Cutri, R. M., Stiening, S., et al., 2006, AJ, 131, 1163
- Smith & Lambert, (1988) Smith, V. V., & Lambert, D. L., 1988, ApJ, 333, 219
- Smith & Lambert, (1990) Smith, V. V., & Lambert, D. L., 1990, ApJS, 72, 387
- Smolders et al., (2012) Smolders, K., Neyskens, P., Blommaert, J. A. D. L., Hony, S., Van Winckel, H., et al., 2012, A&A, 540, A72
- Templeton et al., (2005) Templeton, M. R., Mattei, J. A., & Willson, L. A., 2005, AJ, 130, 776
- Uttenthaler et al., (2007) Uttenthaler, S., Hron, J., Lebzelter, T., Busso, M., Schultheis, M., & Käufl, H. U., 2007, A&A, 463, 251
- Uttenthaler & Lebzelter, (2010) Uttenthaler, S., & Lebzelter, T., 2010, A&A, 510, A62
- Uttenthaler et al., (2011) Uttenthaler, S., Van Stiphout, K., Voet, K., Van Winckel, H., Van Eck, S., et al., 2011, A&A, 531, A88
- Uttenthaler et al., (2012) Uttenthaler, S., Schultheis, M., Nataf, D. M., Robin, A. C., Lebzelter, T., et al., 2012, A&A, 546, A57
- Uttenthaler et al., (2013) Uttenthaler, S., Blommaert, J. A. D. L., Wood, P. R., Lebzelter, T., Schultheis, M., et al., 2013, submitted to A&A
- Van Eck & Jorissen, (1999) Van Eck, S., & Jorissen, A., 1999, A&A, 345, 127
- Van Eck et al., (2000) Van Eck, S., Jorissen, A., Udry, S., Mayor, M., Burki, G., et al., 2000, A&AS, 145, 51
- Vanture et al., (1991) Vanture, A. D., Wallerstein, G., Brown, J. A., & Bazan, G., 1991, ApJ, 381, 278
- Vassiliadis & Wood, (1993) Vassiliadis, E., & Wood, P. R., 1993, ApJ, 413, 641
- Wachter et al., (2002) Wachter, A., Schröder, K.-P., Winters, J. M., Arndt, T. U., & Sedlmayr, E., 2002, A&A, 384, 452
- Whitelock et al., (1994) Whitelock, P., Menzies, J., Feast, M., Marang, F., Carter, B., et al., 1994, MNRAS, 267, 711
- Whitelock et al., (2000) Whitelock, P., Marang, F., & Feast, M., 2000, MNRAS, 319, 728
- Whitelock et al., (2006) Whitelock, P. A., Feast, M. W., Marang, F. & Groenewegen, M. A. T., 2006, MNRAS, 369, 751
- Whitelock et al., (2008) Whitelock, P. A., Feast, M. W., & van Leeuwen, F., 2008, MNRAS, 386, 313
- Winters et al., (2000) Winters, J. M., Keady, J. J., Gauger, A., & Sada, P. V., 2000, A&A, 359, 651
- Woitke, (2006) Woitke, P., 2006, A&A, 460, L9
- Wood & Cahn, (1977) Wood, P. R., & Cahn, J. H., 1977, ApJ, 211, 499
- Wood & Zarro, (1981) Wood, P. R., & Zarro, D. M., 1981, ApJ, 247, 247
- Wright et al., (2010) Wright, E. L., Eisenhardt, P. R. M., Mainzer, A. K., Ressler, M. E., Cutri, R. M., et al., 2010, AJ, 140, 1868
1
| Name | Tc | Ref. | Period | VarType | SpType | [1.25] | [2.20] | [12] | [25] | [60] | [9] | [18] | [22] | ||
|---|---|---|---|---|---|---|---|---|---|---|---|---|---|---|---|
| (days) | mag | mag | mag | mag | mag | mag | mag | mag | mag | ||||||
| (1) | (2) | (3) | (4) | (5) | (6) | (7) | (8) | (9) | (10) | (11) | (12) | (13) | (14) | (15) | (16) |
| R And | 1 | 1,3 | 409.9 | Mira | S | 1.902 | |||||||||
| W And | 1 | 1,2 | 396.3 | Mira | M | 1.461 | |||||||||
| Y And | 0 | 1 | 220.9 | Mira | M | 1.101 | |||||||||
| Z Ant | 1 | 5 | 128.9 | SRV | S | 1.396 | |||||||||
| R Aql | 0 | 3,10 | 270.6 | Mira | M | 1.361 | |||||||||
| RR Aql | 0 | 7 | 399.8 | Mira | M | 1.576 | |||||||||
| RT Aql | 0 | 1 | 327.8 | Mira | M | 1.331 | |||||||||
| SY Aql | 0 | 1 | 356.3 | Mira | M | 1.436 | |||||||||
| UV Aql | 1 | 12 | 385.5 | SRV | C | 1.972 | |||||||||
| V899 Aql | 1 | 11 | 373.7 | Mira | S | 1.440 | |||||||||
| V1717 Aql | 1 | 11 | 357.0 | Mira | S | 1.540 | |||||||||
| W Aql | 1 | 11 | 487.8 | Mira | S | 2.090 | |||||||||
| R Aqr | 1 | 7 | 388.2 | Mira | M | 1.578 | |||||||||
| T Aqr | 0 | 1 | 201.8 | Mira | M | 1.174 | |||||||||
| AU Aur | 1 | 13 | 400.5 | Mira | C | 2.308 | |||||||||
| AZ Aur | 1 | 13 | 413.7 | Mira | C | 2.263 | |||||||||
| RU Aur | 1 | 7 | 469.6 | Mira | M | 2.073 | |||||||||
| SZ Aur | 1 | 10 | 458.1 | Mira | MS | 1.393 | |||||||||
| UV Aur | 1 | 1 | 394.4 | Mira | C | 1.900 | |||||||||
| VX Aur | 0 | 1 | 322.6 | Mira | M | 1.211 | |||||||||
| R Boo | 0 | 1 | 223.6 | Mira | M | 1.203 | |||||||||
| T Cam | 1 | 1 | 373.9 | Mira | S | 1.741 | |||||||||
| T Cap | 0 | 7 | 270.7 | Mira | M | 1.295 | |||||||||
| AU Car | 1 | 11 | 347.0 | Mira | S | 1.620 | |||||||||
| KN Car | 1 | 5 | 352.0 | Mira | S | 1.509 | |||||||||
| RX Car | 1 | 11 | 336.0 | Mira | S | 1.640 | |||||||||
| S Car | 0 | 1 | 148.9 | Mira | M | 1.354 | |||||||||
| U Cas | 1 | 1 | 276.9 | Mira | S | 1.451 | |||||||||
| W Cas | 1 | 13 | 405.9 | Mira | C | 1.765 | |||||||||
| R Cen | 0 | 1 | 538.1 | Mira | M | 1.286 | |||||||||
| V744 Cen | 0 | 4,5 | 167.3 | SRV | M | 1.271 | |||||||||
| VX Cen | 1 | 5 | 109.1 | SRV | S | 1.413 | |||||||||
| T Cep | 1 | 1,3,10 | 386.6 | Mira | M | 1.328 | |||||||||
| omi Cet | 1 | 1,3 | 332.7 | Mira | M | 1.296 | |||||||||
| R Cet | 0 | 1 | 165.9 | Mira | M | 1.235 | |||||||||
| U Cet | 0 | 7,9 | 233.7 | Mira | M | 1.110 | |||||||||
| W Cet | 1 | 1,9 | 352.1 | Mira | MS | 1.230 | |||||||||
| CR Cir | 0 | 6 | 108.2 | SRV | S | 1.253 | |||||||||
| BZ CMa | 1 | 11 | 332.8 | Mira | S | 1.630 | |||||||||
| V355 CMa | 1 | 11 | 370.0 | Mira | S | 1.460 | |||||||||
| R CMi | 1 | 1 | 337.7 | Mira | C | 1.543 | |||||||||
| U CMi | 0 | 1 | 410.3 | Mira | M | 1.265 | |||||||||
| V CMi | 1 | 1 | 366.3 | Mira | M | 1.249 | |||||||||
| XY CMi | 1 | 11 | 271.2 | Mira | S | 1.420 | |||||||||
| R Cnc | 0 | 1 | 362.0 | Mira | M | 1.298 | |||||||||
| R Col | 1 | 1 | 328.1 | Mira | M | 1.296 | |||||||||
| T Col | 0 | 1 | 226.1 | Mira | M | 1.151 | |||||||||
| V CrB | 1 | 12,13 | 358.0 | Mira | C | 2.152 | |||||||||
| X CrB | 0 | 1 | 240.9 | Mira | M | 1.388 | |||||||||
| BH Cru | 1 | 10 | 524.4 | Mira | C | 1.644 | |||||||||
| chi Cyg | 1 | 1,3 | 408.2 | Mira | S | 1.863 | |||||||||
| AW Cyg | 1 | 12 | 213.0 | SRV | C | 1.947 | |||||||||
| LX Cyg | 1 | 10 | 587.5 | Mira | C | 2.199 | |||||||||
| R Cyg | 1 | 1 | 426.6 | Mira | S | 1.390 | |||||||||
| U Cyg | 1 | 13 | 464.8 | Mira | C | 2.156 | |||||||||
| V441 Cyg | 1 | 9 | 286.6 | SRV | S | 1.390 | |||||||||
| V460 Cyg | 1 | 12 | 180.0 | SRV | C | 1.532 | |||||||||
| W Cyg | 1 | 3,4,7 | 132.8 | SRV | M | 1.193 | |||||||||
| WX Cyg | 1 | 13 | 409.5 | Mira | C | 2.081 | |||||||||
| R Del | 0 | 1 | 285.7 | Mira | M | 1.526 | |||||||||
| U Del | 1 | 4,7 | 119.8 | SRV | M | 1.223 | |||||||||
| Z Del | 1 | 1 | 304.5 | Mira | S | 1.154 | |||||||||
| R Dor | 0 | 4 | 327.1 | SRV | M | 1.575 | |||||||||
| T Dra | 1 | 13 | 422.7 | Mira | C | 2.855 | |||||||||
| UX Dra | 1 | 12,13 | 177.0 | SRV | C | 1.640 | |||||||||
| W Dra | 0 | 10 | 289.6 | Mira | M | 1.340 | |||||||||
| WZ Dra | 1 | 7 | 411.9 | Mira | M | 1.379 | |||||||||
| T Eri | 0 | 1 | 252.4 | Mira | M | 1.194 | |||||||||
| U Eri | 0 | 1 | 274.4 | Mira | M | 1.236 | |||||||||
| W Eri | 0 | 9 | 373.6 | Mira | M | 1.420 | |||||||||
| NZ Gem | 0 | 2 | 30.1 | SRV | S | 1.031 | |||||||||
| R Gem | 1 | 1 | 370.1 | Mira | S | 1.071 | |||||||||
| T Gem | 1 | 1 | 287.7 | Mira | S | 1.412 | |||||||||
| V Gem | 1 | 1 | 275.1 | Mira | M | 1.318 | |||||||||
| VX Gem | 1 | 12,13 | 380.0 | Mira | C | 1.830 | |||||||||
| ZZ Gem | 1 | 13 | 315.6 | Mira | C | 2.161 | |||||||||
| S Gru | 1 | 7,9 | 401.0 | Mira | MS | 1.220 | |||||||||
| RU Her | 1 | 7 | 485.6 | Mira | M | 1.618 | |||||||||
| S Her | 1 | 10 | 304.1 | Mira | MS | 1.166 | |||||||||
| SV Her | 0 | 1 | 238.4 | Mira | M | 1.131 | |||||||||
| T Her | 0 | 10 | 163.9 | Mira | M | 1.222 | |||||||||
| R Hor | 1 | 7,9 | 404.6 | Mira | MS | 1.240 | |||||||||
| T Hor | 0 | 7,9 | 218.7 | Mira | M | 1.130 | |||||||||
| TW Hor | 1 | 7,9 | 269.6 | SRV | C | 1.460 | |||||||||
| CZ Hya | 1 | 13 | 432.0 | Mira | C | 2.262 | |||||||||
| R Hya | 1 | 7,10 | 376.6 | Mira | M | 1.261 | |||||||||
| RR Hya | 1 | 1 | 342.1 | Mira | M | 1.253 | |||||||||
| RU Hya | 0 | 7,9 | 333.2 | Mira | M | 1.180 | |||||||||
| U Hya | 1 | 12,13 | 389.4 | SRV | C | 1.519 | |||||||||
| W Hya | 0 | 4,10 | 388.6 | Mira | M | 1.459 | |||||||||
| RX Lac | 1 | 7 | 331.4 | SRV | MS | 1.324 | |||||||||
| S Lac | 0 | 1 | 240.2 | Mira | M | 1.305 | |||||||||
| RR Lib | 0 | 1 | 277.8 | Mira | M | 1.303 | |||||||||
| Y Lib | 0 | 7,9 | 276.6 | Mira | M | 1.210 | |||||||||
| S Lup | 1 | 1 | 342.2 | Mira | S | 1.430 | |||||||||
| RT Lyn | 1 | 7 | 394.1 | Mira | M | 1.613 | |||||||||
| U Lyn | 0 | 7 | 440.5 | Mira | M | 1.478 | |||||||||
| HK Lyr | 1 | 12,13 | 186.0 | Mira | C | 2.054 | |||||||||
| U Mic | 0 | 7,9 | 332.9 | Mira | M | 1.220 | |||||||||
| CL Mon | 1 | 13 | 483.0 | Mira | C | 2.788 | |||||||||
| SY Mon | 0 | 7 | 425.1 | Mira | M | 1.485 | |||||||||
| R Nor | 0 | 10 | 496.2 | Mira | M | 1.310 | |||||||||
| U Oct | 0 | 1 | 302.5 | Mira | M | 1.215 | |||||||||
| R Oph | 0 | 1 | 303.1 | Mira | M | 1.366 | |||||||||
| RY Oph | 0 | 1 | 150.5 | Mira | M | 1.240 | |||||||||
| V Oph | 1 | 12,13 | 297.3 | Mira | C | 2.141 | |||||||||
| S Ori | 1 | 10 | 433.4 | Mira | M | 1.352 | |||||||||
| V1365 Ori | 0 | 1 | 62.8 | SRV | M | 1.151 | |||||||||
| W Ori | 0 | 12,13 | 204.9 | SRV | C | 1.752 | |||||||||
| NU Pav | 0 | 7 | 86.5 | SRV | M | 1.313 | |||||||||
| RZ Peg | 1 | 1 | 436.9 | Mira | C | 1.807 | |||||||||
| S Peg | 0 | 7 | 314.4 | Mira | M | 1.280 | |||||||||
| TW Peg | 0 | 7 | SRV | M | 1.304 | ||||||||||
| W Peg | 0 | 7 | 343.9 | Mira | M | 1.417 | |||||||||
| X Peg | 0 | 1 | 200.9 | Mira | M | 1.136 | |||||||||
| Z Peg | 1 | 1 | 327.8 | Mira | M | 1.310 | |||||||||
| UZ Per | 0 | 7 | 926.7 | SRV | M | 1.461 | |||||||||
| RX Psc | 1 | 11 | 281.4 | Mira | S | 1.290 | |||||||||
| Z Psc | 1 | 12,13 | 278.9 | SRV | C | 1.515 | |||||||||
| CO Pyx | 1 | 11 | 329.0 | Mira | S | 1.330 | |||||||||
| Y Scl | 0 | 9 | 613.0 | SRV | M | 1.270 | |||||||||
| RR Sco | 0 | 1 | 278.9 | Mira | M | 1.207 | |||||||||
| RZ Sco | 0 | 1 | 159.3 | Mira | M | 1.106 | |||||||||
| S Sct | 1 | 13 | 149.7 | SRV | C | 1.860 | |||||||||
| DX Ser | 0 | 7 | 360.0 | SRV | M | 1.364 | |||||||||
| R Ser | 1 | 1,3 | 353.6 | Mira | M | 1.323 | |||||||||
| Y Ser | 0 | 7 | 432.7 | SRV | M | 1.392 | |||||||||
| R Sgr | 0 | 1 | 268.6 | Mira | M | 1.199 | |||||||||
| RV Sgr | 1 | 1 | 318.9 | Mira | M | 1.213 | |||||||||
| RX Sgr | 1 | 1 | 333.3 | Mira | M | 1.335 | |||||||||
| T Sgr | 1 | 1,3 | 392.8 | Mira | S | 1.542 | |||||||||
| V781 Sgr | 1 | 12,13 | 208.7 | SRV | C | 1.834 | |||||||||
| X TrA | 1 | 1 | 364.2 | SRV | C | 1.785 | |||||||||
| R Tri | 0 | 1 | 266.5 | Mira | M | 1.181 | |||||||||
| T Tuc | 0 | 7,9 | 247.1 | Mira | M | 1.180 | |||||||||
| RR UMa | 0 | 1 | 231.4 | Mira | M | 1.259 | |||||||||
| S UMa | 1 | 1,2 | 227.3 | Mira | S | 1.441 | |||||||||
| T UMa | 0 | 1 | 285.5 | Mira | M | 1.350 | |||||||||
| VW UMa | 0 | 7 | 66.0 | SRV | M | 1.219 | |||||||||
| VY UMa | 1 | 12,13 | 120.4 | SRV | C | 1.466 | |||||||||
| T UMi | 0 | 10 | 229.1 | Mira | M | 1.553 | |||||||||
| T UMi | 0 | 10 | 113.6 | SRV | M | 1.553 | |||||||||
| HP Vel | 1 | 5 | 104.1 | SRV | S | 1.363 | |||||||||
| ER Vir | 0 | 7,9 | SRV | M | 1.100 | ||||||||||
| EV Vir | 0 | 7,9 | SRV | M | 1.150 | ||||||||||
| R Vir | 0 | 1 | 146.0 | Mira | M | 1.117 | |||||||||
| RS Vir | 0 | 1,7,9 | 352.0 | Mira | M | 1.310 | |||||||||
| RU Vir | 1 | 13 | 437.3 | Mira | C | 2.901 | |||||||||
| S Vir | 1 | 7,9 | 370.4 | Mira | M | 1.270 | |||||||||
| X Vol | 1 | 5 | 288.0 | Mira | S | 1.497 | |||||||||
| R Vul | 0 | 1 | 136.8 | Mira | M | 1.462 | |||||||||
| RU Vul | 0 | 10 | 108.8 | SRV | M | 1.223 | |||||||||
| CSS 466 | 1 | 11 | 385.0 | Mira | S | 2.240 | |||||||||
| CSS 739 | 1 | 11 | 336.0 | Mira | S | 1.310 | |||||||||
| Hen 4-8 | 1 | 5 | 170.5 | SRV | S | 1.151 | |||||||||
| Hen 4-19 | 1 | 5 | 48.2 | SRV | S | 1.176 | |||||||||
| Hen 4-20 | 1 | 5 | 138.9 | SRV | S | 1.238 | |||||||||
| Hen 4-27 | 1 | 11 | 363.3 | Mira | S | 1.800 | |||||||||
| Hen 4-33 | 1 | 11 | 405.0 | Mira | S | 1.520 | |||||||||
| Hen 4-36 | 1 | 5 | 56.8 | SRV | S | 1.397 | |||||||||
| Hen 4-37 | 1 | 5 | 108.6 | SRV | S | 1.223 | |||||||||
| Hen 4-39 | 1 | 5 | 46.6 | SRV | S | 1.327 | |||||||||
| Hen 4-41 | 1 | 5 | 125.1 | SRV | S | 1.626 | |||||||||
| Hen 4-64 | 1 | 5 | 59.1 | SRV | S | 1.487 | |||||||||
| Hen 4-66 | 1 | 5 | 216.0 | SRV | S | 1.328 | |||||||||
| Hen 4-81 | 1 | 11 | 408.8 | Mira | S | 1.790 | |||||||||
| Hen 4-84 | 1 | 11 | 408.9 | Mira | S | 1.860 | |||||||||
| Hen 4-95 | 1 | 5 | 83.3 | SRV | S | 1.084 | |||||||||
| Hen 4-104 | 1 | 5 | 40.3 | SRV | S | 1.252 | |||||||||
| Hen 4-109 | 1 | 11 | 281.1 | Mira | S | 1.370 | |||||||||
| Hen 4-122 | 1 | 11 | 307.0 | Mira | S | 1.620 | |||||||||
| Plaut 3-45 | 0 | 8 | 271.0 | Mira | M | 1.450 | |||||||||
| Plaut 3-70 | 0 | 8 | 166.5 | SRV | M | 1.290 | |||||||||
| Plaut 3-100 | 0 | 8 | 298.7 | Mira | M | 1.290 | |||||||||
| Plaut 3-143 | 0 | 8 | 204.2 | Mira | M | 1.250 | |||||||||
| Plaut 3-195 | 0 | 8 | 216.6 | Mira | M | 1.210 | |||||||||
| Plaut 3-277 | 0 | 8 | 263.2 | Mira | M | 1.320 | |||||||||
| Plaut 3-315 | 0 | 8 | 326.8 | Mira | M | 1.370 | |||||||||
| Plaut 3-328 | 0 | 8 | 166.8 | SRV | M | 1.200 | |||||||||
| Plaut 3-331 | 0 | 8 | 311.1 | Mira | M | 1.460 | |||||||||
| Plaut 3-626 | 1 | 8 | 311.1 | Mira | MS | 1.260 | |||||||||
| Plaut 3-639 | 0 | 8 | 167.3 | SRV | M | 1.260 | |||||||||
| Plaut 3-719 | 0 | 8 | 277.8 | SRV | M | 1.300 | |||||||||
| Plaut 3-794 | 0 | 8 | 303.5 | Mira | M | 1.350 | |||||||||
| Plaut 3-942 | 1 | 8 | 338.0 | Mira | MS | 1.340 | |||||||||
| Plaut 3-1002 | 0 | 8 | 190.5 | SRV | M | 1.220 | |||||||||
| Plaut 3-1008 | 0 | 8 | 232.1 | SRV | M | 1.250 | |||||||||
| Plaut 3-1059 | 0 | 8 | 144.1 | SRV | M | 1.230 | |||||||||
| Plaut 3-1147 | 1 | 8 | 395.6 | Mira | M | 1.500 | |||||||||
| Plaut 3-1176 | 0 | 8 | 184.1 | SRV | M | 1.330 | |||||||||
| Plaut 3-1179 | 0 | 8 | 278.2 | Mira | M | 1.360 | |||||||||
| Plaut 3-1204 | 0 | 8 | 197.0 | SRV | M | 1.330 | |||||||||
| Plaut 3-1287 | 0 | 8 | 312.5 | Mira | M | 1.310 | |||||||||
| Plaut 3-1313 | 0 | 8 | 378.7 | Mira | M | 1.470 | |||||||||
| Plaut 3-1347 | 1 | 8 | 408.9 | Mira | MS | 1.480 | |||||||||
| Plaut 3-1470 | 0 | 8 | 183.2 | SRV | M | 1.210 | |||||||||
| Plaut 3-1517 | 0 | 8 | 188.8 | SRV | M | 1.260 | |||||||||
| Plaut 3-1991 | 0 | 8 | 124.7 | SRV | M | 1.150 |