On the photometric error calibration for the ‘differential light curves’ of point-like Active Galactic Nuclei
Abstract
It is important to quantify the underestimation of rms photometric errors returned by the commonly used algorithm in the software, in the context of differential photometry of point-like AGN, because of the crucial role it plays in evaluating their variability properties. Published values of the underestimation factor, , using several different telescopes, lie in the range 1.3 - 1.75. The present study aims to revisit this question by employing an exceptionally large data set of 262 differential light curves (DLCs) derived from 262 pairs of non-varying stars monitored under our ARIES AGN monitoring program for characterizing the intra-night optical variability (INOV) of prominent AGN classes. The bulk of these data were taken with the 1-m Sampurnanad Telescope (ST). We find = 1.540.05 which is close to our recently reported value of = 1.5. Moreover, this consistency holds at least up to a brightness mismatch of 1.5 mag between the paired stars. From this we infer that a magnitude difference of at least up to 1.5 mag between a point-like AGN and comparison star(s) monitored simultaneously is within the same CCD chip acceptable, as it should not lead to spurious claims of INOV.
keywords:
Photometry: optical – photometry: Methods: data analysis – Optical: variability–AGN1 Introduction
Observations of intensity variations at different wavelengths
constitute a highly effective probe of the physics of active
galactic nuclei (AGN). In the optical domain, numerous such
studies have been carried out, covering time scales down to hours
and even minutes, sometimes coordinated with monitoring in other
wavebands (e.g., Miller, Carini, &
Goodrich 1989; Wagner & Witzel 1995;
Jang & Miller 1995, 1997; Romero, Cellone, &
Combi 1999;
Romero et al. 2002; Gopal-Krishna,
Sagar, & Wiita 1993a, b, 1995;
Gopal-Krishna et al. 2000, 2003, 2011;
Sagar, Gopal-Krishna, &
Wiita 1996; Sagar et al. 2004;
Carini et al. 1991, 1992, 2007;
Carini, Miller, &
Goodrich 1990; Carini & Miller 1992; Carini, Noble, &
Miller 1998, 2003;
Stalin et al. 2004a, b, 2005;
Noble et al. 1997;
Goyal et al. 2007, 2009, 2010, 2012;
Gupta & Joshi 2005; Gupta & Yuan 2009;
de Diego et al. 1998; Ramírez et al. 2009; Joshi et al. 2011;
Gupta et al. 2008a, b, 2012;
Rani et al. 2010a, b, 2011;
Gaur et al. 2010, 2012).
Since 1990, most observations of intra-night optical
variability (INOV) have been made using CCD detectors, which allow
simultaneous recording of a number of stars within the same chip.
Not only are some of these simultaneously monitored stars used
for measuring any variations in the seeing disk during the course
of the monitoring session, but, more importantly, they are used
as non-varying standards relative to which the light curve of the
target AGN can be drawn. Such ‘differential light curves’ (DLCs) are
also drawn for the candidate ‘comparison stars’ themselves and used
to check for the presence of INOV of those stars, in which case they
are disqualified as comparison stars (e.g.,
Miller & Wiita 1991; Stalin et al. 2004b; Wiita 2006).
A key advantage of using DLCs is that the effects of any
fluctuations in the atmospheric attenuation and even in the seeing
disk are mostly canceled out, and this way the
variability detection threshold is pushed down enormously (e.g.,
Howell & Jacoby 1986; Miller, Carini, &
Goodrich 1989;
Gilliland et al. 1993;
Howell et al. 2005). Thus, intra-night optical
variability (INOV) with amplitudes as low as 1 to 2 per cent can be
routinely detected using 1-metre class telescopes.
(e.g., see Goyal et al. 2012 and references therein).
Since 1998, a large body of such sensitive observations has been
accumulated, in a fairly uniform manner, using the 104-cm
Sampurnanand telescope of ARIES in Nainital (India)
(Stalin et al. 2004a, b, 2005;
Gupta et al. 2008a, b, 2012;
Gopal-Krishna et al. 2003, 2011;
Goyal et al. 2007, 2009, 2010, 2012
). Usually, the
targets monitored in these studies are optically luminous and relatively bright
point-like AGN, namely, quasars (both radio-loud and radio-quiet)
and BL Lacs, in the magnitude range = 15 - 17 mag.
A number of statistical tests have been employed in the
literature for detecting the presence of variability in DLCs.
Until recently, the most popular test has been the, so called,
-test (Jang & Miller 1997;
Romero et al. 1999).
Basically, this involves computation of a factor ‘C’ for a given DLC
of a target object,
where C is the ratio of the standard deviation of the AGN light
curve to the standard deviation of the comparison star-star light curve, i.e.,
| (1) |
where is the standard deviation of the ‘target-star’ DLC,
and is the mean of the (formal) rms errors
of the individual data points in the ‘target-star’ DLC.
This ratio ‘C’ has been taken to have a Gaussian (normal) distribution (e.g.,
Jang & Miller 1997, Romero et al. 1999).
Thus, an AGN DLC found to have ‘C’ greater than
2.576 (corresponding to significance level, 0.01)
is declared to be ‘variable’. Similarly, an AGN
DLC having computed ‘C’ value greater than 1.950 and less than 2.576
(corresponding to 0.05) is termed as ‘probable variable’.
However, recently, de Diego (2010) has questioned the validity
of this test on the ground that C-statistics does not have
a normal distribution and the two tailed p-values of
normal distribution should not be
used as a statistical indicator of INOV at a given
(variable vs. non-variable). The argument is as follows :
(a) The C-statistic is always positive, making it a
one-sided comparison, unlike the normal
Gaussian distribution which is two-sided comparison.
(b) For a test statistic to have a standard
normal distribution, the expected value is distributed around
0 while in case of ‘C’ statistic it is distributed around 1
when is satisfied.
(c) One cannot compare two standard deviations using the normal
distribution as they are not lineal statistical operators.
Thus, de Diego (2010) has argued in favour of F-test
which relies on the computation of F-factor, being the ratio of
two variances, as follows (see also, Villforth, Koekemoer, &
Grogin 2010):
| (2) |
where is the variance of the ‘target-star’ DLC, and
,
is the mean of the squares of the (formal) rms errors of the individual data
points in the ‘target-star’ DLC.
Clearly, both the C-test and the F-test require a precise estimate
of the rms error () associated with individual data points,
which is usually determined using the APPHOT routine in the
IRAF111Image Reduction and Analysis Facility (http://iraf.noao.edu/) software.
Many years ago, it was pointed out that the
returned by this algorithm is systematically too low by
a factor, , for which a value of 1.75 was estimated using
the DLCs derived for pairs of steady stars (Gopal-Krishna et al. 1995).
This inference ( 1) has been borne out in several
independent studies from atleast 4 different observatories
and the derived values of this parameter range
between 1.3 and 1.75 (Gopal-Krishna et al. 1995; Garcia et al. 1999;
Bachev et al. 2005; Stalin et al. 2004b;
Goyal et al. 2007).
The most recent attempt to determine used DLCs for 73 pairs of steady
stars and a best-fit value of = 1.5 was obtained
(Goyal et al. 2012).
Clearly, a neglect of factor (i.e., setting
= 1) might often lead to spurious claims of INOV (above
a preset statistical significance threshold). It is therefore
important to achieve a greater precision in the determination of ,
by avoiding the use of any photometric data that fall within a
parameter space that is more prone to introducing larger uncertainty in
the determination.
A prime candidate for a part of this ‘undesirable’ parameter space is the
mismatch between the brightness of the chosen steady comparison
stars which are paired to derive the DLCs which are collectively
used for determination.
The mismatch can be represented by = .
The purpose of the present study is to identify the ‘safe’
parameter space for , outside which
a significant distortion of the
estimate can occur. This has important implications for the INOV
search since several claims of large INOV of AGN have been questioned
because of a large mismatches between their brightnesses and those of the
comparison stars used for deriving the differential light curves (e.g., Cellone et al. 2007).
2 The sample of intra-night optical DLCs
Using the 1-m Sampurnanand telescope (ST) of ARIES, a long-term programme
was launched in 1998, for characterizing the INOV properties of important
AGN classes.
Results of this ongoing study have been reported in a
series of publications and in the Ph.D. theses of C. S. Stalin (2003)
and Arti Goyal (2010) (Goyal et al. 2012 and references
therein; Stalin et al. 2005 and references therein).
Optical intra-night monitoring data from other optical observatories
in India, such as the 2-m Himalayan Chandra Telescope
(HCT) and the 2.4m Vainu Bappu Telescope (VBT) of IIA, the 1.2m telescope
at the Gurushikhar observatory of PRL and the 2-m IUCAA Girawali
Observatory (IGO) telescope of IUCAA were also obtained to augment the
data taken with the 1-m ST. Nearly always, just one target AGN was monitored
on a given night.
The above intra-night monitoring program has covered 22 radio-quiet
quasars (RQQs), 10 radio-intermediate quasars (RIQs),
9 radio lobe-dominated quasars (LDQs), 11 radio core-dominated
quasars showing high optical polarization (HPCDQs)
and 12 showing low optical polarization (LPCDQs), as well
as 13 TeV detected BL Lac objects. Sources in the various
classes were chosen from the catalog of
Véron-Cetty & Véron (2001) and its subsequent releases.
All the sources lie at and have a listed
mag, which allows enough signal-to-noise ratio (SNR) in a typical
exposure time of minutes.
Each source was monitored for a minimum duration of 4 hours.
These CCD monitoring observations, aided by a careful and uniform
data analysis procedure, have routinely allowed INOV detection with
amplitude () as low as 1 - 2 per cent.
The present sample consists of 262 such intra-night observations
obtained from the entire data set from our ARIES AGN INOV programme.
3 Observations and data analysis
The observations were made mostly in the R filter and
occasionally in the V filter.
The exposure time was typically between 10 to 20 minutes for
the ARIES and Gurushikar observations and ranged between 3 to 6 minutes for
the observations from VBT, IAO and IGO, depending on the
brightness of the source, the phase of the moon and the sky
transparency on that night. The field positioning was adjusted
so as to also have within the CCD frame at least 2–3 comparison stars.
For all the telescopes, bias frames were taken intermittently,
and twilight sky flats were also obtained.
The pre-processing of the images (bias subtraction, flat-fielding and
cosmic-ray removal) was done by applying the standard procedures in the
IRAF and MIDAS222Munich Image and
Data Analysis System (http://www.eso.org/sci/data-processing/software/esomidas/)
software packages. The instrumental magnitudes
of the target AGN (all point-like) and the stars in
the image frames were determined by aperture photometry, using
APPHOT.
The magnitude of the target AGN was measured relative to
a few apparently steady comparison
stars present on the same CCD frame. In this way
DLCs for each AGN were derived
relative to 2-3 comparison stars designated as S1, S2, S3.
These comparison stars mostly lie within about 1.5 magnitude
of the target AGN, this being an important criterion for minimizing
the possibility of spurious INOV detection
(e.g., Cellone et al. 2007).
Spurious variability
on account of different second-order
extinction coefficients for the AGN and their comparison
stars is a possible problem if the colours of the objects are different.
Although the B-R colors of the AGN and the comparison
stars used in our study often differ
significantly, it was shown by Carini et al. (1992)
and Stalin et al. (2004b) that even though their
photons travel through varying airmass
during the course of monitoring, this has a negligible effect on DLCs.
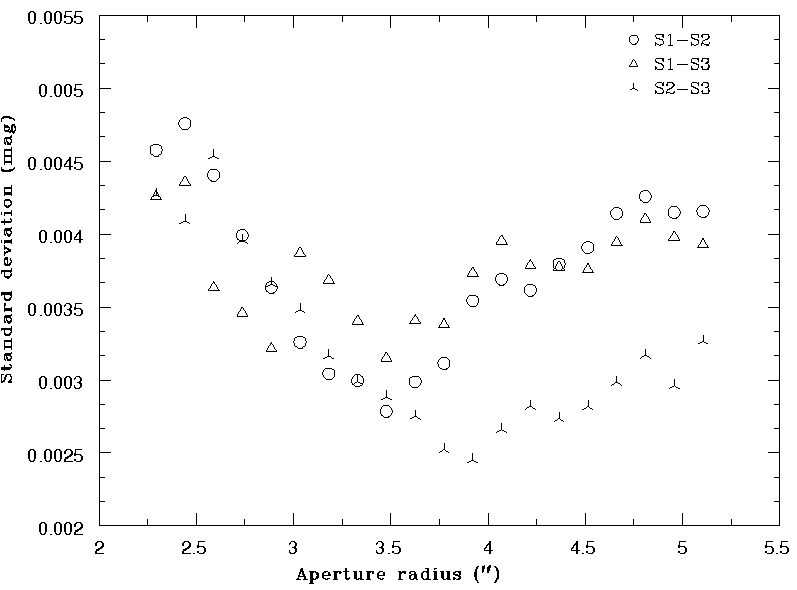
For each night, an optimum aperture radius for photometry
was chosen by minimizing the dispersions in the star-star DLCs,
that were found using different aperture radii, starting
from the median seeing (FWHM) value on that night to 4
times that value (Fig. 1). For very small
aperture radii, the scatter will be large due to improper photon
counting statistics, as the total photon count from the source will
be small. On the other hand, at very large aperture radii,
the scatter will increase as the on-source measurement will be affected by the
emission from the sky background (Howell 1989).
At intermediate aperture radii, a minimum will occur as shown in Fig. 1.
We selected the appropriate aperture for each night
as the one that provided the minimum dispersion for the DLC found among all pairs of
the comparison stars, as the same stars would be used to produce DLCs
against the target quasars to check for their INOV. Thus, using the aperture which
provides minimum dispersion will set a threshold for INOV detection
on that night (e.g., Stalin et al. 2004b).
Typically, the selected aperture radius was
4′′ and the seeing was 2′′.
4 Determination of
As mentioned in Sect. 1, the photometric errors returned by APPHOT are significantly underestimated. In this work, we make a fresh attempt to determine using our enlarged dataset of 262 DLCs from our ARIES AGN monitoring program (see Goyal et al. 2012; Sect. 2). Out of the 3 star-star DLCs available for each night (using the 3 comparison stars monitored), we first selected the steadiest (one having minimum variance) starstar DLC. Thus, for our entire dataset we have got 262 ‘steady’ DLCs, whose 524 stars appear to have not varied on the corresponding nights. For each selected DLC, with points, we then computed corresponding to its degree of freedom, = , which is given as;
| (3) |
where the expected value is the sample mean of the DLC. is the number of data points in the lightcurve, is the differential magnitude of the data point in the lightcurve and is the rms measurement error associated with each .
To compute , we use
| (4) |
where the degree of freedom is also the expected value for a pair of non-variable stars. The simplest approach is to use regression analysis given by
| (5) |
where is the residual associated with each pair of and . However, we do not know that residuals are Gaussian distributed, or are homogeneous with respect to the values of independent variable, precluding a reliable least square fitting. As our regression analysis exhibit an “expected value - residual” we can transform the variables to stabilize the variance. The most common method is the Box-Cox set of tranformations (Box & Cox 1964; Box, Hunter, & Hunter 2005). In our case this involves using logrithms of the values to homogenize the variance of regression analysis and to maintain the linear relationship between the and , we tranform to ). Then, we fix the slope to 1 in the regression analysis to obtain :
| (6) |
where . The error in is computed using Bevington & Robinson (2003)
| (7) |
where is the error in . Using these, we obtain for the entire set of 262 steady ‘star-star’ DLCs data listed in Table 1.
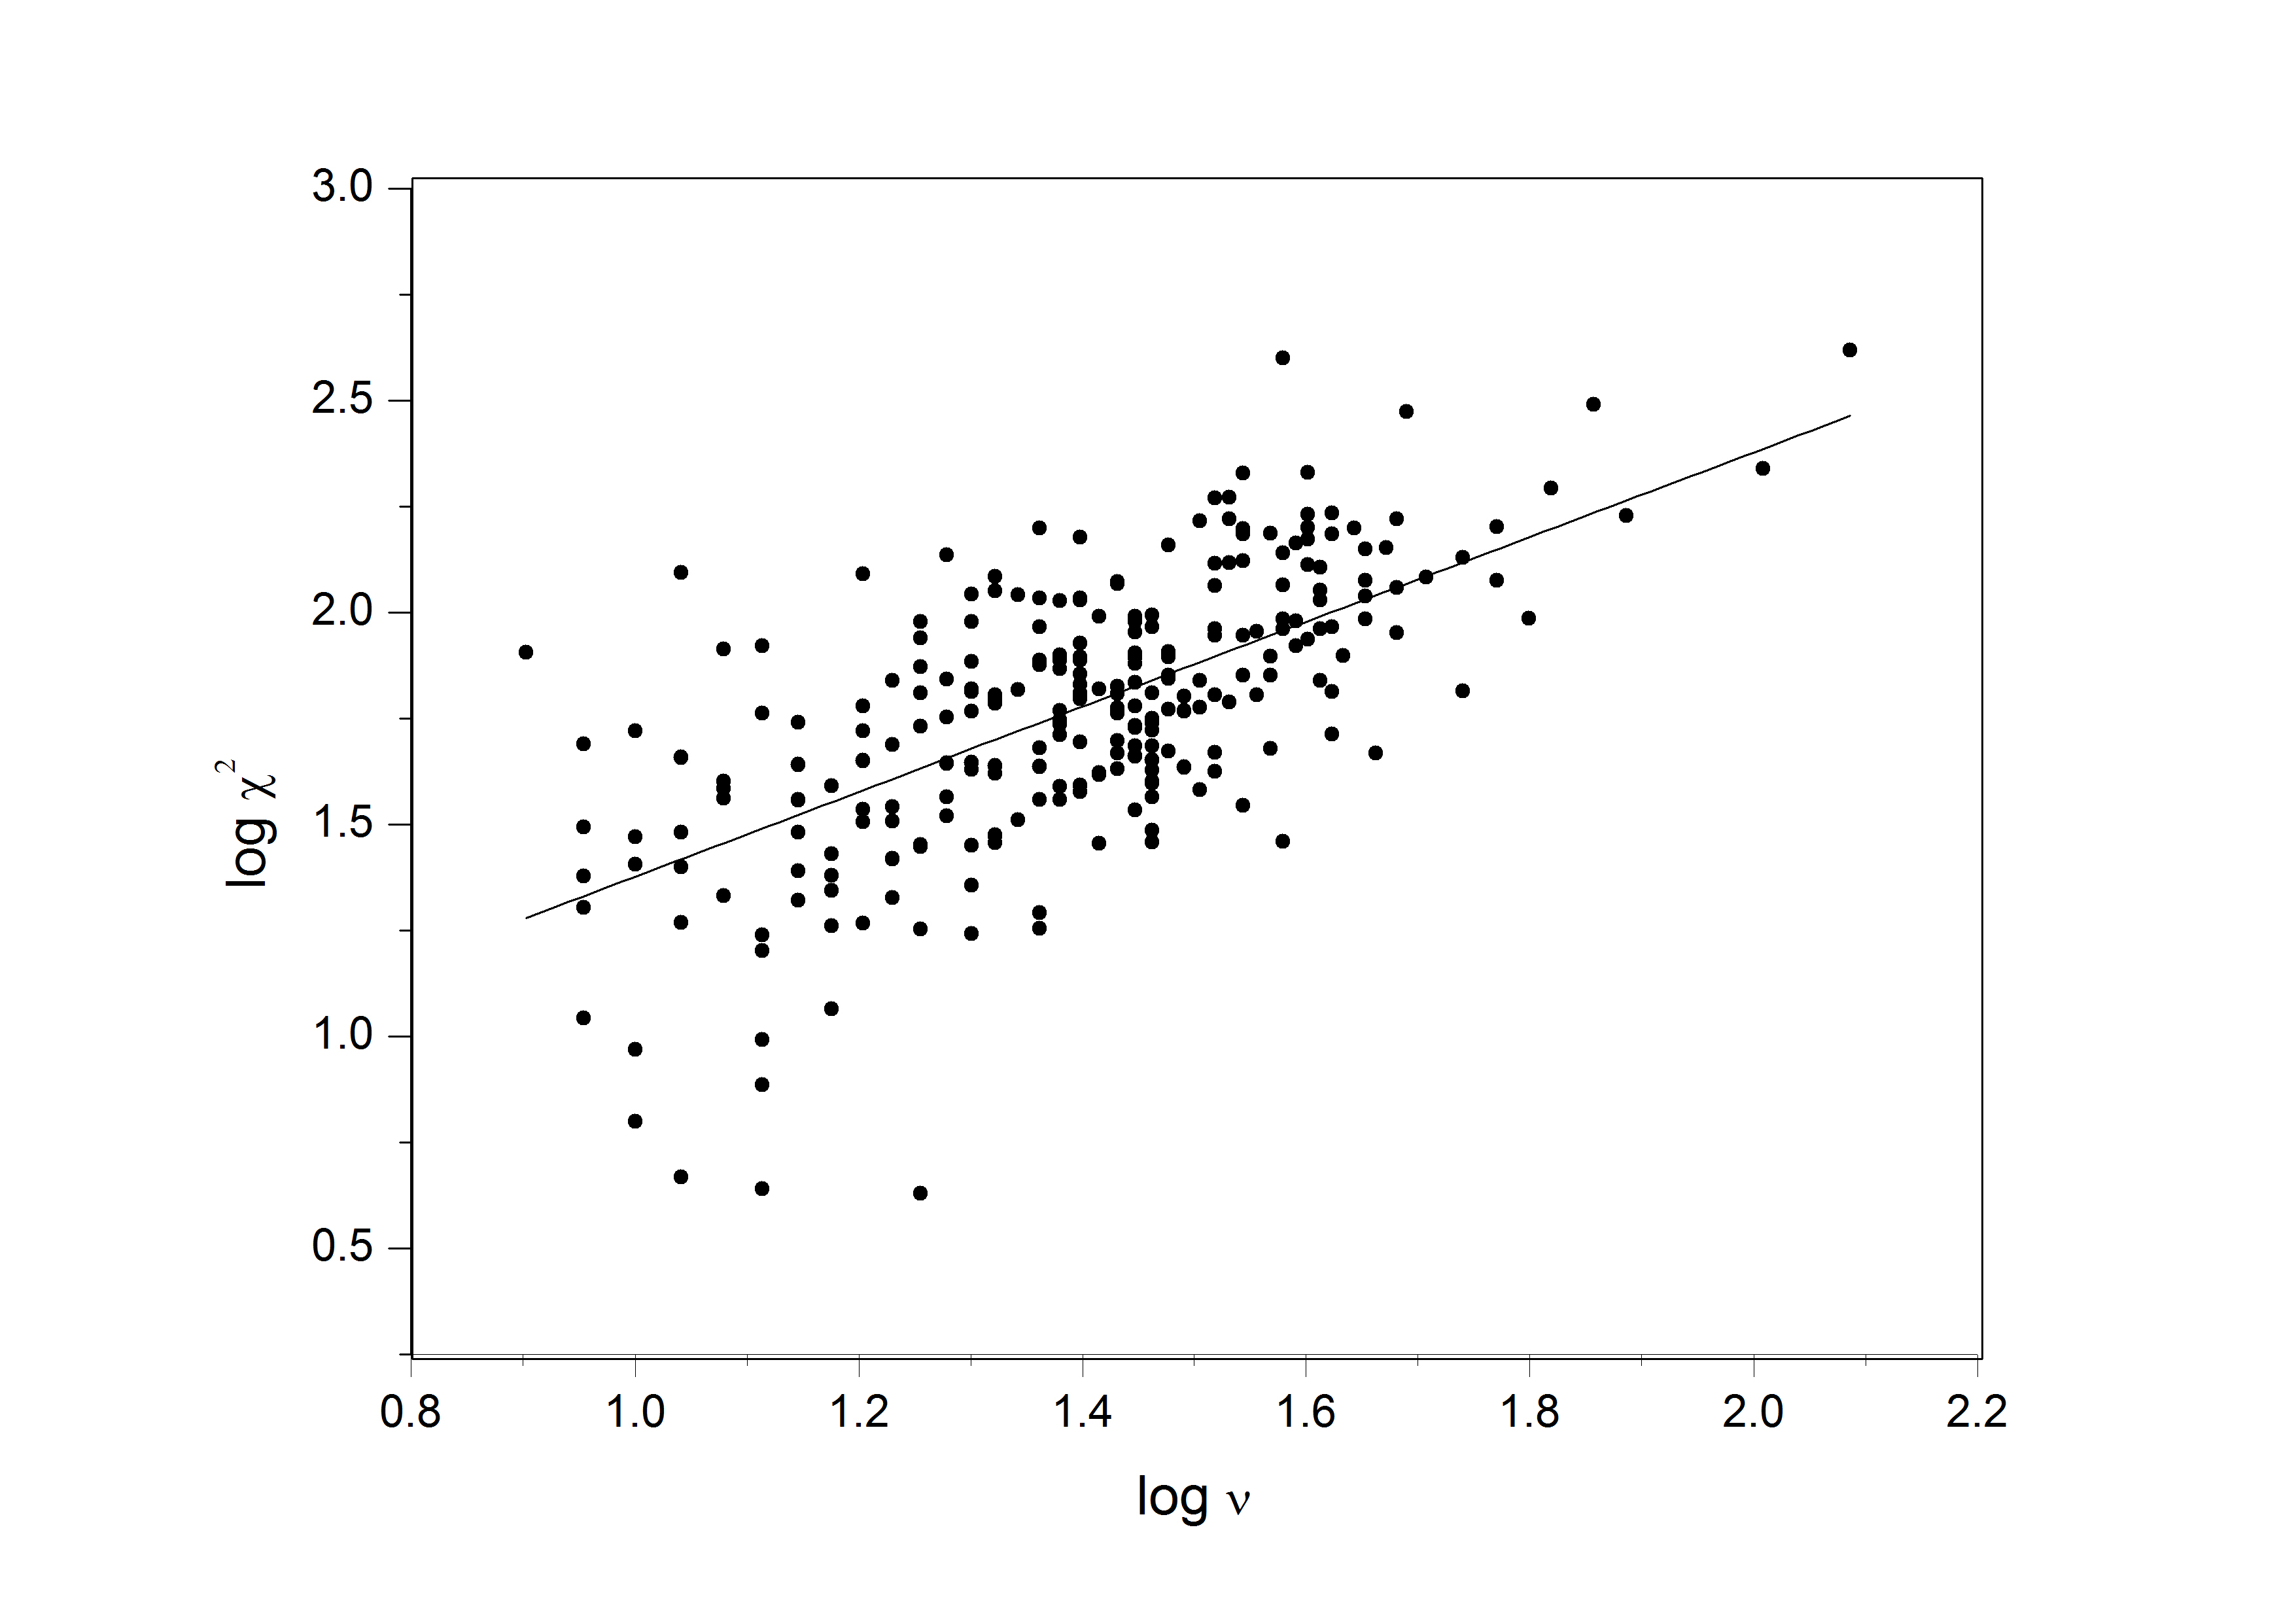
In Fig. 2, we plot for all 262 ‘steady’ star-star DLCs,
the computed values against the respective values of .
Accodingly, we adopt 1.54, for scaling up the
photometric rms errors (see Sect. 5).
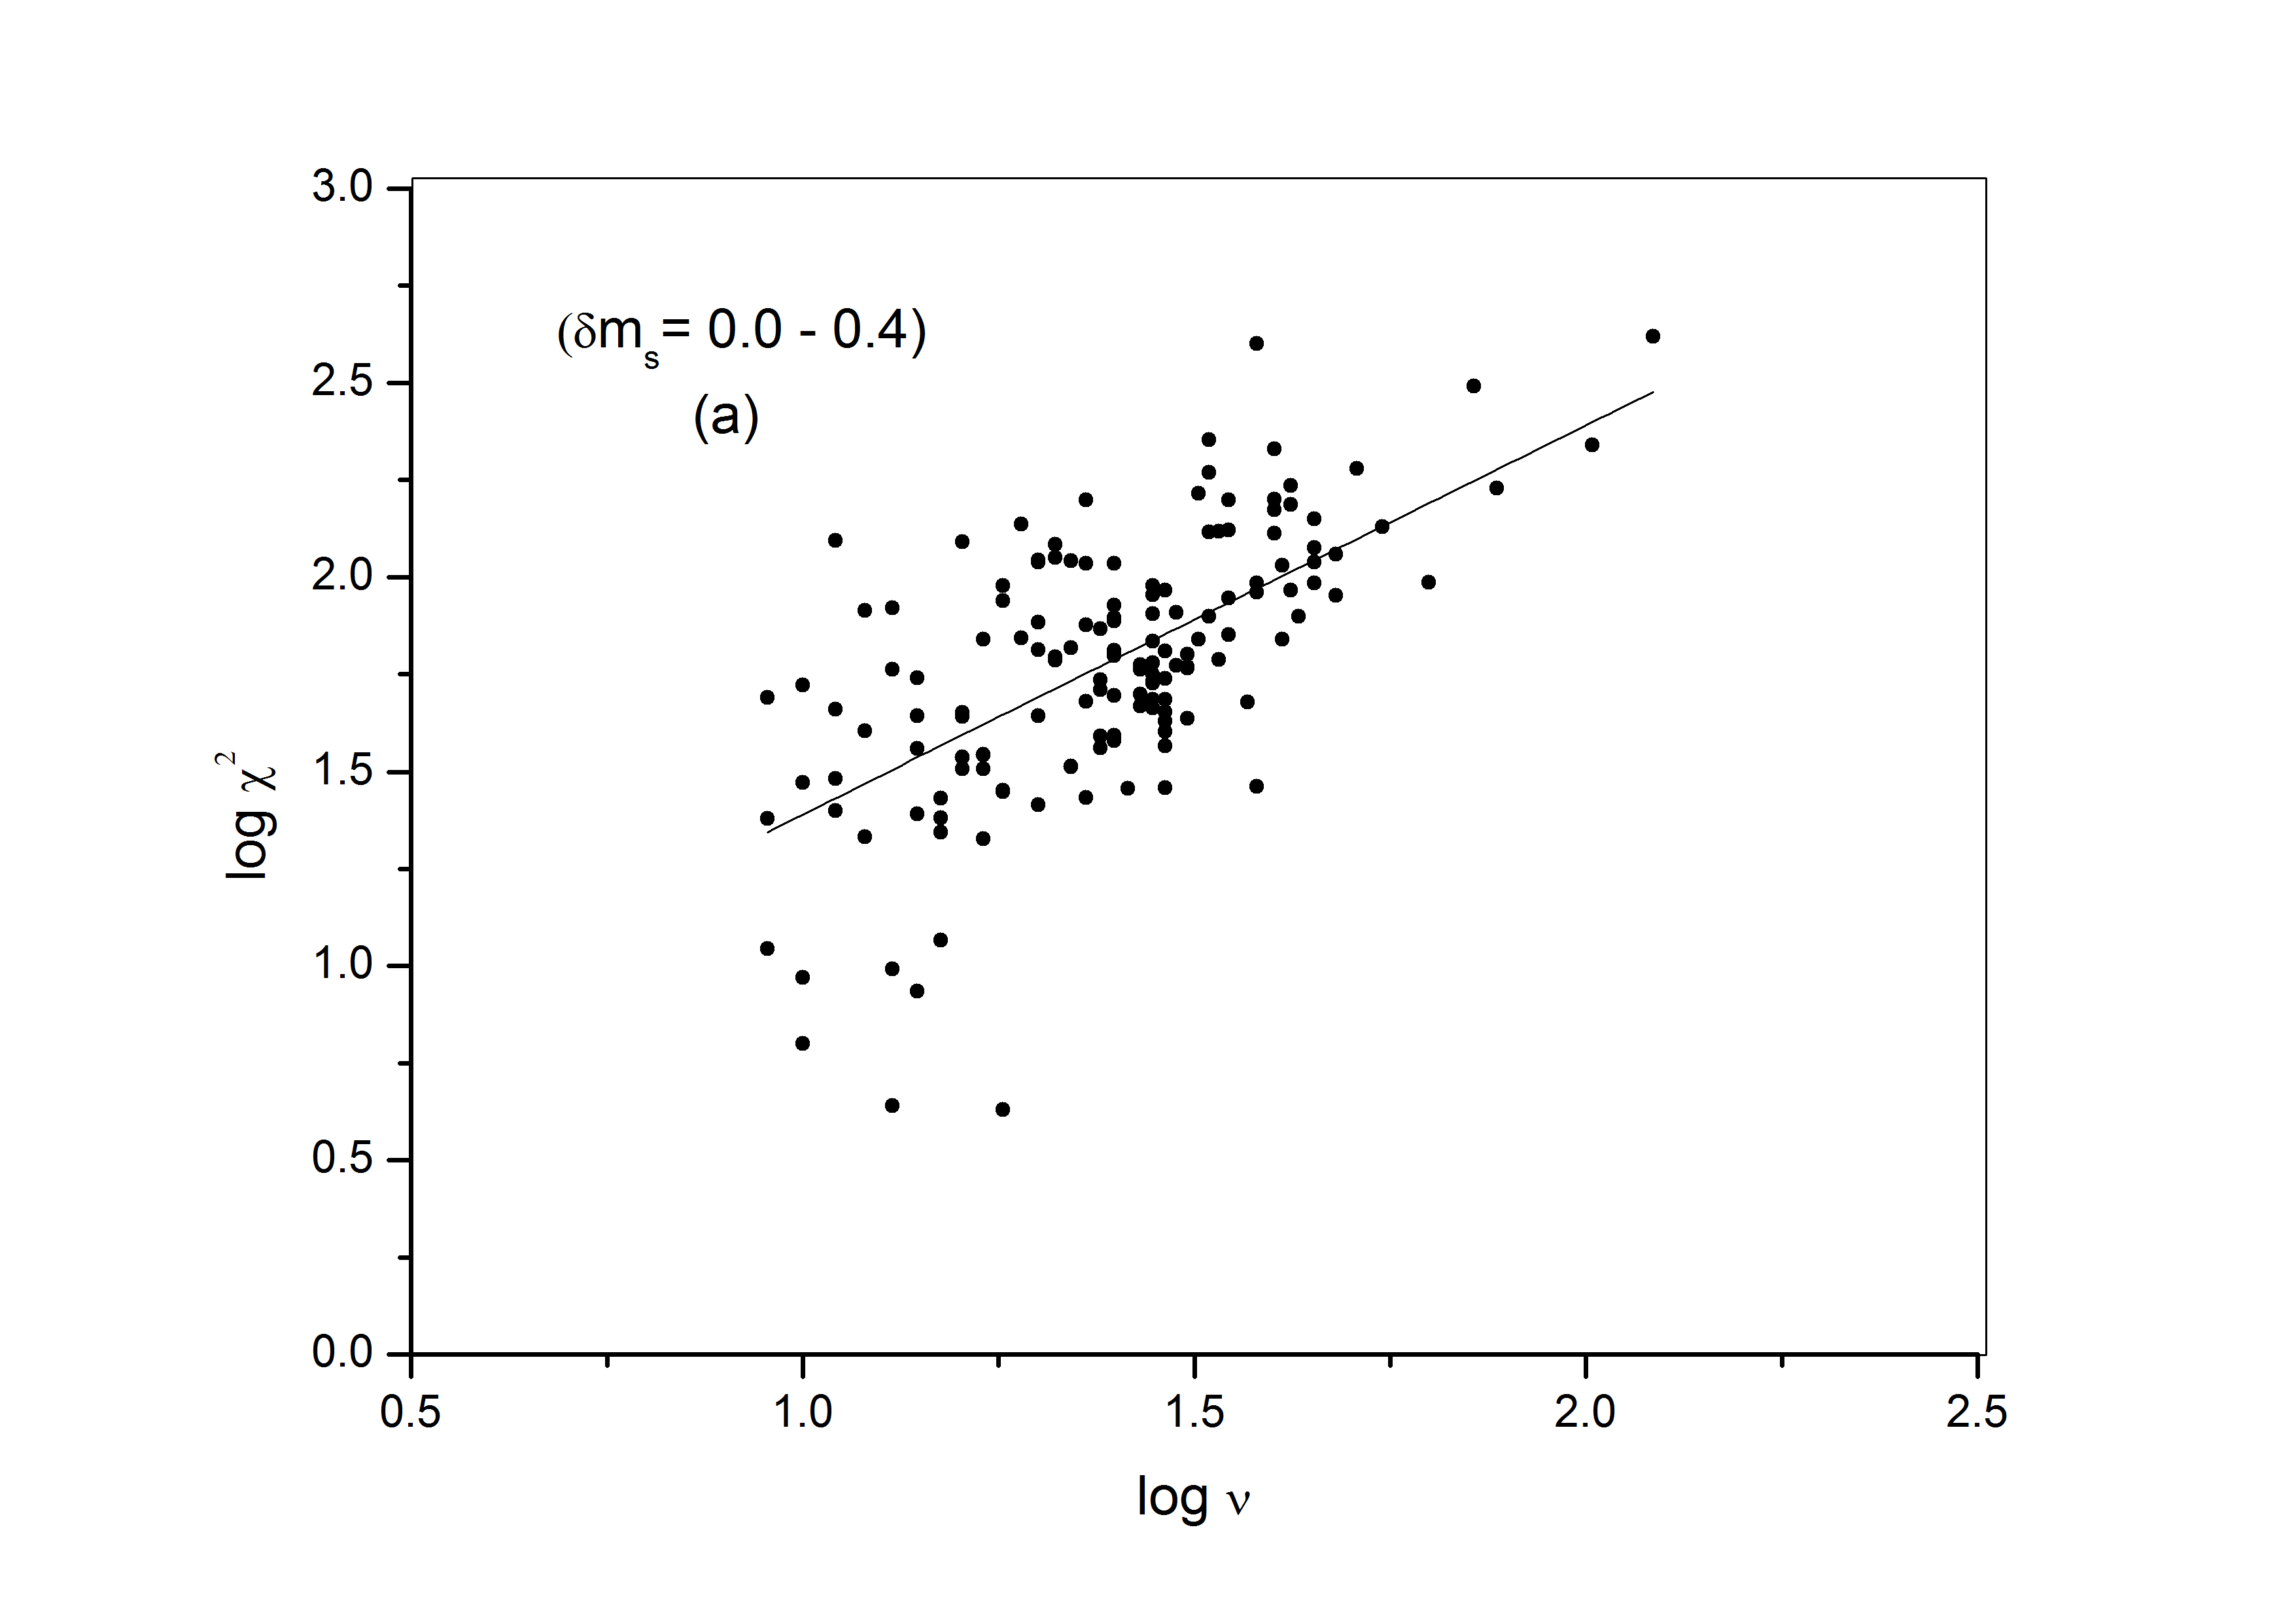
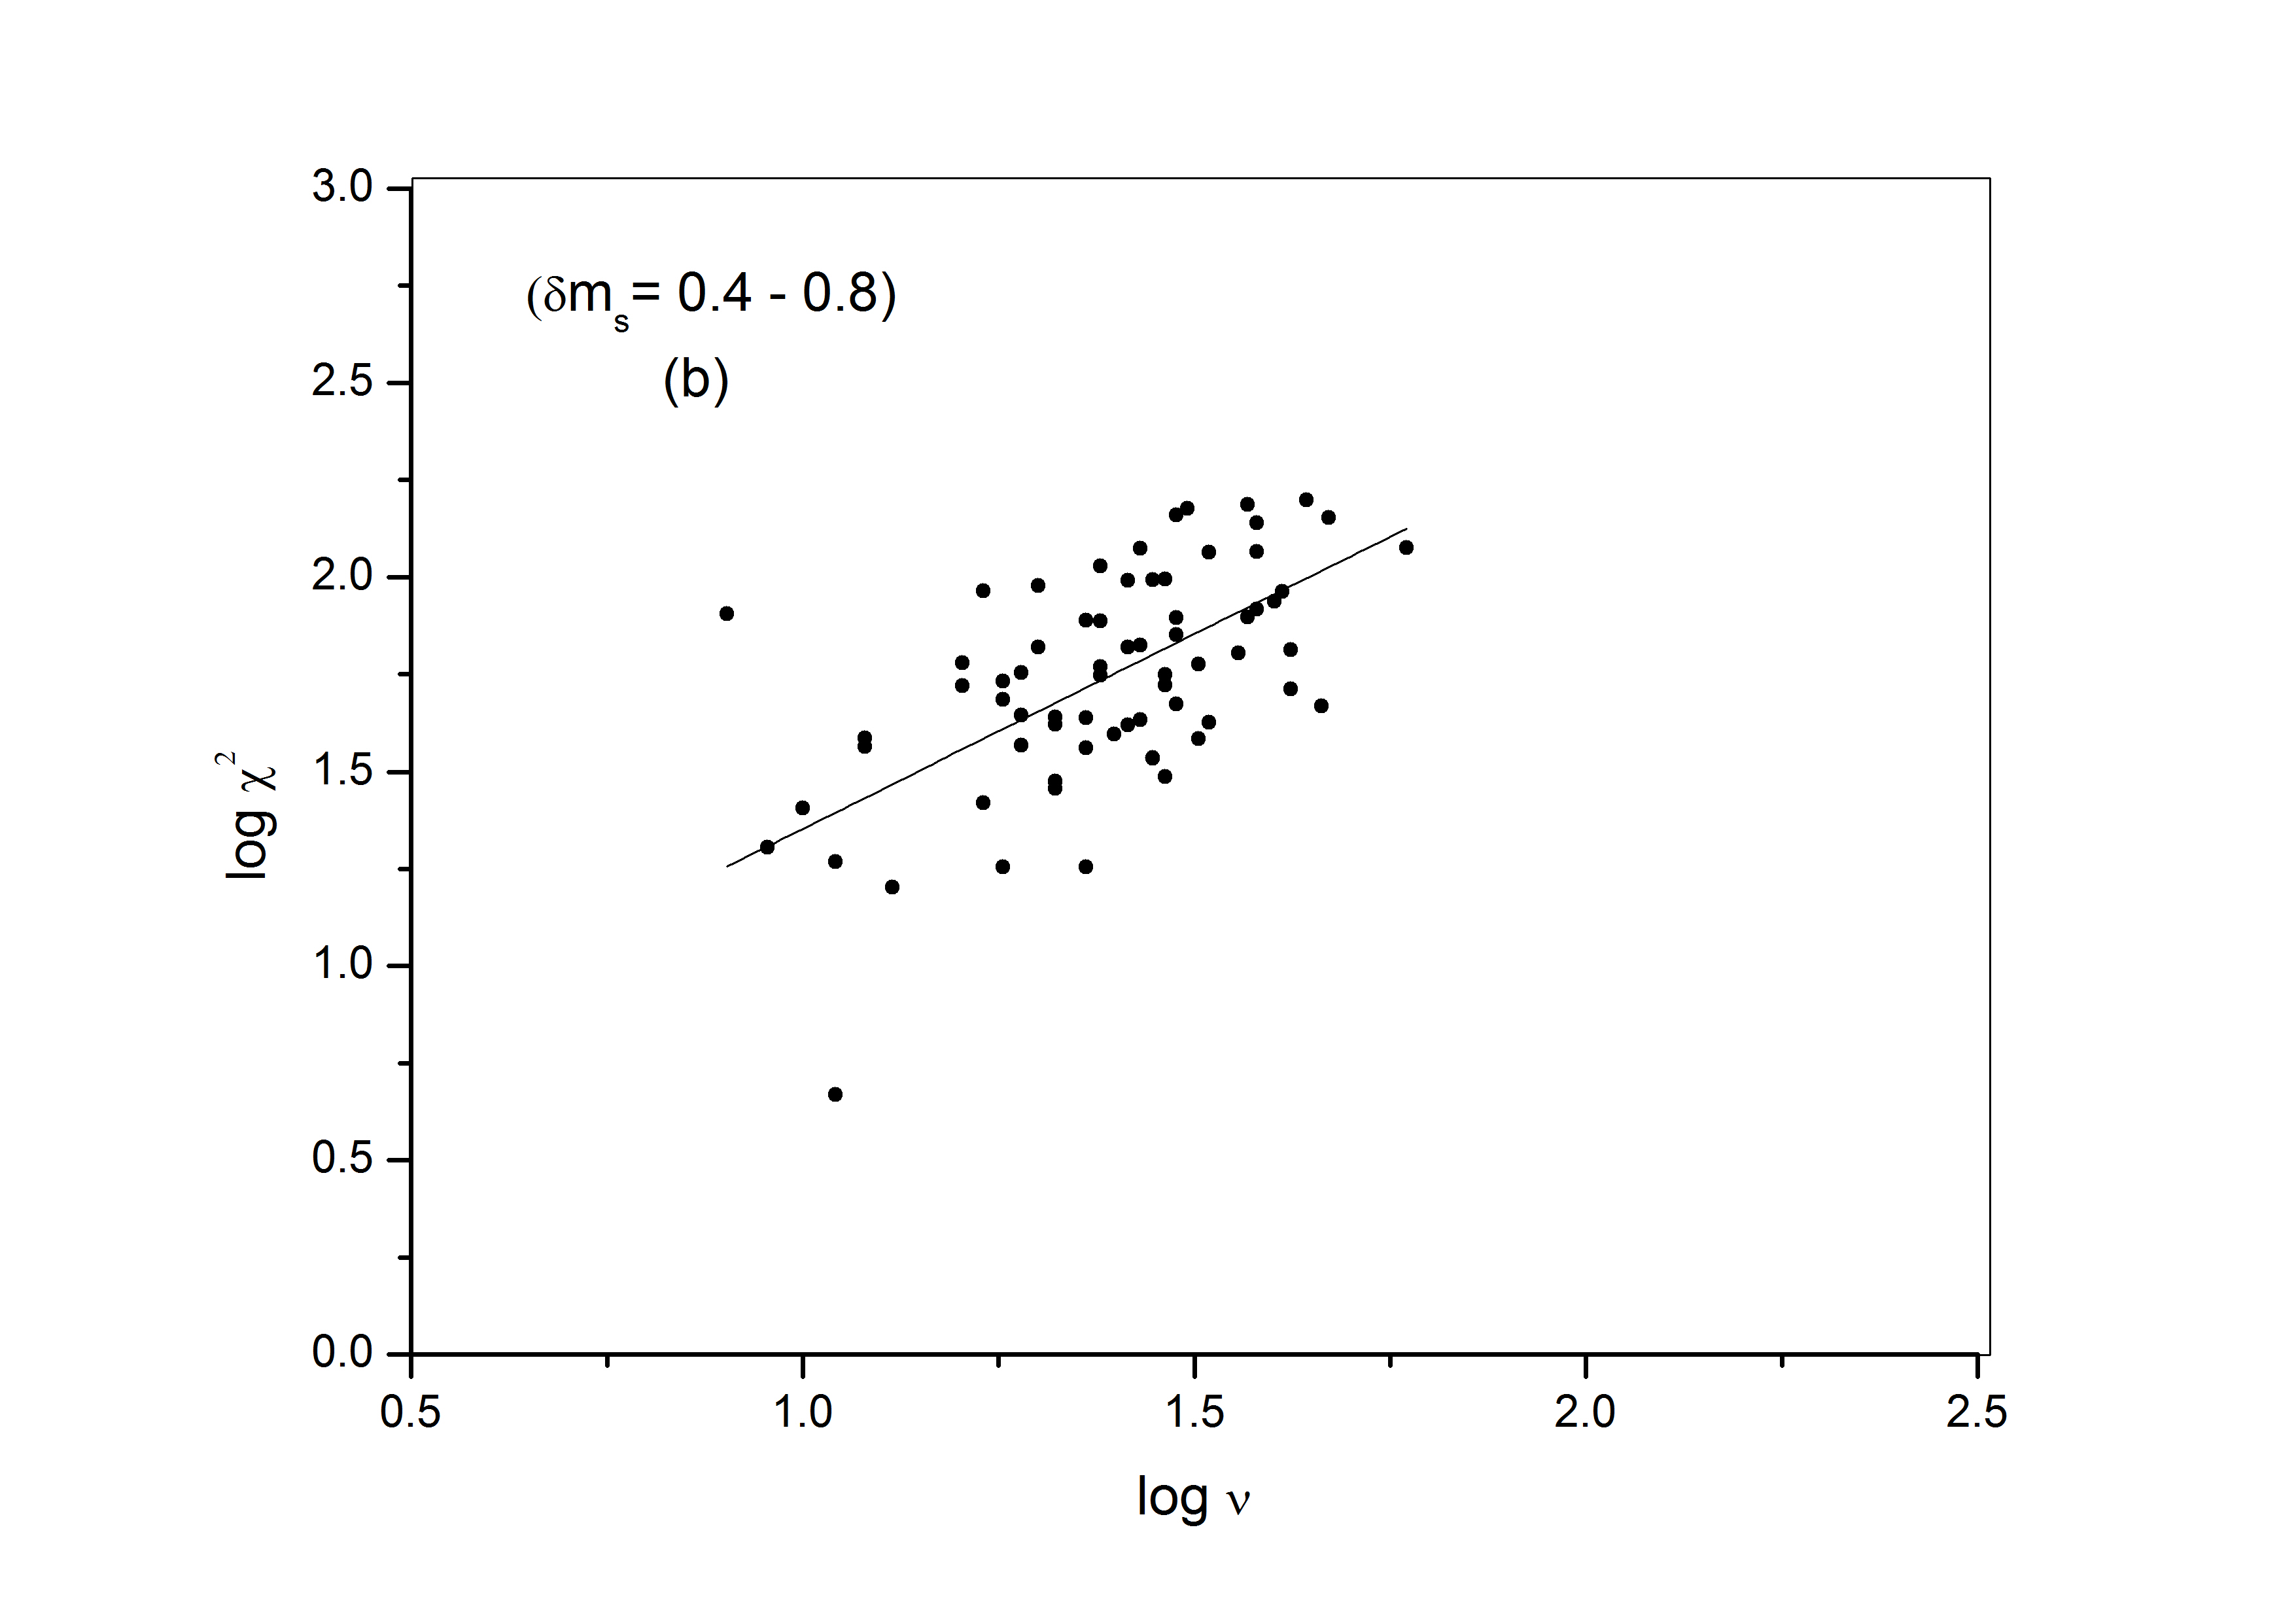
As mentioned in Sect.1, a principal goal of the present
study is to check the dependence of on the brightness
mismatch between the stars which are paired to derive the
‘steady’ star-star DLCs. For this, we divide our sample of
262 DLCs into subsamples corresponding to three intervals of
the apparent magnitude difference () between the star-pair
(see column 7 of Table 1).
These subsamples have in the ranges 0.00-0.40 mag (148 DLCs),
0.40-0.80 mag (69 DLCs) and 0.80 to 1.50 mag (39 DLCs).
Out of the 262 DLCs star-star DLCs considered here, only 6 have mag.
The computed values of for the three subsamples are
plotted in Fig. 3. We apply the regression
analysis, as explained above, to compute the values
for these subsamples. These values of are found to be
1.56 0.07, 1.50 0.09 and 1.56 0.13
for the subsamples defined by
0.00 0.40, 0.40 0.80
and 0.80 1.50, respectively.
We note that these values of are mutually consistent
for the three magnitude bins.
We thus conclude that the determination of is essentially independent of the brightness
mismatch of at least up to 1.5 mag between the comparison stars used.

5 Discussion
In order to counter-check these findings, we now subject our analysis
to a sanity check (Table 1).
For this we have computed the expected number of false
positives (‘Type 1 error’) for our dataset of 262 DLCs. We have
thus performed the (Eq. 2) on the 262 steady star-star
DLCs after accounting for the photometric error underestimation factor (i.e.,
replacing the denominator with in Eq. 2).
The expression for is given by
where and are the variances of the numerator and
the denominator and the and are the corresponding
degrees of freedom.
In our analysis, we have simplified the expression to as
= is the degree of freedom for the ‘star-star’ DLC.
In this way, the -value was computed for each DLC and compared with
the critical -value. Recall that smaller the ,
the less likely is it to occur by chance. For the present study, we
have used two values of significance level, = 0.01 and 0.05.
Thus we claim a spurious INOV detection for a DLC,
when the computed value exceeds
the critical value at 0.01. We thus assign a ‘variable’
designation (V) to it. We assign a ‘probable variable’ (PV) designation when
the computed value is found to be between the
critical values at 0.01 and 0.05, otherwise
‘non-variable’ (N) designation as assigned to the ‘star-star’ DLC.
Following this analysis, out of 262 steady ‘star-star’ DLCs,
6 DLCs were found to be of ‘V’ type, while 12 were designated
as ‘PV’ (Table 1). At (i.e., 0.99),
we expect among the 262 ‘star-star’ DLCs, 3 DLCs to
be falsely classified as ‘V’. Similarly, at
(i.e., 0.95), the expected number of false positives
is 13. We find that for our analysis, the observed
number of false positive is 6 at 0.01 and 18 at 0.05.
Since the distribution of false positives (Type 1 errors)
is binomial, we expect its actual number for a given test will be between 0
and 9 and in most cases between 32 at . Similarly, at ,
the actual number of false positives will be between 2 and 24 and
in most cases will be 13 4. The good match between the observed
and expected values of false positives validates our
analysis procedure adopting = 1.54 as determined here.
Also, for our three subsamples defined in Sect. 4, we find the expected numbers of false postives for most cases will be 21 (148 DLCs in the magnitude bin ), 11 (69 DLCs in the magnitude bin ) and 11 (39 DLCs in the magnitude bin ) at . We find that the observed numbers for false positives are 4, 1 and 1. Similarly, at , expected numbers of false postives for most cases will be 73 (148 DLCs in the magnitude bin ), 42 (69 DLCs in the magnitude bin ) and 22 (39 DLCs in the magnitude bin ) at. We find that the observed numbers for false positives are 10, 3 and 5, respectively. This again shows a close match between the observed and expected values of false positives, validating the estimate of up to a magnitude mismatch of 1.5 mag between the comparison star pairs.
The vast majority of the data analyzed here comes from ST and therefore our results strictly apply to those observations. The data from the HCT, IGO, GSO and VBT all seem consistent with the ST results, but each of these telescopes contributed measurements that are not numerous enough to perform useful separate analyses for these telescopes. Therefore we cannot yet determine whether the value of we have found is a fundamental feature of ’s and thus universal, or somewhat dependent on the telescope and the instrument used. Over the next couple of years we anticipate obtaining comparably large data sets with a new ARIES 1.3 m telescope located at a different site near Nainital. We will perform a similar analysis of the values of for those additional data and that will lead us to a better grasp of the root of this error underestimation. We do, however, note that because the seeing varied substantially (from 0.7 to 3.5 arc sec) for the data we have employed here, the value of does seem to be fairly independent of this important aspect of the differential photometry process.
6 Summary
In this study, we have determined the photometric error underestimation factor
applicable to point-source aperture photometry carried out
using the IRAF (APPHOT) software. For this we have used an
unprecedentedly large set of 262 DLCs taken on 262 nights, about 85 per cent
of which are taken with the 1-m telescope (ST) of ARIES. By subjecting
this large database to
a analysis we
find that = 1.540.05, which is consistent with the
most recently published estimate of this important parameter,
which was derived using a 4 times smaller sample of DLCs than we
have used here
(see, Goyal et al. 2012). A sanity check, based on
the computation of ‘false positives’ employing the -test,
was performed and it has validated the estimate of = 1.54.
We have further checked for any dependence of the factor on the
apparent magnitude mismatch () between the comparison stars
paired (taking them to be steady, as inferred from inspection of their DLCs).
For this we divided our sample of DLCs into three subsamples, characterized
by (148 DLCs), (69)
and (39 DLCs).
For each subsample the sanity check again showed consistency with = 1.54.
It is thus concluded that = 1.54
remains valid even when the magnitudes of the ‘steady’ stars paired to
derive a DLC differ by as much as 1.5 mag. In other words, even a magnitude
difference of up to 1.5-mag between the two stars paired to derive a DLC and ,
should not result in a spurious claim of INOV for either of the two stars.
As a corollary, it can be reasonably asserted that deriving DLCs of (point-like) AGN
using a comparison star that is within about 1.5 magnitude of the AGN, should
not lead to spurious claim of INOV for the AGN. However, this could well
be the case for significantly larger magnitude mismatches, as argued
by Cellone et al. (2007) in the context of some claims of
dramatic INOV.
The present analysis is dominated by the band data taken using the
ARIES 1-m telescope (ST). Therefore, the present conclusion strictly
apply only to the band taken with this telescope.
In the coming years, we plan to expand the present analysis to observation
taken with the 1.3-m Devasthal Optical Telescope (DOT) recently installed
at a site well removed from that of the ST.
| AGN | Obs. date | Tel.¶ | Filter. | Dur. | std dev. | Status† | Ref£. | |||||
|---|---|---|---|---|---|---|---|---|---|---|---|---|
| name | dd.mm.yy | used | used | (hr) | (mag) | ( mag) | ( mag) | |||||
| (1) | (2) | (3) | (4) | (5) | (6) | (7) | (8) | (9) | (10) | (11) | (12) | (13) |
| Radio quiet quasars (RQQs)[22 sources; 68 DLCs] | ||||||||||||
| J00450410 | 21.10.98 | ST | R | 2.39 | 14 | 0.376 | 0.5 | 0.2 | 4.37 | 0.13 | N | (a) |
| J00450410 | 05.11.98 | ST | R | 3.21 | 30 | 0.369 | 0.8 | 1.0 | 40.05 | 0.55 | N | (a) |
| J00450410 | 16.10.04 | HCT | R | 6.04 | 25 | 1.859 | 0.1 | 0.2 | 79.36 | 1.24 | N | (b) |
| J01030321 | 05.11.05 | HCT | R | 5.94 | 21 | 1.093 | 0.3 | 0.4 | 36.32 | 0.72 | N | (b) |
| J01030321 | 05.11.05 | ST | R | 5.83 | 20 | 0.570 | 0.4 | 0.6 | 44.09 | 1.02 | N | (b) |
| J02390001 | 06.11.05 | HCT | R | 6.42 | 19 | 0.779 | 0.1 | 0.2 | 53.90 | 1.26 | N | (b) |
| J05160027 | 10.12.01 | ST | R | 5.77 | 23 | 0.160 | 0.3 | 0.3 | 32.50 | 0.56 | N | (c) |
| J05160027 | 19.12.01 | ST | R | 7.52 | 35 | 0.210 | 0.3 | 0.5 | 131.13 | 1.16 | N | (c) |
| J05160027 | 20.11.03 | HCT | R | 7.28 | 39 | 0.264 | 0.1 | 0.2 | 96.37 | 1.07 | N | (b) |
| J05160027 | 18.11.04 | ST | R | 6.29 | 34 | 0.282 | 0.1 | 0.2 | 79.19 | 1.01 | N | (b) |
| J05160027 | 16.12.04 | HCT | R | 6.79 | 34 | 1.256 | 0.2 | 0.2 | 63.96 | 0.60 | N | (b) |
| J07512919 | 14.12.98 | ST | R | 7.41 | 40 | 1.569 | 0.3 | 0.6 | 145.70 | 1.57 | N | (c) |
| J07512919 | 13.01.99 | ST | R | 8.32 | 56 | 0.362 | 0.3 | 0.5 | 134.70 | 0.93 | N | (c) |
| J07512919 | 24.11.99 | ST | R | 5.39 | 28 | 0.702 | 0.3 | 0.3 | 42.90 | 0.62 | N | (c) |
| J07512919 | 09.12.99 | ST | R | 6.21 | 31 | 0.710 | 0.2 | 0.5 | 144.38 | 2.13 | PV | (c) |
| J07512919 | 01.12.00 | ST | R | 5.95 | 32 | 0.372 | 0.3 | 0.4 | 63.30 | 0.78 | N | (c) |
| J07512919 | 25.12.01 | ST | R | 5.44 | 30 | 0.372 | 0.4 | 0.4 | 36.78 | 0.54 | N | (c) |
| J07512919 | 17.12.04 | HCT | V | 3.69 | 15 | 0.318 | 0.1 | 0.2 | 24.61 | 0.74 | N | (b) |
| J07512919 | 17.12.04 | ST | R | 7.02 | 34 | 0.238 | 0.1 | 0.3 | 130.66 | 1.56 | N | (b) |
| J07512919 | 12.01.05 | ST | R | 7.15 | 16 | 0.129 | 0.1 | 0.2 | 22.10 | 0.61 | N | (b) |
| J07512919 | 07.03.06 | HCT | R | 8.06 | 29 | 0.046 | 0.1 | 0.2 | 55.95 | 0.84 | N | (b) |
| J07512919 | 07.03.06 | ST | R | 8.33 | 46 | 0.079 | 0.1 | 0.2 | 141.20 | 1.32 | N | (b) |
| J08270942 | 27.12.98 | ST | R | 8.15 | 60 | 0.415 | 0.3 | 0.4 | 119.04 | 0.88 | N | (a) |
| J08270942 | 13.01.05 | HCT | V | 6.47 | 16 | 0.061 | 0.1 | 0.2 | 24.02 | 0.67 | N | (b) |
| J08270942 | 13.01.05 | ST | R | 6.94 | 17 | 0.000 | 0.1 | 0.2 | 44.74 | 1.18 | N | (b) |
| J08352506 | 25.12.98 | ST | R | 4.68 | 26 | 0.911 | 0.4 | 0.6 | 67.49 | 1.13 | N | (a) |
| J08352506 | 14.01.99 | ST | R | 8.91 | 78 | 0.206 | 0.4 | 0.6 | 169.41 | 0.92 | N | (a) |
| J08352506 | 10.12.99 | ST | R | 6.72 | 33 | 0.714 | 0.4 | 0.6 | 59.65 | 0.75 | N | (a) |
| J08534349 | 17.02.99 | ST | R | 7.70 | 39 | 0.234 | 0.4 | 0.7 | 91.50 | 0.99 | N | (a) |
| J09354331 | 20.02.99 | ST | R | 4.47 | 26 | 0.883 | 0.2 | 0.3 | 106.91 | 1.69 | N | (a) |
| J09384128 | 27.03.99 | ST | R | 2.73 | 17 | 0.000 | 0.5 | 0.6 | 34.40 | 0.73 | N | (a) |
| J09484335 | 15.01.99 | ST | R | 7.97 | 44 | 0.209 | 0.3 | 0.5 | 79.10 | 0.80 | N | (c) |
| J09484335 | 26.02.00 | ST | R | 7.97 | 39 | 0.490 | 0.4 | 0.6 | 82.44 | 0.91 | N | (c) |
| J09484335 | 23.01.01 | ST | R | 6.73 | 25 | 0.505 | 0.3 | 0.6 | 77.02 | 1.20 | N | (c) |
| J10192744 | 14.03.99 | ST | R | 7.32 | 43 | 0.304 | 0.5 | 0.7 | 92.57 | 0.86 | N | (c) |
| J10192744 | 14.01.00 | ST | R | 7.08 | 34 | 0.441 | 0.2 | 0.2 | 42.28 | 0.52 | N | (c) |
| J10192744 | 27.02.00 | ST | R | 8.81 | 37 | 0.442 | 0.2 | 0.3 | 63.77 | 0.61 | N | (c) |
| J10323240 | 13.03.99 | VBT | V | 8.40 | 45 | 0.503 | 0.5 | 0.8 | 158.00 | 1.16 | N | (c) |
| J10323240 | 02.03.00 | ST | R | 4.95 | 19 | 0.887 | 0.2 | 0.4 | 64.64 | 1.45 | N | (c) |
| J10323240 | 05.04.00 | ST | R | 6.17 | 24 | 0.136 | 0.1 | 0.3 | 108.19 | 1.85 | PV | (c) |
| J10323240 | 23.03.01 | ST | R | 6.84 | 25 | 0.303 | 0.5 | 0.6 | 51.32 | 0.83 | N | (c) |
| J10323240 | 06.03.02 | ST | R | 8.53 | 34 | 0.134 | 0.2 | 0.3 | 185.91 | 1.28 | N | (c) |
| J10323240 | 08.03.02 | ST | R | 8.31 | 24 | 0.127 | 0.2 | 0.3 | 75.22 | 1.17 | N | (c) |
| J11043141 | 12.03.99 | ST | R | 8.80 | 43 | 0.551 | 0.6 | 0.7 | 51.55 | 0.48 | N | (c) |
| J11043141 | 14.04.00 | ST | R | 5.61 | 22 | 0.035 | 0.3 | 0.5 | 62.25 | 1.01 | N | (c) |
| J11043141 | 21.04.01 | ST | R | 6.40 | 27 | 0.032 | 0.5 | 0.5 | 28.59 | 0.41 | N | (c) |
| J11043141 | 22.04.01 | ST | R | 5.58 | 24 | 0.037 | 0.5 | 0.5 | 27.08 | 0.43 | N | (c) |
| J11192119 | 14.04.05 | ST | R | 5.02 | 30 | 0.065 | 0.1 | 0.2 | 48.37 | 0.70 | N | (b) |
| J11192119 | 30.03.06 | ST | R | 6.17 | 41 | 0.072 | 0.1 | 0.3 | 149.11 | 1.57 | N | (b) |
| J11192119 | 31.03.06 | ST | R | 4.25 | 26 | 0.070 | 0.1 | 0.2 | 49.47 | 0.83 | N | (b) |
| J12460224 | 13.04.05 | ST | R | 5.51 | 10 | 0.046 | 0.1 | 0.3 | 48.90 | 2.01 | N | (b) |
| J12550144 | 22.03.99 | ST | R | 7.46 | 43 | 0.483 | 0.4 | 0.5 | 64.91 | 0.59 | N | (c) |
| J12550144 | 09.03.00 | ST | R | 6.14 | 29 | 0.144 | 0.1 | 0.2 | 80.28 | 1.05 | N | (c) |
| J12550144 | 03.04.00 | ST | R | 4.32 | 21 | 0.154 | 0.1 | 0.4 | 109.28 | 2.53 | V | (c) |
| J12550144 | 26.04.01 | ST | R | 4.60 | 20 | 0.107 | 0.2 | 0.5 | 136.56 | 1.88 | N | (c) |
| J12550144 | 18.03.02 | ST | R | 7.88 | 25 | 0.130 | 0.4 | 0.3 | 73.50 | 0.36 | N | (c) |
| J14244214 | 03.04.99 | ST | R | 7.22 | 41 | 0.056 | 0.3 | 0.6 | 158.64 | 1.48 | N | (a) |
| J14244214 | 07.03.00 | ST | R | 3.88 | 15 | 0.380 | 0.2 | 0.3 | 55.01 | 1.34 | N | (a) |
| J14244214 | 08.03.00 | GSO | V | 3.05 | 30 | 0.385 | 0.6 | 0.8 | 54.71 | 0.76 | N | (a) |
| J15240958 | 11.04.99 | ST | R | 6.55 | 38 | 0.491 | 0.2 | 0.3 | 78.81 | 0.96 | N | (a) |
| J15282825 | 10.05.05 | ST | R | 7.75 | 16 | 0.065 | 0.2 | 0.2 | 27.00 | 0.33 | N | (b) |
| J16312953 | 15.06.04 | HCT | V | 6.21 | 28 | 1.110 | 0.2 | 0.4 | 64.31 | 1.00 | N | (b) |
| J16312953 | 11.05.05 | ST | R | 6.92 | 29 | 0.006 | 0.3 | 0.4 | 53.36 | 0.62 | N | (b) |
| J16312953 | 01.06.05 | ST | R | 7.36 | 15 | 1.369 | 0.2 | 0.4 | 30.35 | 0.93 | N | (b) |
| J16323737 | 12.05.05 | ST | R | 6.60 | 29 | 0.289 | 0.2 | 0.2 | 53.95 | 0.72 | N | (b) |
| J17515045 | 03.06.98 | ST | R | 4.72 | 46 | 0.373 | 0.2 | 0.3 | 109.29 | 1.00 | N | (a) |
| J17515045 | 06.06.98 | ST | R | 1.65 | 17 | 0.384 | 0.3 | 0.4 | 32.15 | 0.93 | N | (a) |
| J17515045 | 08.06.98 | ST | R | 6.15 | 36 | 0.021 | 0.2 | 0.3 | 157.64 | 1.78 | PV | (a) |
| Radio intermediate quasars (RIQs)[10 sources; 31 DLCs] | ||||||||||||
| J00051609 | 03.11.00 | ST | R | 6.55 | 30 | 0.302 | 0.3 | 0.3 | 44.85 | 0.61 | N | (a) |
| J00051609 | 05.11.00 | ST | R | 7.74 | 39 | 0.028 | 0.4 | 0.3 | 28.94 | 0.30 | N | (a) |
| J07482200 | 19.01.07 | ST | R | 5.20 | 19 | 0.030 | 0.3 | 0.3 | 28.12 | 0.62 | N | (d) |
| J07482200 | 23.01.07 | ST | R | 7.21 | 25 | 0.149 | 0.3 | 0.4 | 38.97 | 0.64 | N | (d) |
| J07482200 | 19.02.07 | ST | R | 6.42 | 24 | 0.614 | 0.3 | 0.4 | 77.17 | 1.24 | N | (d) |
| J07482200 | 29.01.08 | IGO | R | 5.41 | 19 | 0.627 | 0.1 | 0.1 | 17.96 | 0.42 | N | (d) |
| J07482200 | 30.01.08 | IGO | R | 6.03 | 20 | 0.805 | 0.1 | 0.2 | 33.25 | 0.67 | N | (d) |
| J08323707 | 23.01.07 | HCT | R | 4.91 | 29 | 0.265 | 0.2 | 0.2 | 60.16 | 0.88 | N | (d) |
| J08323707 | 21.02.07 | ST | R | 4.70 | 21 | 0.193 | 0.1 | 0.2 | 43.88 | 0.92 | N | (d) |
| J08323707 | 10.03.07 | IGO | R | 5.04 | 10 | 0.203 | 0.2 | 0.2 | 11.06 | 0.59 | N | (d) |
| J08323707 | 11.03.07 | IGO | R | 5.09 | 10 | 0.204 | 0.2 | 0.3 | 23.95 | 1.16 | N | (d) |
| J08364426 | 22.01.07 | ST | R | 5.61 | 24 | 1.288 | 0.2 | 0.2 | 19.63 | 0.35 | N | (d) |
| J08364426 | 10.02.07 | IGO | R | 5.58 | 15 | 0.815 | 0.2 | 0.3 | 36.26 | 1.00 | N | (d) |
| J08364426 | 09.03.07 | IGO | R | 5.16 | 16 | 0.864 | 0.2 | 0.3 | 39.16 | 1.49 | N | (d) |
| J09075515 | 04.02.08 | IGO | R | 8.99 | 24 | 0.247 | 0.2 | 0.3 | 47.80 | 0.75 | N | (d) |
| J09075515 | 05.02.08 | IGO | R | 7.48 | 13 | 0.365 | 0.1 | 0.3 | 40.08 | 1.33 | N | (d) |
| J12593423 | 19.04.07 | ST | R | 5.40 | 21 | 0.673 | 0.2 | 0.4 | 95.09 | 1.63 | N | (d) |
| J12593423 | 20.04.07 | ST | R | 6.40 | 27 | 0.673 | 0.2 | 0.3 | 66.00 | 0.80 | N | (d) |
| J12593423 | 24.04.07 | ST | R | 5.30 | 22 | 0.688 | 0.2 | 0.3 | 41.81 | 0.79 | N | (d) |
| J13123515 | 25.03.99 | ST | R | 6.67 | 39 | 0.097 | 0.2 | 0.5 | 398.57 | 2.79 | V | (e) |
| J13123515 | 01.04.01 | ST | R | 4.87 | 32 | 0.443 | 0.2 | 0.4 | 149.98 | 2.52 | V | (e) |
| J13123515 | 02.04.01 | ST | R | 5.19 | 41 | 0.696 | 0.3 | 0.4 | 86.44 | 0.81 | N | (e) |
| J13361725 | 11.04.05 | ST | R | 7.93 | 29 | 0.305 | 0.1 | 0.2 | 53.60 | 0.80 | N | (d) |
| J13361725 | 08.05.05 | ST | R | 4.47 | 17 | 0.739 | 0.2 | 0.3 | 60.18 | 1.53 | N | (d) |
| J13361725 | 13.04.08 | ST | R | 8.06 | 20 | 0.731 | 0.2 | 0.3 | 56.65 | 1.33 | N | (d) |
| J15394735 | 27.05.09 | ST | R | 6.26 | 30 | 0.776 | 0.3 | 0.4 | 52.69 | 0.69 | N | (d) |
| J15394735 | 02.06.09 | ST | R | 7.03 | 30 | 0.779 | 0.4 | 0.5 | 56.11 | 0.68 | N | (d) |
| J15394735 | 14.06.09 | ST | R | 5.30 | 24 | 0.776 | 0.4 | 0.5 | 36.33 | 0.54 | N | (d) |
| J17194804 | 29.04.06 | ST | R | 4.88 | 25 | 0.131 | 0.1 | 0.2 | 54.32 | 0.95 | N | (d) |
| J17194804 | 30.04.06 | ST | R | 5.64 | 22 | 0.195 | 0.1 | 0.2 | 61.02 | 1.22 | N | (d) |
| J17194804 | 30.05.06 | ST | R | 6.06 | 26 | 0.031 | 0.2 | 0.3 | 62.64 | 0.85 | N | (d) |
| Lobe dominated quasars (LDQs)[9 sources; 25 DLCs] | ||||||||||||
| J00153052 | 18.01.01 | ST | R | 3.78 | 18 | 0.241 | 0.5 | 0.5 | 21.29 | 0.40 | N | (c) |
| J00153052 | 20.01.01 | ST | R | 2.70 | 12 | 0.457 | 0.6 | 0.3 | 4.66 | 0.16 | N | (c) |
| J00153052 | 24.01.01 | ST | R | 2.87 | 14 | 0.242 | 0.6 | 0.5 | 9.82 | 0.25 | N | (c) |
| J00153052 | 14.10.01 | ST | R | 6.78 | 26 | 0.235 | 0.6 | 0.7 | 37.85 | 0.51 | N | (c) |
| J00153052 | 21.10.01 | ST | R | 6.25 | 24 | 0.703 | 0.5 | 0.5 | 17.98 | 0.36 | N | (c) |
| J00283103 | 13.10.98 | ST | R | 3.60 | 28 | 0.241 | 0.1 | 0.2 | 57.87 | 0.90 | N | (a) |
| J00283103 | 01.11.98 | ST | R | 3.35 | 26 | 0.260 | 0.2 | 0.3 | 76.98 | 1.14 | N | (a) |
| J01373309 | 07.11.01 | ST | R | 6.54 | 36 | 0.089 | 0.6 | 0.5 | 88.24 | 0.28 | N | (c) |
| J01373309 | 08.11.01 | ST | R | 6.66 | 32 | 0.132 | 0.3 | 0.4 | 58.61 | 0.70 | N | (c) |
| J01373309 | 13.11.01 | ST | R | 8.63 | 46 | 0.213 | 0.3 | 0.4 | 119.10 | 1.07 | N | (c) |
| J03520711 | 14.11.01 | ST | R | 6.56 | 31 | 0.617 | 0.2 | 0.3 | 70.99 | 0.80 | N | (c) |
| J03520711 | 15.11.01 | ST | R | 5.54 | 26 | 0.630 | 0.2 | 0.3 | 39.30 | 0.66 | N | (c) |
| J03520711 | 18.11.01 | ST | R | 5.70 | 25 | 0.628 | 0.2 | 0.4 | 106.55 | 1.42 | N | (c) |
| J07133656 | 20.01.01 | ST | R | 6.51 | 29 | 0.191 | 0.3 | 0.3 | 45.90 | 0.72 | N | (c) |
| J07133656 | 21.01.01 | ST | R | 6.40 | 30 | 0.190 | 0.3 | 0.3 | 42.60 | 0.61 | N | (c) |
| J07133656 | 25.01.01 | ST | R | 7.08 | 31 | 0.453 | 0.3 | 0.3 | 46.97 | 0.66 | N | (c) |
| J07133656 | 20.12.01 | ST | R | 8.07 | 52 | 0.202 | 0.3 | 0.6 | 190.47 | 1.56 | N | (c) |
| J07133656 | 21.12.01 | ST | R | 7.49 | 48 | 0.449 | 0.2 | 0.4 | 142.06 | 1.20 | N | (c) |
| J10071248 | 16.02.99 | ST | R | 6.51 | 36 | 1.000 | 0.1 | 0.3 | 213.36 | 2.42 | V | (c) |
| J10071248 | 27.02.99 | ST | R | 4.27 | 30 | 0.996 | 0.4 | 0.4 | 39.70 | 0.51 | N | (c) |
| J10071248 | 29.03.00 | ST | R | 3.81 | 21 | 1.012 | 0.1 | 0.2 | 58.34 | 1.23 | N | (c) |
| J10071248 | 30.03.00 | ST | R | 4.64 | 26 | 1.007 | 0.2 | 0.3 | 71.58 | 0.83 | N | (c) |
| J10071248 | 18.02.01 | ST | R | 5.54 | 42 | 1.015 | 0.2 | 0.4 | 112.96 | 1.16 | N | (c) |
| J10071248 | 24.03.01 | ST | R | 6.38 | 50 | 1.011 | 0.2 | 0.4 | 297.51 | 1.91 | PV | (c) |
| J11060052 | 17.03.99 | ST | R | 3.81 | 23 | 0.347 | 0.3 | 0.5 | 65.59 | 1.23 | N | (c) |
| J11060052 | 18.03.99 | ST | R | 7.51 | 42 | 0.348 | 0.3 | 0.5 | 107.03 | 0.99 | N | (c) |
| J11060052 | 16.04.00 | ST | R | 3.85 | 15 | 0.348 | 0.3 | 0.4 | 36.16 | 0.78 | N | (c) |
| J11060052 | 25.03.01 | ST | R | 7.18 | 28 | 0.343 | 0.3 | 0.4 | 49.79 | 0.70 | N | (c) |
| J11060052 | 14.04.01 | ST | R | 4.55 | 19 | 0.346 | 0.3 | 0.5 | 86.90 | 1.50 | N | (c) |
| J11060052 | 22.03.02 | ST | R | 6.13 | 18 | 0.342 | 0.2 | 0.3 | 32.21 | 0.78 | N | (c) |
| J16333924 | 04.06.99 | ST | R | 5.71 | 30 | 0.293 | 0.6 | 0.6 | 28.75 | 0.45 | N | (a) |
| J16333924 | 30.05.00 | ST | R | 3.54 | 14 | 0.542 | 0.5 | 0.6 | 15.95 | 0.52 | N | (a) |
| J23510109 | 13.10.01 | ST | R | 7.56 | 41 | 0.163 | 0.2 | 0.4 | 213.75 | 1.43 | N | (c) |
| J23510109 | 17.10.01 | ST | R | 7.80 | 43 | 0.032 | 0.2 | 0.3 | 153.36 | 1.17 | N | (c) |
| J23510109 | 18.10.01 | ST | R | 8.40 | 46 | 0.032 | 0.2 | 0.2 | 96.62 | 0.72 | N | (c) |
| Low optical polarization core dominated quasars (LPCDQs)[12 sources; 43 DLCs] | ||||||||||||
| J00050524 | 23.10.06 | ST | R | 7.05 | 16 | 0.132 | 0.3 | 0.2 | 11.64 | 0.31 | N | (f) |
| J00050524 | 18.11.06 | ST | R | 4.69 | 11 | 0.394 | 0.2 | 0.1 | 6.30 | 0.24 | N | (f) |
| J00050524 | 14.09.07 | ST | R | 5.31 | 12 | 0.370 | 0.2 | 0.4 | 30.33 | 1.14 | N | (f) |
| J00050524 | 16.09.07 | ST | R | 6.11 | 13 | 0.240 | 0.2 | 0.4 | 81.99 | 2.15 | N | (f) |
| J02350402 | 21.10.04 | ST | R | 7.25 | 15 | 0.127 | 0.1 | 0.2 | 43.88 | 1.15 | N | (f) |
| J02350402 | 22.10.04 | ST | R | 7.87 | 17 | 0.244 | 0.2 | 0.2 | 43.75 | 0.82 | N | (f) |
| J02350402 | 04.11.04 | ST | R | 6.19 | 25 | 0.249 | 0.2 | 0.2 | 36.34 | 0.51 | N | (f) |
| J02350402 | 05.11.04 | ST | R | 7.27 | 29 | 0.122 | 0.1 | 0.2 | 68.37 | 1.01 | N | (f) |
| J04560400 | 23.11.08 | ST | R | 5.50 | 24 | 0.405 | 0.2 | 0.3 | 43.41 | 0.79 | N | (f) |
| J04560400 | 29.11.08 | ST | R | 5.51 | 20 | 0.404 | 0.2 | 0.3 | 36.82 | 0.82 | N | (f) |
| J04560400 | 03.12.08 | ST | R | 5.38 | 22 | 0.529 | 0.3 | 0.3 | 28.65 | 0.59 | N | (f) |
| J07413112 | 20.01.06 | ST | R | 7.42 | 31 | 0.614 | 0.2 | 0.3 | 78.51 | 0.94 | N | (f) |
| J07413112 | 21.01.06 | ST | R | 4.01 | 18 | 0.766 | 0.2 | 0.3 | 26.33 | 0.63 | N | (f) |
| J07413112 | 18.12.06 | ST | R | 7.24 | 29 | 0.135 | 0.1 | 0.2 | 95.05 | 1.42 | N | (f) |
| J07413112 | 22.12.06 | ST | R | 7.72 | 32 | 0.140 | 0.1 | 0.2 | 58.35 | 0.79 | N | (f) |
| J08421835 | 04.02.06 | ST | R | 7.64 | 28 | 0.274 | 0.1 | 0.2 | 59.41 | 0.92 | N | (f) |
| J08421835 | 16.12.06 | ST | R | 5.96 | 14 | 0.277 | 0.1 | 0.4 | 83.30 | 2.57 | N | (f) |
| J08421835 | 21.12.06 | ST | R | 6.94 | 30 | 0.279 | 0.1 | 0.2 | 92.31 | 1.23 | N | (f) |
| J09583224 | 19.02.99 | ST | R | 6.50 | 36 | 1.729 | 0.4 | 0.4 | 35.19 | 0.39 | N | (e) |
| J09583224 | 03.03.00 | ST | R | 6.29 | 37 | 1.311 | 0.3 | 0.4 | 90.04 | 0.82 | N | (e) |
| J09583224 | 05.03.00 | ST | R | 6.90 | 34 | 0.430 | 0.1 | 0.3 | 115.79 | 1.48 | N | (e) |
| J11313114 | 18.01.01 | ST | R | 5.73 | 31 | 0.230 | 0.3 | 0.4 | 59.11 | 0.83 | N | (e) |
| J11313114 | 09.03.02 | ST | R | 8.22 | 27 | 0.435 | 0.3 | 0.3 | 41.50 | 0.52 | N | (e) |
| J11313114 | 10.03.02 | ST | R | 8.33 | 28 | 0.200 | 0.2 | 0.3 | 46.60 | 0.66 | N | (e) |
| J12283128 | 07.03.99 | ST | R | 6.63 | 49 | 1.299 | 0.3 | 0.6 | 165.97 | 1.42 | N | (e) |
| J12283128 | 07.04.00 | ST | R | 7.32 | 26 | 1.320 | 0.2 | 0.6 | 150.61 | 2.35P | V | (e) |
| J12283128 | 20.04.01 | ST | R | 7.43 | 34 | 1.357 | 0.6 | 0.7 | 46.63 | 0.59 | N | (e) |
| J12290203 | 07.03.11 | ST | R | 5.46 | 35 | 0.084 | 0.1 | 0.2 | 61.36 | 0.72 | N | (f) |
| J12290203 | 10.03.11 | ST | R | 6.72 | 49 | 0.047 | 0.1 | 0.2 | 114.60 | 1.00 | N | (f) |
| J13571919 | 27.02.06 | ST | R | 5.19 | 12 | 0.004 | 0.1 | 0.3 | 45.60 | 1.74 | N | (f) |
| J13571919 | 05.03.06 | ST | R | 4.94 | 11 | 0.766 | 0.1 | 0.2 | 25.52 | 1.07 | N | (f) |
| J13571919 | 26.03.06 | ST | R | 6.98 | 12 | 0.025 | 0.1 | 0.5 | 124.20 | 4.76 | V | (f) |
| J13571919 | 28.03.06 | ST | R | 5.83 | 21 | 0.026 | 0.2 | 0.4 | 110.35 | 2.26P | V | (f) |
| J13571919 | 29.03.06 | ST | R | 6.26 | 23 | 0.030 | 0.2 | 0.3 | 110.04 | 1.66 | N | (f) |
| J13571919 | 06.04.06 | ST | R | 7.40 | 27 | 0.746 | 0.2 | 0.3 | 97.85 | 1.28 | N | (f) |
| J13571919 | 22.04.06 | ST | R | 4.88 | 17 | 0.037 | 0.2 | 0.4 | 44.72 | 1.04 | N | (f) |
| J13571919 | 23.04.06 | ST | R | 6.04 | 19 | 0.060 | 0.3 | 0.6 | 95.00 | 1.88 | N | (f) |
| J22033145 | 08.11.05 | HCT | R | 5.62 | 18 | 0.478 | 0.2 | 0.3 | 92.02 | 1.38 | N | (f) |
| J22033145 | 14.09.06 | ST | R | 5.87 | 26 | 0.158 | 0.2 | 0.3 | 78.55 | 1.27 | N | (f) |
| J22033145 | 15.09.07 | ST | R | 7.74 | 33 | 0.511 | 0.2 | 0.2 | 38.25 | 0.75 | N | (f) |
| J23460930 | 20.09.03 | HCT | R | 5.82 | 39 | 0.772 | 0.1 | 0.3 | 137.92 | 1.65 | N | (f) |
| J23460930 | 20.10.04 | ST | R | 5.73 | 11 | 0.128 | 0.1 | 0.3 | 52.59 | 2.21 | N | (f) |
| J23460930 | 16.11.06 | ST | R | 5.24 | 12 | 0.732 | 0.2 | 0.2 | 18.58 | 0.68 | N | (f) |
| High optical polarization core dominated quasars (HPCDQs)[11 sources; 31 DLCs] | ||||||||||||
| J02381637 | 12.11.99 | ST | R | 6.57 | 40 | 1.016 | 0.4 | 0.7 | 95.28 | 1.08 | N | (e) |
| J02381637 | 14.11.99 | ST | R | 6.16 | 34 | 1.020 | 0.2 | 0.4 | 88.31 | 1.13 | N | (e) |
| J02381637 | 18.11.03 | HCT | R | 7.80 | 41 | 0.251 | 0.3 | 0.5 | 129.42 | 1.34 | N | (f) |
| J04230120 | 19.11.03 | HCT | R | 6.69 | 38 | 0.402 | 0.2 | 0.3 | 153.68 | 1.41 | N | (f) |
| J04230120 | 08.12.04 | ST | R | 7.00 | 13 | 0.412 | 0.1 | 0.3 | 38.52 | 1.21 | N | (f) |
| J04230120 | 25.10.09 | ST | R | 4.46 | 21 | 0.128 | 0.3 | 0.6 | 76.55 | 1.48 | N | (f) |
| J07390137 | 05.12.05 | HCT | R | 5.31 | 10 | 0.461 | 0.1 | 0.2 | 20.17 | 0.94 | N | (f) |
| J07390137 | 06.12.05 | HCT | R | 6.06 | 9 | 0.647 | 0.1 | 0.4 | 80.48 | 4.24 | PV | (f) |
| J07390137 | 09.12.05 | HCT | R | 5.46 | 14 | 0.186 | 0.1 | 0.3 | 57.77 | 1.87 | N | (f) |
| J08495108 | 30.12.98 | ST | R | 7.08 | 39 | 0.603 | 0.8 | 1.3 | 116.19 | 1.18 | N | (a) |
| J10580133 | 25.03.07 | ST | R | 6.87 | 13 | 0.177 | 0.1 | 0.2 | 21.51 | 0.81 | N | (f) |
| J10580133 | 16.04.07 | ST | R | 4.23 | 17 | 0.501 | 0.1 | 0.2 | 52.55 | 1.38 | N | (f) |
| J10580133 | 23.04.07 | ST | R | 5.36 | 12 | 0.158 | 0.2 | 0.3 | 25.12 | 0.81 | N | (f) |
| J11592914 | 31.03.12 | IGO | R | 5.93 | 18 | 0.134 | 0.6 | 0.7 | 34.89 | 0.53 | N | (f) |
| J11592914 | 01.04.12 | IGO | R | 8.40 | 26 | 0.133 | 0.8 | 0.9 | 39.13 | 0.61 | N | (f) |
| J11592914 | 02.04.12 | IGO | R | 7.22 | 20 | 0.144 | 1.5 | 2.9 | 69.58 | 1.59 | N | (f) |
| J12180119 | 11.03.02 | ST | R | 6.16 | 34 | 0.049 | 1.3 | 3.0 | 225.39 | 2.39 | PV | (e) |
| J12180119 | 13.03.02 | ST | R | 8.48 | 24 | 0.074 | 0.2 | 0.5 | 158.12 | 1.62 | N | (e) |
| J12180119 | 15.03.02 | ST | R | 3.91 | 11 | 0.077 | 0.2 | 0.3 | 29.68 | 0.59 | N | (e) |
| J12180119 | 16.03.02 | ST | R | 8.20 | 22 | 0.072 | 0.2 | 0.3 | 121.40 | 1.52 | N | (e) |
| J12560547 | 26.01.06 | ST | R | 4.75 | 21 | 0.596 | 0.1 | 0.2 | 65.87 | 1.38 | N | (f) |
| J12560547 | 28.02.06 | ST | R | 6.51 | 42 | 0.601 | 0.1 | 0.2 | 91.54 | 0.81 | N | (f) |
| J12560547 | 20.04.09 | ST | R | 5.46 | 22 | 0.601 | 0.2 | 0.3 | 43.51 | 0.75 | N | (f) |
| J13103220 | 26.04.00 | ST | R | 5.99 | 18 | 0.971 | 1.0 | 1.8 | 48.79 | 1.34 | N | (e) |
| J13103220 | 17.03.02 | ST | R | 8.37 | 21 | 1.050 | 0.8 | 0.6 | 17.49 | 0.27 | N | (e) |
| J13103220 | 24.04.02 | ST | R | 5.81 | 14 | 1.045 | 0.5 | 0.3 | 7.70 | 0.17 | N | (e) |
| J13103220 | 02.05.02 | ST | R | 5.08 | 15 | 0.031 | 0.5 | 0.4 | 8.61 | 0.21 | N | (e) |
| J15120906 | 14.06.05 | ST | R | 4.93 | 11 | 0.347 | 0.1 | 0.1 | 9.33 | 0.39 | N | (f) |
| J15120906 | 01.05.09 | ST | R | 6.02 | 25 | 0.557 | 0.3 | 0.5 | 58.70 | 1.02 | N | (f) |
| J15120906 | 20.05.09 | ST | R | 5.16 | 25 | 0.580 | 0.5 | 0.7 | 55.86 | 0.67 | N | (f) |
| J22220457 | 08.10.10 | ST | R | 5.72 | 18 | 0.044 | 0.4 | 0.9 | 69.00 | 1.59 | N | (g) |
| TeV detected BL Lac objects (TeV-BLs)[13 sources; 54 DLCs] | ||||||||||||
| J01122244 | 29.10.05 | ST | R | 7.14 | 36 | 0.250 | 0.1 | 0.2 | 71.03 | 0.85 | N | (h) |
| J02224302 | 13.11.99 | ST | R | 5.92 | 123 | 0.051 | 0.1 | 0.2 | 416.3 | 1.43 | PV | (i) |
| J02224302 | 24.10.00 | ST | R | 9.15 | 73 | 0.050 | 0.1 | 0.3 | 310.17 | 1.95 | V | (i) |
| J02224302 | 01.11.00 | ST | R | 9.02 | 103 | 0.363 | 0.2 | 0.3 | 218.47 | 0.86 | N | (i) |
| J07217120 | 01.02.05 | ST | R | 1.68 | 26 | 0.159 | 0.2 | 0.3 | 62.62 | 0.86 | N | (g) |
| J07381742 | 26.12.98 | ST | R | 7.79 | 49 | 0.122 | 0.4 | 0.6 | 89.48 | 0.75 | N | (j) |
| J07381742 | 30.12.99 | ST | R | 7.44 | 64 | 0.066 | 0.4 | 0.5 | 96.90 | 0.64 | N | (j) |
| J07381742 | 25.12.00 | ST | R | 6.01 | 42 | 0.061 | 0.4 | 0.5 | 69.02 | 0.69 | N | (j) |
| J07381742 | 24.12.01 | ST | R | 7.30 | 38 | 0.190 | 0.3 | 0.4 | 47.70 | 0.52 | N | (j) |
| J07381742 | 20.12.03 | HCT | R | 6.00 | 38 | 0.818 | 0.2 | 0.3 | 71.02 | 0.80 | N | (j) |
| J07381742 | 10.12.04 | ST | R | 6.23 | 30 | 0.512 | 0.2 | 0.3 | 98.67 | 1.17 | N | (j) |
| J07381742 | 23.12.04 | ST | R | 5.88 | 13 | 0.505 | 0.1 | 0.2 | 36.57 | 1.15 | N | (j) |
| J07381742 | 02.01.05 | ST | R | 4.87 | 22 | 0.522 | 0.2 | 0.2 | 29.93 | 0.81 | N | (j) |
| J07381742 | 05.01.05 | ST | R | 5.23 | 26 | 0.158 | 0.1 | 0.2 | 64.56 | 1.08 | N | (j) |
| J07381742 | 09.01.05 | ST | R | 7.13 | 30 | 0.152 | 0.1 | 0.2 | 64.47 | 0.90 | N | (j) |
| J07381742 | 09.11.05 | ST | R | 4.27 | 19 | 0.624 | 0.1 | 0.2 | 48.34 | 1.13 | N | (j) |
| J07381742 | 16.11.06 | ST | R | 4.97 | 21 | 0.033 | 0.2 | 0.3 | 64.94 | 1.10 | N | (j) |
| J07381742 | 29.11.06 | ST | R | 6.49 | 28 | 0.516 | 0.2 | 0.3 | 66.83 | 1.00 | N | (j) |
| J07381742 | 17.12.06 | ST | R | 6.54 | 28 | 0.507 | 0.1 | 0.3 | 118.30 | 1.45 | N | (j) |
| J07381742 | 15.12.07 | ST | R | 7.05 | 29 | 0.162 | 0.1 | 0.2 | 89.88 | 1.35 | N | (j) |
| J07381742 | 16.12.07 | ST | R | 7.29 | 30 | 0.508 | 0.2 | 0.2 | 30.66 | 0.42 | N | (j) |
| J07381742 | 22.11.08 | ST | R | 5.98 | 29 | 0.128 | 0.2 | 0.2 | 48.35 | 0.53 | N | (j) |
| J07381742 | 08.12.09 | ST | R | 6.94 | 31 | 0.128 | 0.3 | 0.5 | 80.87 | 0.91 | N | (h) |
| J07381742 | 05.01.11 | ST | R | 6.80 | 32 | 0.330 | 0.3 | 0.4 | 43.17 | 0.51 | N | (h) |
| J07381742 | 29.11.11 | ST | R | 6.11 | 29 | 0.499 | 0.2 | 0.3 | 34.25 | 0.51 | N | (h) |
| J08093122 | 28.12.98 | ST | R | 7.29 | 36 | 0.844 | 0.3 | 0.6 | 153.04 | 1.69 | N | (a) |
| J08095218 | 04.02.05 | HCT | R | 7.24 | 29 | 0.885 | 0.1 | 0.3 | 97.92 | 1.43 | N | (g) |
| J08095218 | 05.12.05 | HCT | R | 5.85 | 10 | 0.892 | 0.1 | 0.3 | 31.21 | 1.26 | N | (g) |
| J08095218 | 08.12.05 | HCT | R | 5.77 | 16 | 0.894 | 0.2 | 0.2 | 18.25 | 0.40 | N | (g) |
| J08095218 | 09.12.05 | HCT | R | 5.46 | 14 | 0.892 | 0.2 | 0.2 | 17.38 | 0.56 | N | (g) |
| J08542006 | 29.12.98 | ST | R | 6.77 | 19 | 0.014 | 1.0 | 0.5 | 4.27 | 0.10 | N | (i) |
| J08542006 | 31.12.99 | ST | R | 5.61 | 29 | 0.471 | 0.2 | 0.4 | 98.30 | 1.48 | N | (i) |
| J08542006 | 28.03.00 | ST | R | 4.24 | 22 | 0.462 | 0.4 | 0.5 | 29.78 | 0.64 | N | (i) |
| J08542006 | 17.02.01 | ST | R | 6.92 | 47 | 0.467 | 0.4 | 0.4 | 46.55 | 0.42 | N | (i) |
| J08542006 | 05.02.05 | HCT | R | 7.82 | 42 | 1.739 | 0.1 | 0.2 | 127.8 | 1.05 | N | (g) |
| J08542006 | 12.04.05 | ST | R | 4.77 | 56 | 0.907 | 0.3 | 0.4 | 65.20 | 0.45 | N | (g) |
| J10154926 | 06.02.10 | ST | R | 5.93 | 26 | 0.248 | 0.1 | 0.2 | 84.52 | 1.42 | N | (g) |
| J10154926 | 19.02.10 | ST | R | 6.05 | 43 | 0.252 | 0.2 | 0.3 | 171.66 | 1.26 | N | (g) |
| J10154926 | 07.03.10 | ST | R | 5.50 | 36 | 0.180 | 0.2 | 0.4 | 132.23 | 1.14 | N | (g) |
| J12212813 | 19.03.04 | ST | R | 6.20 | 60 | 2.324 | 0.3 | 0.5 | 159.14 | 1.14 | N | (g) |
| J12212813 | 20.03.04 | ST | R | 6.29 | 67 | 2.322 | 0.4 | 0.7 | 196.68 | 1.08 | N | (g) |
| J12212813 | 18.03.05 | ST | R | 4.18 | 28 | 1.301 | 0.2 | 0.5 | 116.81 | 2.22 | PV | (g) |
| J12212813 | 05.04.05 | ST | R | 7.28 | 41 | 1.280 | 0.2 | 0.4 | 170.26 | 1.75 | PV | (g) |
| J12213010 | 08.03.10 | IGO | R | 6.54 | 17 | 0.004 | 0.1 | 0.4 | 123.33 | 2.84 | PV | (g) |
| J12213010 | 18.03.10 | ST | R | 5.87 | 27 | 1.016 | 0.3 | 0.4 | 41.95 | 0.70 | N | (g) |
| J12213010 | 22.05.10 | ST | R | 4.21 | 21 | 0.009 | 1.3 | 1.4 | 25.99 | 0.50 | N | (g) |
| J14195423 | 28.03.99 | ST | R | 5.65 | 33 | 0.142 | 0.3 | 0.5 | 68.98 | 0.82 | N | (a) |
| J14284240 | 21.04.04 | HCT | R | 6.12 | 35 | 0.865 | 0.4 | 0.8 | 165.94 | 1.54 | N | (g) |
| J14284240 | 22.04.09 | ST | R | 4.48 | 19 | 0.306 | 0.6 | 0.8 | 28.34 | 0.72 | N | (g) |
| J14284240 | 29.04.09 | ST | R | 6.81 | 29 | 0.856 | 0.6 | 0.9 | 78.27 | 0.86 | N | (g) |
| J15551111 | 05.05.99 | ST | R | 4.15 | 23 | 1.170 | 0.3 | 0.5 | 65.67 | 1.26 | N | (a) |
| J15551111 | 24.06.09 | ST | R | 4.22 | 26 | 0.137 | 0.1 | 0.3 | 108.25 | 1.77 | N | (g) |
| J15551111 | 15.05.10 | ST | R | 6.50 | 22 | 0.041 | 0.1 | 0.3 | 112.32 | 1.98 | N | (g) |
| J15551111 | 16.05.10 | ST | R | 6.27 | 33 | 0.101 | 0.2 | 0.3 | 164.16 | 1.53 | N | (g) |
Columns :- (1) source name; (2) date of observation; (3) telescope used; (4) filter used; (5) duration of
monitoring; (6) number of data points in the DLC; (7) mean apparent magnitude difference of the steady star-star pair;
(8) quadratic mean of the errors for the steady star-star DLC;
(9) standard deviation of the steady star-star DLC;
(10) -value for the star-star DLC; (10) -value for the star-star DLC;
(12) variability status for the star-star DLC;
(13) reference for the INOV data.
¶ ST - Sampurnanand Telescope (ARIES); HCT - Himalayan Chandra Telescope (IIA);
IGO - IUCAA Girawali Observatory; VBT - Vainu Bappu Telescope (IIA); GSO - Gurushikhar telecsope (PRL).
† V = Variable; N = Non-variable; PV = Probable Variable;
£References for the INOV data:
(a) Stalin et al. (2005); (b) Goyal et al. (2007);
(c) Stalin et al. (2004a); (d) Goyal et al. (2010);
(e) Sagar et al. (2004); (f) Goyal et al. (2012);
(g) Gopal-Krishna et al. (2011); (h) AGs unpublished data;
(i) Stalin et al. (2004b); (j) Goyal et al. (2009).
Acknowledgements
AG would like to thank Dr. Santosh Joshi (ARIES) for carrring out
optical observations on a few occasions. The authors are thankful
to the anonymous referee for the critical and constructive
suggestions.
References
- Bachev et al. (2005) Bachev R., Strigachev A., Semkov E., 2005, MNRAS, 358, 774
- Bevington & Robinson (2003) Bevington P. R., Robinson D. K., 2003, Data reduction and error analysis for the physical sciences
- Box & Cox (1964) Box G. E. P., Cox D. R., 1964, Journal of the Royal Statistical Society, 26, 211
- Box et al. (2005) Box G. E. P., Hunter J. S., Hunter W. K., 2005, Statistics for experimenters : an introduction to design, data analysis, and model building
- Carini & Miller (1992) Carini M. T., Miller H. R., 1992, ApJ, 385, 146
- Carini et al. (1990) Carini M. T., Miller H. R., Goodrich B. D., 1990, AJ, 100, 347
- Carini et al. (1992) Carini M. T., Miller H. R., Noble J. C., Goodrich B. D., 1992, AJ, 104, 15
- Carini et al. (1991) Carini M. T., Miller H. R., Noble J. C., Sadun A. C., 1991, AJ, 101, 1196
- Carini et al. (1998) Carini M. T., Noble J. C., Miller H. R., 1998, AJ, 116, 2667
- Carini et al. (2003) Carini M. T., Noble J. C., Miller H. R., 2003, AJ, 125, 1811
- Carini et al. (2007) Carini M. T., Noble J. C., Taylor R., Culler R., 2007, AJ, 133, 303
- Cellone et al. (2007) Cellone S. A., Romero G. E., Araudo A. T., 2007, MNRAS, 374, 357
- de Diego (2010) de Diego J. A., 2010, AJ, 139, 1269
- de Diego et al. (1998) de Diego J. A., Dultzin-Hacyan D., Ramirez A., Benitez E., 1998, ApJ, 501, 69
- Garcia et al. (1999) Garcia A., Sodré L., Jablonski F. J., Terlevich R. J., 1999, MNRAS, 309, 803
- Gaur et al. (2010) Gaur H., Gupta A. C., Lachowicz P., Wiita P. J., 2010, ApJ, 718, 279
- Gaur et al. (2012) Gaur H. et al., 2012, MNRAS, 425, 3002
- Gilliland et al. (1993) Gilliland R. L. et al., 1993, AJ, 106, 2441
- Gopal-Krishna et al. (2011) Gopal-Krishna, Goyal A., Joshi S., Karthick C., Sagar R., Wiita P. J., Anupama G. C., Sahu D. K., 2011, MNRAS, 416, 101
- Gopal-Krishna et al. (2000) Gopal-Krishna, Gupta A. C., Sagar R., Wiita P. J., Chaubey U. S., Stalin C. S., 2000, MNRAS, 314, 815
- Gopal-Krishna et al. (1993a) Gopal-Krishna, Sagar R., Wiita P. J., 1993a, MNRAS, 262, 963
- Gopal-Krishna et al. (1995) Gopal-Krishna, Sagar R., Wiita P. J., 1995, MNRAS, 274, 701
- Gopal-Krishna et al. (2003) Gopal-Krishna, Stalin C. S., Sagar R., Wiita P. J., 2003, ApJ, 586, L25
- Gopal-Krishna et al. (1993b) Gopal-Krishna, Wiita P. J., Altieri B., 1993b, A&A, 271, 89
- Goyal (2010) Goyal A., 2010, PhD thesis, Kumaun University, Uttarakhand, India
- Goyal et al. (2009) Goyal A. et al., 2009, MNRAS, 399, 1622
- Goyal et al. (2010) Goyal A., Gopal-Krishna, Joshi S., Sagar R., Wiita P. J., Anupama G. C., Sahu D. K., 2010, MNRAS, 401, 2622
- Goyal et al. (2007) Goyal A., Gopal-Krishna, Sagar R., Anupama G. C., Sahu D. K., 2007, Bulletin of the Astronomical Society of India, 35, 141
- Goyal et al. (2012) Goyal A., Gopal-Krishna, Wiita P. J., Anupama G. C., Sahu D. K., Sagar R., Joshi S., 2012, A&A, 544, A37
- Gupta et al. (2008a) Gupta A. C. et al., 2008a, AJ, 136, 2359
- Gupta et al. (2008b) Gupta A. C., Fan J. H., Bai J. M., Wagner S. J., 2008b, AJ, 135, 1384
- Gupta & Joshi (2005) Gupta A. C., Joshi U. C., 2005, A&A, 440, 855
- Gupta et al. (2012) Gupta A. C. et al., 2012, MNRAS, 425, 1357
- Gupta & Yuan (2009) Gupta A. C., Yuan W., 2009, New Astronomy, 14, 88
- Howell (1989) Howell S. B., 1989, PASP, 101, 616
- Howell & Jacoby (1986) Howell S. B., Jacoby G. H., 1986, PASP, 98, 802
- Howell et al. (2005) Howell S. B., VanOutryve C., Tonry J. L., Everett M. E., Schneider R., 2005, PASP, 117, 1187
- Jang & Miller (1995) Jang M., Miller H. R., 1995, ApJ, 452, 582
- Jang & Miller (1997) Jang M., Miller H. R., 1997, AJ, 114, 565
- Joshi et al. (2011) Joshi R., Chand H., Gupta A. C., Wiita P. J., 2011, MNRAS, 412, 2717
- Miller et al. (1989) Miller H. R., Carini M. T., Goodrich B. D., 1989, Nature, 337, 627
- Miller & Wiita (1991) Miller H. R., Wiita P. J., 1991, Science, 254, 1238
- Noble et al. (1997) Noble J. C., Carini M. T., Miller H. R., Goodrich B., 1997, AJ, 113, 1995
- Ramírez et al. (2009) Ramírez A., de Diego J. A., Dultzin D., González-Pérez J.-N., 2009, AJ, 138, 991
- Rani et al. (2010a) Rani B., Gupta A. C., Joshi U. C., Ganesh S., Wiita P. J., 2010a, ApJ, 719, L153
- Rani et al. (2011) Rani B., Gupta A. C., Joshi U. C., Ganesh S., Wiita P. J., 2011, MNRAS, 413, 2157
- Rani et al. (2010b) Rani B. et al., 2010b, MNRAS, 404, 1992
- Romero et al. (1999) Romero G. E., Cellone S. A., Combi J. A., 1999, A&AS, 135, 477
- Romero et al. (2002) Romero G. E., Cellone S. A., Combi J. A., Andruchow I., 2002, A&A, 390, 431
- Sagar et al. (1996) Sagar R., Gopal-Krishna, Wiita P. J., 1996, MNRAS, 281, 1267
- Sagar et al. (2004) Sagar R., Stalin C. S., Gopal-Krishna, Wiita P. J., 2004, MNRAS, 348, 176
- Stalin (2003) Stalin C. S., 2003, PhD thesis, Kumaun University, Uttaranchal, India
- Stalin et al. (2004a) Stalin C. S., Gopal-Krishna, Sagar R., Wiita P. J., 2004a, MNRAS, 350, 175
- Stalin et al. (2004b) Stalin C. S., Gopal Krishna, Sagar R., Wiita P. J., 2004b, Journal of Astrophysics and Astronomy, 25, 1
- Stalin et al. (2005) Stalin C. S., Gupta A. C., Gopal-Krishna, Wiita P. J., Sagar R., 2005, MNRAS, 356, 607
- Véron-Cetty & Véron (2001) Véron-Cetty M. P., Véron P., 2001, VizieR Online Data Catalog, 7224, 0
- Villforth et al. (2010) Villforth C., Koekemoer A. M., Grogin N. A., 2010, ApJ, 723, 737
- Wagner & Witzel (1995) Wagner S. J., Witzel A., 1995, ARA&A, 33, 163
- Wiita (2006) Wiita P. J., 2006, in Astronomical Society of the Pacific Conference Series, Vol. 350, Blazar Variability Workshop II: Entering the GLAST Era, Miller H. R., Marshall K., Webb J. R., Aller M. F., eds., p. 183