Polycyclic Aromatic Hydrocarbon and Mid-Infrared Continuum Emission
in a 4 Submillimeter Galaxy
Abstract
We report the detection of 6.2 m polycyclic aromatic hydrocarbon (PAH) and rest-frame 4–7 m continuum emission in the =4.055 submillimeter galaxy GN20, using the Infrared Spectrograph (IRS) on board the Spitzer Space Telescope. This represents the first detection of PAH emission at 4. The strength of the PAH emission feature is consistent with a very high star formation rate of 1600 yr-1. We find that this intense starburst powers at least 1/3 of the faint underlying 6 m continuum emission, with an additional, significant (and perhaps dominant) contribution due to a power-law-like hot dust source, which we interpret to likely be a faint, dust-obscured active galactic nucleus (AGN). The inferred 6 m AGN continuum luminosity is consistent with a sensitive upper limit on the hard X-ray emission as measured by the Chandra X-Ray Observatory if the previously undetected AGN is Compton-thick. This is in agreement with the finding at optical/infrared wavelengths that the galaxy and its nucleus are heavily dust-obscured. Despite the strong power-law component enhancing the mid-infrared continuum emission, the intense starburst associated with the photon-dominated regions that give rise to the PAH emission appears to dominate the total energy output in the infrared. GN20 is one of the most luminous starburst galaxies known at any redshift, embedded in a rich protocluster of star-forming galaxies. This investigation provides an improved understanding of the energy sources that power such exceptional systems, which represent the extreme end of massive galaxy formation at early cosmic times.
Subject headings:
galaxies: active — galaxies: starburst — galaxies: formation — galaxies: high-redshift — cosmology: observations — infrared: galaxies1. Introduction
Submillimeter galaxies (SMGs; see review by Blain et al. 2002) are thought to be the progenitors of the most massive present-day galaxies, making them a key ingredient to studies of massive galaxy formation and evolution through cosmic time. Many SMGs are outliers on the stellar mass-star formation rate relation at 2 (e.g., Daddi et al. 2007), and they typically are few kpc diameter, intense (500–1000 yr-1) starbursts embedded in 10 kpc gas reservoirs (e.g., Riechers et al. 2011a, 2011b; Ivison et al. 2011). They frequently feature rapid gas consumption through high star formation efficiencies that are associated with ongoing major mergers (e.g., Tacconi et al. 2008). The high abundance of passive, massive galaxies already by 2 (e.g., Renzini 2006) requires a substantial population of 3–4 galaxies with vigorous starbursts. Studies of the so-called high redshift tail of SMGs at 4 thus promise to provide valuable insights toward understanding the distribution of formation redshifts of massive early-type galaxies. The few 4 SMGs securely identified to date (e.g., Daddi et al. 2009a [hereafter: D09], 2009b; Capak et al. 2008, 2011; Riechers et al. 2010, 2013) may already be sufficient to account for known populations of old massive galaxies at =2–3 (e.g., Coppin et al. 2009). Also, 4 SMGs may have a significant contribution to the contemporaneous comoving star formation rate density (e.g., D09).
GN20 (=4.055) is one of the intrinsically brightest SMGs known (=20.3 mJy; Pope et al. 2005, 2006), and one of only a few spectroscopically confirmed unlensed SMGs at 4. Located in a massive galaxy protocluster structure (1014 ; D09; Hodge et al. 2013), this remarkable galaxy hosts a massive =1.81011 (/1.1) ,111 is the conversion factor from CO luminosity to molecular gas mass (H12). 144 kpc diameter molecular gas disk, which accounts for 1/3 of the total (dynamical) mass of the galaxy (Hodge et al. 2012 [H12]). This gas reservoir feeds an intense starburst that is almost entirely obscured by dust at optical wavelengths within the central 10 kpc (e.g., Iono et al. 2006; Carilli et al. 2010 [C10]). This intense, 1000 yr-1 starburst will be sufficient to turn GN20 into one of the most massive galaxies known within 1 Gyr. Due to the high level of obscuration, it is currently not known if GN20 hosts an AGN, and thus, if the infrared luminosity () used to estimate the star formation rate is entirely powered by dust-reprocessed light from young stars.
At low and intermediate redshifts (2), spectral decomposition of mid-infrared spectra has proven to be a powerful tool to investigate the relative contributions of AGN and star formation to the infrared light in star-forming galaxies (e.g., Armus et al. 2007; Farrah et al. 2007; Pope et al. 2008 [P08]; Veilleux et al. 2009; Petric et al. 2011), but no constraints exist for galaxies at 4 so far.
We here report the detection of 6.2 m PAH emission and 4–7 m continuum emission toward the =4.055 SMG GN20. This is the highest detection of PAH emission reported to date, reaching back to only 1.5 Gyr after the Big Bang. This enables us to better constrain the intensity of the starburst in this galaxy, and to determine the presence and energy contribution of an AGN in this intriguing system. We use a concordance, flat CDM cosmology throughout, with =71 km s-1 Mpc-1, =0.27, and =0.73 (Spergel et al. 2003, 2007).
2. Observations
Observations toward GN20 (=4.055) were carried out with the Infrared Spectrograph (IRS; Houck et al. 2004) on board the Spitzer Space Telescope on 2009 May 2–4 with a total observing time of 24 hr, split up into 120 s integrations (DDT project 531; PI: Riechers). As the 6.22 m PAH feature in GN20 is redshifted to 31.44 m, we selected the first order of the Long-Low module (LL1; 19.5–38.0 m) for this study. To improve the calibrational accuracy, these ultra-deep observations were obtained in spectral mapping mode, placing the target at six different positions (separated by 20′′) along the slit. High accuracy peak-ups on isolated, bright Two Micron All Sky Survey (2MASS) stars were obtained in the blue filter to optimize the pointing of the telescope.
The Basic Calibrated Data (BCD) files produced by the Spitzer IRS S18.7.0 pipeline (including ramp fitting, dark sky subtraction, droop and linearity corrections, flat-fielding, and wavelength calibration) were used for further calibration and processing. The two-dimensional dispersed frames were corrected for rogue pixels (using IRSCLEAN), after which a small percentage of remaining bad pixels was rejected. Then, the data were corrected for latent charge buildup (dominantly from zodiacal background), which was fitted by a constant polynomial and a time-variable component as a function of wavelength and then subtracted. The sky background was removed by fitting and subtracting a normalized ‘supersky’ map (in which all sources on the slit are masked) created from the data at different slit positions within an astronomical observation request (AOR; see P08 for details), resulting in minimal residual sky noise. After sky removal, individual data frames were co-added using a clipped median, and cleaned once more for persisting hot pixels. The Spitzer IRS Custom Extraction (SPICE) program was then used to ‘blindly’ extract one-dimensional spectra from the two-dimensional coadds for each nod position at the known 24 m position of the (unresolved) source (which is too faint to be detected in individual two-dimensional coadds). The uncertainty in the one-dimensional spectra was estimated from extracting residual sky spectra in the off-source position of each two-dimensional coadd. The final spectrum was obtained by averaging over all nod positions. The flux scale was obtained in SPICE by extracting spectra of standard calibrator stars obtained during the same campaign as our science observations, and found to be in good agreement with existing 24 m photometry of the source. The final noise on the spectrum between 21 and 32.5 m is estimated to be 40–90 Jy per 0.169 m wavelength bin. The spectrum was trimmed above observed-frame wavelengths of 35 m due to high noise. The nearby SMG GN20.2 was not covered by these observations due to the IRS slit orientation at the time of observation.
3. Results
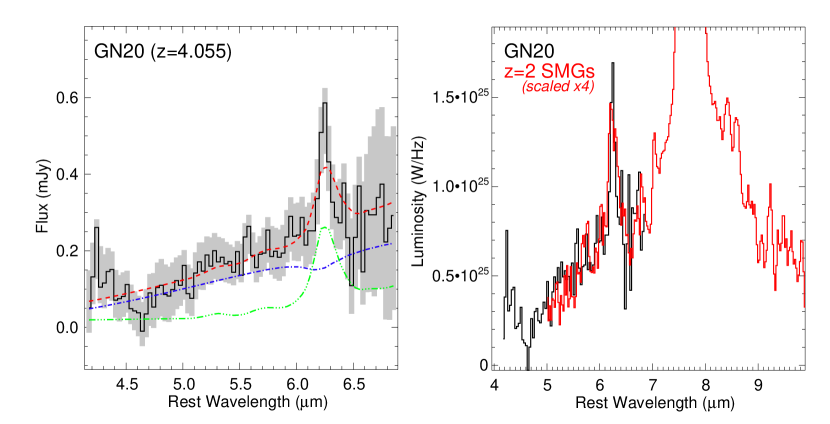
We have detected 6.2 m PAH emission and 4–7 m continuum emission toward the =4.055 SMG GN20 (Fig. 1 left). The PAH emission extends over at least 5 wavelength bins, and is detected at 6 significance (when simultaneously fitting the underlying continuum). The continuum is detected at typically 1.5–4 per wavelength bin over the full spectral range (80 bins), allowing us to constrain the continuum slope over this spectral range. The strength of the continuum emission is consistent with the 24 m flux of 65.53.5 Jy measured with the Multiband Imaging Photometer for Spitzer (MIPS; P08; D09) within the (considerable) relative uncertainties. When accounting for the steeply sloped continuum emission, the PAH line shape is symmetric and consistent with a Gaussian or Lorentzian profile, as expected. A Gaussian fit to the line profile and nearby continuum (i.e., the same method as used by P08) yields an integrated 6.2 m PAH luminosity of =(2.700.44)1010 , and a rest-frame line equivalent width of 0.170.08 m. A small positive excess is seen close to the expected peak of the 5.7 m PAH feature, but not enough to claim a detection. The spectrum also shows a tentative decrement consistent with the wavelength of the 4.67 m - and -branches of the fundamental vibrational mode of CO, which is observed in absorption toward some nearby ultra-luminous infrared galaxies with embedded nuclei (e.g., Spoon et al. 2004, 2005). Unfortunately, the sensitivity is not sufficient to claim a detection of this CO absorption feature.
We extract the remaining spectral properties of the source by fitting a two-component model to the data, consisting of an extincted power-law component (with a wavelength-dependent optical depth obtained from the Draine 2003 extinction curves) and a starburst component (see, e.g., Menéndez-Delmestre et al. 2007, 2009; P08). The starburst component is a M82 template (Förster Schreiber et al. 2003), but adopting the starburst composite template of Brandl et al. (2006) yields the same results within the uncertainties.222The 6.2 m PAH to 6 m continuum flux ratio among the starbursts that are part of this template vary by about 20%, which may be considered the minimum level of uncertainty in the decomposition. This is due to the fact that hot dust emission from a very compact, obscured starburst can also cause some level of excess in the mid-infrared continuum emission of a galaxy. In comparison to the starburst template, the PAH feature is both narrow and has a low equivalent width.333The 6.2 m PAH equivalent width for the starburst template reported by Brandl et al. (2006) is 0.53 m, with values in the range of 0.459 to 0.789 m for individual galaxies that are part of the template (measured using a method that gives similar results to our method, see discussion by P08). Based on the examination of subsets of the data, the narrow shape of the feature relative to templates is of limited significance. Low PAH equivalent widths, such as observed for GN20, are typically found in galaxies with significant AGN emission at mid-infrared wavelengths (e.g., Armus et al. 2007). Within the limited spectral range, the spectral decomposition suggests that 2/3 (fit value: 66%) of the continuum emission at 6 m is due to the power-law component, with only 1/3 (34%) contribution from the starburst template, with a level of uncertainty of at least 30% from the fitting alone. The power-law component alone, likely due to a hot dust source, corresponds to a rest-frame 6 m continuum luminosity of (6 m)=2.61045 erg s-1. As discussed below, we interpret this power-law component to be dominantly due to a heavily dust-enshrouded AGN in GN20, tracing the thermally re-radiated emission from the obscuring material.
In the right panel of Fig. 1, a comparison between the spectrum of GN20 and the 2 SMG composite spectrum of P08444The 6.2 m PAH equivalent widths for individual SMGs that are part of this template are 0.22–1.10 m, which includes two upper limits of 0.45 and 0.50 m (P08). (scaled up by a factor of 4 in luminosity) is shown. Except for a narrower PAH feature in GN20, both spectra look quite similar. The average AGN contribution for the 2 SMG composite sources is 30% (P08). This shows that the presence of an AGN in GN20 is likely, but that, due to the limited spectral range of our observations, the AGN contribution to the rest-frame 6 m continuum luminosity is probably uncertain by about a factor of 2.
For comparison, we have extracted the rest-frame X-ray 2–10 keV luminosity of GN20 from the deep 2 Ms exposure of the region obtained with the Chandra X-Ray Observatory (Alexander et al. 2003). The source is not detected down to a limiting luminosity of (2–10 keV)1.81042 erg s-1 (based on the observed-frame 0.5–2 keV flux limit, assuming a K-correction of 1.085 and a spectral slope of =1.4). Under the assumption that GN20 hosts a mid-infrared-luminous, obscured AGN, this X-ray limit provides interesting constraints on its AGN properties (as outlined below).
4. Analysis
4.1. Spectral Energy Distribution
Our spectral decomposition suggests that 34%–70% of the mid-infrared continuum flux in GN20 is due to star formation. This suggests that, in order to determine the fraction of that is due to star formation, the photometry at these wavelengths needs to be corrected down accordingly to fit only the starburst fraction of the spectral energy distribution (SED). We have applied this correction to the SED fit presented by Magdis et al. (2011; conservatively adopting the 34% value from the two-component fit). This yields a starburst infrared luminosity of =(1.90.4)1013 , which is essentially the same as the total infrared luminosity quoted by Magdis et al. (2011). Given the SED shape of the source, the impact of the correction (and its factor of 2 uncertainty) on the total is minor. The correction does not account for a potential cooler dust component that may be subject to AGN heating, but that cannot be described by the mid-infrared power-law component. At present, there is no evidence for the existence of such an additional component in GN20.
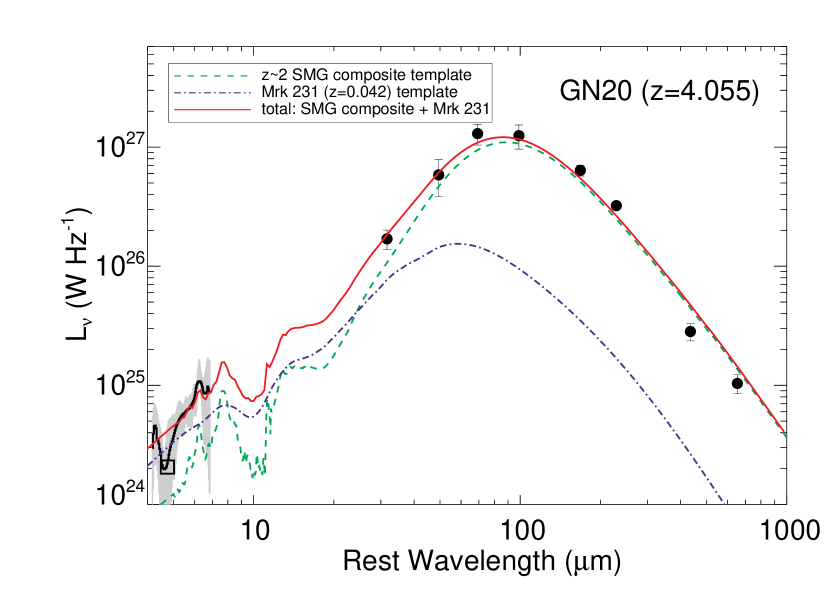
To better quantify the possible contribution of any additional, unconstrained component to if present, we simultaneously fit the mid-infrared spectrum and full infrared SED of GN20 with a composite full SED template of 2 SMGs (consisting of the same galaxies used in the mid-infrared composite in Fig. 1; P08) and an SED template of the =0.042 AGN-dominated infrared-luminous galaxy Mrk 231 (Fig. 2; Rigopoulou et al. 1999; P08). The estimated contribution of star formation to the far-infrared luminosity of Mrk 231 is 30%15% (Veilleux et al. 2009). This simultaneous composite fit reproduces the overall SED properties of GN20 fairly well, and it suggests a starburst contribution of 35% to the mid-infrared luminosity. This agrees well with the estimate based on the decomposition of the mid-infrared spectrum alone. The fit overestimates the luminosity at 4.4–5.0 m. This may be due to the possible presence of CO absorption in this spectral region, but it could also indicate a lower AGN contribution to the mid-infrared luminosity, consistent with the range allowed by the mid-infrared spectral decomposition alone. The fit also suggests that the AGN contribution to the total is 15%–20%. Given the underlying assumptions, we consider this an approximate upper limit for the AGN contribution to in the following.
We can compare our results to those for individual 2 SMGs. In the sample of P08, three 2 SMGs (classified as starbursts in the mid-infrared) have upper limits on the AGN continuum contribution to their mid-infrared spectra of 29% to 35%, and three other 2 SMGs (classified as AGN+starburst systems in the mid-infrared) have estimates in the range of 47%–61%. For these galaxies, which have mid-infrared AGN continuum fractions consistent with GN20, P08 find upper limits of 15% to 35% and estimates of 11%–32% for the AGN contribution to their total of 0.2–1.01013 . For five 2.5 SMGs selected to have a steeply rising continuum slope between 4.5 and 8 m (as expected for SMGs with a significant AGN contribution at those wavelengths), Coppin et al. (2010) find 26%–62% AGN contribution in the mid-infrared, and 23%–36% AGN contribution to their total of 0.5–1.51013 .555Systems in the samples of P08 and Coppin et al. (2010) with mid-infrared AGN continuum contributions that are not consistent with GN20 were excluded from this comparison. This suggests a conservative limit of 1/3 for a contribution of such an additional component to the in GN20, if present. This is consistent with the results from the composite SED fitting.
Based on the 1.4 GHz radio flux density of 7213 Jy (C10; Pope et al. 2006; Morrison et al. 2010), we find a parameter (i.e., ratio of to monochromatic 1.4 GHz radio luminosity; Helou et al. 1985) of =2.39 for GN20 (=2.32 if assuming an AGN contribution of 15% to ), consistent with galaxies that follow the radio-infrared correlation for nearby star-forming galaxies (=2.30.1; Yun et al. 2001) and SMGs with solid radio identifications (=2.40.1; Ivison et al. 2010). This is consistent with no significant AGN contribution to the in GN20 beyond the corrections employed above. There also is no evidence for an AGN contribution to the radio emission in GN20, in contrast to its nearby companion galaxy, GN20.2a, which hosts a radio-detected AGN (D09).
4.2. AGN and Star Formation Relations
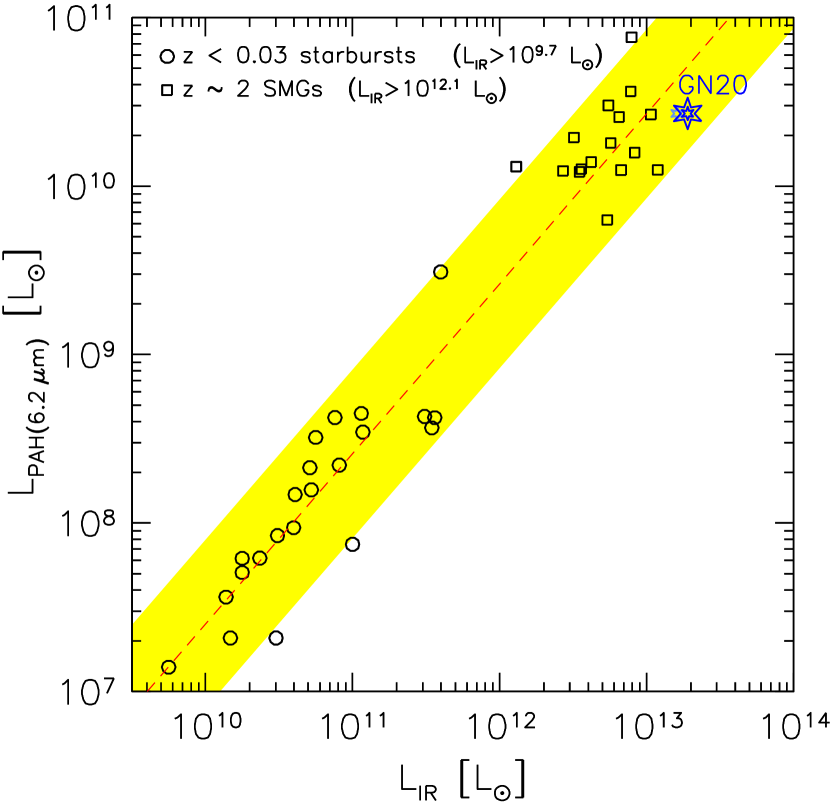
Interstellar PAH particles typically occur in photon-dominated regions (PDRs), which are associated with star-forming clouds. In these clouds, young stars heat large dust grains that emit re-processed stellar light in the infrared. Consequently, a relation between and was found over a range in luminosity from individual local star-forming regions up to starburst galaxies (e.g., Peeters et al. 2004) and even 2 SMGs (P08). In Fig. 3, we plot this relation for nearby starburst galaxies (Brandl et al. 2006), the 2 SMG sample from P08 and Coppin et al. (2010), and GN20. All infrared luminosities are corrected for their estimated AGN contribution. The (linear) relation shows a scatter by a factor of 3 (as indicated by the shaded region), likely due to differences in the physical properties of the individual star-forming environments in these galaxies (such as starburst geometry and clumpiness, dust distribution and temperature, or viewing angle toward a merger). The =4.055 SMG GN20 follows this relation within the scatter, providing further evidence that its huge bolometric energy output is dominantly due to an intense starburst. Given its high relative to nearby starbursts, the relative strength of the PAH feature in GN20 is consistent with a fairly large spatial extent of the starburst, but relatively moderate dust temperatures (rather than a compact, hot starburst region), such that typical PDRs giving rise to the PAH emission are largely intact. This is in agreement with the moderate molecular gas surface densities found for the bulk of the gas reservoir (H12), and with the moderate characteristic dust temperature found from SED fitting (33 K; Magdis et al. 2011). Younger et al. (2008) place a limit of 4–8 kpc (depending on the assumed source morphology) on the FWHM diameter of the starburst in GN20, which is consistent with a fairly large total extent as expected from the relative PAH strength.
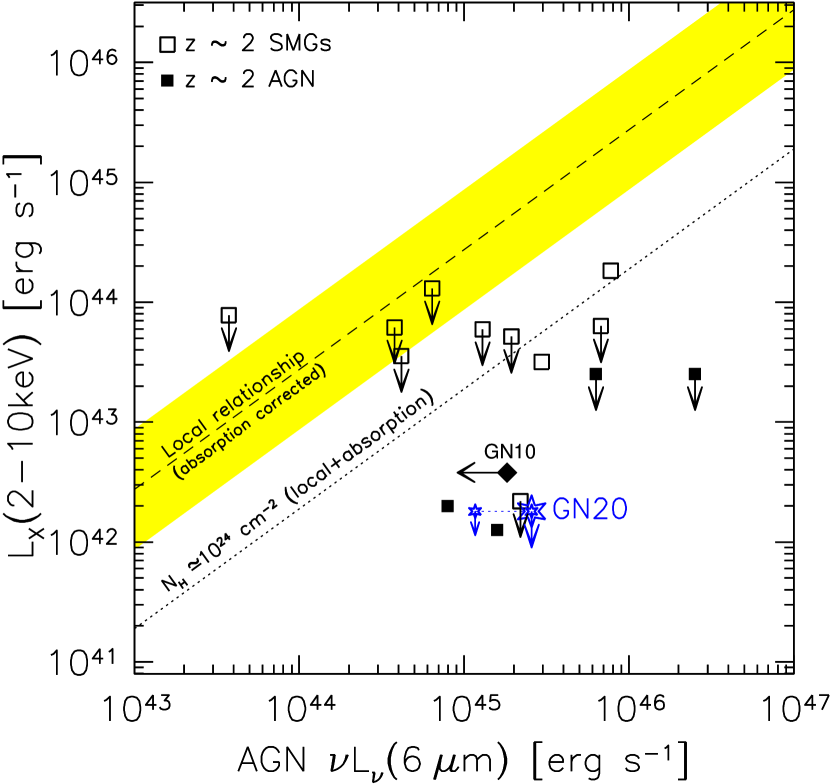
In nearby AGN, hard X-ray emission from the central engine is commonly considered to be a measure of the bolometric AGN luminosity, and thus, should be linked to the strength of the thermally re-radiated mid-infrared emission from hot dust close to the nucleus. This finding has led to the discovery of an empirical relation between (2–10 keV) and (6 m) (e.g., Lutz et al. 2004), which is linear over 3–5 orders of magnitude, and extends out to high redshift. Galaxies can significantly deviate from this relation due to intervening matter along the line of sight to the AGN, i.e., due to a significant absorbing column density of obscuring dust at X-ray wavelengths that lowers the observed X-ray fluxes. In Fig. 4, the (absorption-corrected) relation for nearby AGN is compared to a sample of 2 AGN and SMGs (Alexander et al. 2008; Coppin et al. 2010), the =4.042 SMG GN10 (Laird et al. 2010; Pope et al. 2006), and GN20. For all galaxies, only the estimated AGN power-law contribution to the mid-infrared emission from the spectral decomposition is shown (for GN10, only an upper limit exists due to the lack of mid-infrared spectroscopy). The deep X-ray limit indicates that GN20 would be obscured by a factor of 430 if the local relation were to hold (with a factor of at least 3 uncertainty due to the scatter in that relation, as indicated by the shaded region in Fig. 4, and some additional uncertainty in the K-correction and X-ray spectral slope assumed for GN20). This suggests that, if an AGN contributes at 30%–66% level to the mid-infrared continuum emission (as indicated by the spectral decomposition), it likely is a type-2 AGN obscured by Compton-thick material. This would be in agreement with its non-detection in the optical, and with the extreme obscuration of the massive, gas- and dust-rich host galaxy (e.g., D09; C10; H12). This AGN is unlikely to be very luminous: even when assuming a correction factor of 430, the limit on (2–10 keV) corresponds to only 1% of , which is far below the values typically found for luminous AGN (Alexander et al. 2005a).
4.3. Star Formation Rate
Based on the relation between and , P08 have determined a relation to convert into a star formation rate (SFR; their Eq. 7). For GN20, this relation suggests a SFR of 1600 yr-1 when assuming a Chabrier (2003) stellar initial mass function (IMF). With the same IMF, the of GN20 suggests a SFR of 1900 yr-1 (1600 yr-1 if assuming a 15% AGN contribution to ), comparable to that of the =5.3 SMG AzTEC-3 (which also resides in a protocluster environment; Capak et al. 2011; Riechers et al. 2010). These estimates thus consistently suggest a SFR of at least 1600 yr-1 within the relative uncertainties.
Given the large molecular gas mass of 1.81011 (/1.1) (H12), this corresponds to a gas consumption timescale of 108 yr. This is consistent with a short, intense burst of star formation, as seen in ‘typical’ 2 SMGs (e.g., Greve et al. 2005) and 4 quasar host galaxies (e.g., Riechers et al. 2008a, 2008b).
5. Discussion
We have detected 6.2 m PAH and rest-frame 4–7 m continuum emission toward the =4.055 SMG GN20, using the Spitzer IRS. GN20 is one of the most luminous dusty galaxies known at high redshift. The 6.2 m PAH equivalent width is a few times lower than in ‘typical’ 2 SMGs, due to a relatively high contribution (1/3–2/3) of a power-law component to the continuum emission. When fit in the same fashion, 2 SMGs typically show 30% contribution of power-law continuum emission in the mid-infrared (80% of the population; e.g., P08).
The simplest compelling interpretation is that the different characteristics of GN20 relative to nearby starbursts and the majority of ‘typical’ 2 SMGs are related to a luminous power source besides the starburst, with a possible contribution from other mechanisms and/or due to unusual properties of the dust. This additional, luminous power source is likely an obscured AGN. Given the lack of direct evidence for an AGN at other wavelengths, this interpretation warrants further exploration.
On the one hand, there is no known mechanism other than AGN activity that can produce the high excess in mid-infrared continuum luminosity observed in GN20 without making fairly extreme assumptions. The tentatively identified 4.67 m CO absorption feature, if confirmed, would be consistent with a very warm, embedded source contributing significantly to the 6 m continuum emission (against which the absorption is measured), such as an obscured AGN. In principle, a very compact, obscured starburst can cause some excess in the mid-infrared continuum emission of a galaxy, which in fact may be responsible for at least part of the variations seen among the mid-infrared spectra of nearby starbursts. However, GN20 is dominated by a moderately warm, spatially extended starburst, without evidence for a significant compact, hot subcomponent. It has been argued in the literature that small, hot dust grains in the most energetic HII regions can produce power-law-shaped radiation in the mid-infrared (e.g., Genzel et al. 1998; Tran et al. 2001). Due to the high redshift of GN20 and the likely presence of multiple emission components, the spectral coverage of the IRS spectrum is not sufficient to firmly distinguish between the flatter mid-infrared power-law slopes of emission associated with a dust torus surrounding an AGN, and the steeper slopes observed towards HII regions with highly concentrated star formation. Given the overall cool dust SED shape of GN20, it remains unclear if such HII regions are sufficiently common to produce a power-law-shaped excess component as strong as observed. In any case, given a possible contribution from HII regions, we consider our estimates for the power-law-shaped component to be an upper limit for the actual AGN contribution.
On the other hand, there are several potential reasons for the low observed equivalent width of the PAH feature. One possibility to interpret the low equivalent width of the PAH feature is that the adopted nearby starburst template (or even the 2 SMG template) may not be suitable to fit the spectrum of substantially more luminous and/or distant starburst galaxies at 4. Besides the relative strength of the hot dust continuum emission, the equivalent width of the 6.2 m PAH feature depends on the ionized vs. neutral PAH ratio, which in turn depends on metallicity and the hardness of the radiation field that the PAH particles are bathed in (e.g., Draine & Li 2007). The relative strength of the CO emission in GN20 compared to its far-infrared dust properties (D09; C10; H12), however, does not indicate substantial differences compared to 2 SMGs (e.g., Tacconi et al. 2008; Riechers et al. 2011a, 2011b) in terms of dust/gas-phase metallicity. Furthermore, the overall radiation field that penetrates the dust would be substantially harder if composed of both a starburst and an AGN component. This could be consistent with a non-standard ionized vs. neutral PAH ratio, which may result in a narrower feature, and a lower equivalent width, as seen in GN20 (it however may be difficult to reconcile a scenario where the AGN radiation penetrates the opaque, obscuring dust and gas throughout the large, 14 kpc diameter of the reservoir).
Interestingly, the 2 SMG with the lowest equivalent width 6.2 m PAH feature (C1, 0.050.01 m; i.e., 1/3 the equivalent width of GN20) found by P08, like GN20, is consistent with hosting a Compton-thick AGN. Studies of other types of galaxies find that systems with 6.2 m PAH equivalent widths of 0.2 m are typically AGN-dominated in the mid-infrared (e.g., Armus et al. 2007; Sajina et al. 2007). Also, Coppin et al. (2010) have studied a sample of 2 SMGs that were suspected to be dominated by AGN (representing 15% of the 2 SMG population),666With /=2.75, GN20 formally follows the color excess (caused by 500–1000 K hot dust) selection criterion for mid-infrared AGN-dominated SMGs as defined by Coppin et al., but only due to the shorter rest-frame wavelengths probed in these bands at 4 relative to their 2.5 sample. several of which are at least consistent with being Compton-thick AGN. These studies find that in a number of these systems (corresponding to 5% of the SMG population, not including the 4% of SMGs that are type-1 AGN/quasars), the AGN is bolometrically important, and sometimes even dominant, relative to their submillimeter-detected luminous starbursts of few hundreds to 1000 yr-1. Our findings show that an obscured, Compton-thick AGN may significantly contribute to, and perhaps dominate the energy output in the mid-infrared in GN20, but it appears to only yield a minor contribution to the bolometric energy output of the galaxy.
In conclusion, we have used the Spitzer IRS to constrain the AGN and star formation properties in a starburst galaxy at 4, employing the unique diagnostics observable only at mid-infrared wavelengths. Based on the detection of 6.2 m PAH and 4–7 m continuum emission in the exceptional =4.055 SMG GN20, we have found evidence for the likely presence of a heavily buried, Compton-thick, but bolometrically not dominant AGN hosted by a massive, dust-obscured 1600–1900 yr-1 starburst.
.1. Black Hole Mass and Accretion Rate
Assuming that GN20 hosts an obscured AGN, and that the local
(6 m)–(2–10 keV) relation holds,
i.e., that the large absorption corrections found in Sect. 4.2 are
valid, we can attempt to derive an Eddington limit for the black hole
mass of GN20 based on (6 m). Assuming
a bolometric correction of =/(2–10 keV)=55 (for high / galaxies; Vasudevan & Fabian 2007), we find
1.4–3.0108 for
30%–66% of (6 m), corresponding to
0.03%–0.06% of the total (dynamical) mass of the galaxy
(=5.42.41011 ; H12). This ratio
is comparable to what is found in 2 SMGs (0.05%;
Alexander et al. 2005b, 2008). This may imply
that the of GN20 falls short of the near-linear local
– relation (which corresponds to a mass
ratio of 0.19% at the of GN20; Magorrian
et al. 1998; Häring & Rix 2004) by a factor
of a few, but this offset is of the same order of magnitude as the
uncertainties. In any case, these considerations show that the
supermassive black hole properties implied by the above estimates
appear to be reasonable. Assuming a canonical mass accretion
efficiency of =0.1, this also corresponds to an accretion rate
of 4–7 yr-1, or 0.2%–0.4% of
the SFR. Given the underlying corrections and uncertainties, we
consider these (plausible) values to be reliable to within a factor of
3–5 at best.
References
- Alexander et al. (2003) Alexander, D. M., et al. 2003, AJ, 126, 539
- Alexander et al. (2005a) Alexander, D. M., et al. 2005a, ApJ, 632, 736
- Alexander et al. (2005b) Alexander, D. M., et al. 2005b, Nature, 434, 738
- Alexander et al. (2008) Alexander, D. M., et al. 2008, AJ, 135, 1968
- Armus et al. (2007) Armus, L., et al. 2007, ApJ, 656, 148
- Blain et al. (2002) Blain, A. W., et al. 2002, PhR, 369, 111
- Brandl et al. (2006) Brandl, B. R., et al. 2006, ApJ, 653, 1129
- Capak et al. (2008) Capak, P., et al. 2008, ApJ, 681, L53
- Capak et al. (2011) Capak, P., et al. 2011, Nature, 470, 233
- Carilli et al. (2010) Carilli, C. L., Daddi, E., Riechers, D., et al. 2010, ApJ, 714, 1407 [C10]
- Chabrier (2003) Chabrier, G. 2003, PASP, 115, 763
- Coppin et al. (2009) Coppin, K., et al. 2009, MNRAS, 395, 1905
- Coppin et al. (2010) Coppin, K., et al. 2010, ApJ, 713, 503
- Daddi et al. (2007) Daddi, E., et al. 2007, ApJ, 670, 156
- Daddi et al. (2009a) Daddi, E., et al. 2009a, ApJ, 694, 1517 [D09]
- Daddi et al. (2009b) Daddi, E., et al. 2009b, ApJ, 695, L176
- Draine (2003) Draine, B. T. 2003, ARA&A, 41, 241
- Draine&Li (2007) Draine, B. T., & Li, A. 2007, ApJ, 657, 810
- Farrah et al. (2007) Farrah, D., et al. 2007, ApJ, 667, 149
- Förster Schreiber et al. (2003) Förster Schreiber, N. M., et al. 2003, A&A, 399, 833
- Genzel et al. (1998) Genzel, R., et al. 1998, ApJ, 498, 579
- Greve et al. (2005) Greve, T. R., et al. 2005, MNRAS, 359, 1165
- Häring & Rix (2004) Häring, N., & Rix, H.-W. 2004, ApJ, 604, L89
- Helou et al. (1985) Helou, G., et al. 1985, ApJ, 298, L7
- Hodge et al. (2012) Hodge, J., et al. 2012, ApJ, 760, 11 [H12]
- Hodge et al. (2013) Hodge, J., Carilli, C. L., Walter, F., Daddi, E., & Riechers, D. 2013, ApJ, 776, 22
- Houck et al. (2004) Houck, J. R., et al. 2004, ApJS, 154, 18
- Ivison et al. (2010) Ivison, R. J., et al. 2010, A&A, 518, L31
- Ivison et al. (2011) Ivison, R. J., et al. 2011, MNRAS, 412, 1913
- Iono et al. (2006) Iono, D., et al. 2006, ApJ, 640, L1
- Laird et al. (2010) Laird, E. S., Nandra, K., Pope, A., & Scott, D. 2010, MNRAS, 401, 2763
- Lutz et al. (2004) Lutz, D., et al. 2004, A&A, 418, 465
- Magdis et al. (2011) Magdis, G. E., et al. 2011, ApJ, 740, L15
- Magorrian et al. (1998) Magorrian, J., et al. 1998, AJ, 115, 2285
- Menendez-Delmestre et al. (2007) Menéndez-Delmestre, K., et al. 2007, ApJ, 655, L65
- Menendez-Delmestre et al. (2009) Menéndez-Delmestre, K., et al. 2009, ApJ, 699, 667
- Morrison et al. (2010) Morrison, G. E., Owen, F. N., Dickinson, M., Ivison, R. J., & Ibar, E. 2010, ApJS, 188, 178
- Nguyen et al. (2010) Nguyen, H. T., et al. 2010, A&A, 518, L5
- Peeters et al. (2004) Peeters, E., et al. 2004, ApJ, 613, 986
- Petric et al. (2011) Petric, A., et al. 2011, ApJ, 730, 28
- Pope et al. (2005) Pope, A., et al. 2005, MNRAS, 358, 149
- Pope et al. (2006) Pope, A., et al. 2006, MNRAS, 370, 1185
- Pope et al. (2008) Pope, A., et al. 2008, ApJ, 675, 1171 [P08]
- Renzini (2006) Renzini, A. 2006, ARA&A, 44, 141
- Riechers et al. (2008a) Riechers, D. A., et al. 2008a, ApJ, 686, L9
- Riechers et al. (2008b) Riechers, D. A., et al. 2008b, ApJ, 686, 851
- Riechers et al. (2010) Riechers, D. A., et al. 2010, ApJ, 720, L131
- Riechers et al. (2011a) Riechers, D. A., et al. 2011a, ApJ, 733, L11
- Riechers et al. (2011b) Riechers, D. A., Hodge, J., Walter, F., Carilli, C. L., & Bertoldi, F. 2011b, ApJ, 739, L31
- Riechers et al. (2013) Riechers, D. A., et al. 2013, Nature, 496, 329
- Rigopoulou et al. (1999) Rigopoulou, D., Spoon, H. W. W., Genzel, R., Lutz, D., Moorwood, A. F. M., & Tran, Q. D. 1999, AJ, 118, 2625
- Sajina et al. (2007) Sajina, A., et al. 2007, ApJ, 664, 713
- Spergel et al. (2003) Spergel, D. N., Verde, L., Peiris, H. V., et al. 2003, ApJS, 148, 175
- Spergel et al. (2007) Spergel, D. N., Bean, R., Doré, O., et al. 2007, ApJS, 170, 377
- Spoon et al. (2004) Spoon, H. W. W., et al. 2004, ApJS, 154, 184
- Spoon et al. (2005) Spoon, H. W. W., et al. 2005, IAUS, 231, 281
- Taccconi et al. (2008) Tacconi, L. J., et al. 2008, ApJ, 680, 246
- Tran et al. (2001) Tran, Q. D., et al. 2001, ApJ, 552, 527
- Vasudevan & Fabian (2007) Vasudevan, R. V., & Fabian, A. C. 2007, MNRAS, 381, 1235
- Veilleux et al. (2009) Veilleux, S., et al. 2009, ApJS, 182, 628
- Younger et al. (2008) Younger, J. D., et al. 2008, ApJ, 688, 59
- Yun et al. (2001) Yun, M. S., Reddy, N. A., & Condon, J. J. 2001, ApJ, 554, 803