Anti-parallel EUV flows observed along active region
filament threads with Hi-C
Abstract
Plasma flows within prominences/filaments have been observed for many years and hold valuable clues concerning the mass and energy balance within these structures. Previous observations of these flows primarily come from H and cool EUV lines (e.g., 304 Å) where estimates of the size of the prominence threads has been limited by the resolution of the available instrumentation. Evidence of ‘counter-steaming’ flows has previously been inferred from these cool plasma observations but now, for the first time, these flows have been directly imaged along fundamental filament threads within the million degree corona (at 193 Å). In this work we present observations of an active region filament observed with Hi-C that exhibits anti-parallel flows along adjacent filament threads. Complementary data from SDO/AIA and HMI are presented. The ultra-high spatial and temporal resolution of Hi-C allow the anti-parallel flow velocities to be measured (70 - 80 km s-1) and gives an indication of the resolvable thickness of the individual strands (0.8” 0.1”). The temperature distribution of the plasma flows was estimated to be log T (K) = 5.45 0.10 using EM loci analysis. We find that SDO/AIA cannot clearly observe these anti-parallel flows nor measure their velocity or thread width due to its larger pixel size. We suggest that anti-parallel/counter-streaming flows are likely commonplace within all filaments and are currently not observed in EUV due to current instrument spatial resolution.
Subject headings:
Sun: corona - Sun: filaments, prominences1. Introduction
Research into the mechanisms that create and maintain solar prominences has benefited greatly in recent years from the increased resolution of instrumentation. High resolution observations of both filaments (on-disk) and prominences (off-limb) give a crucial insight into the mass maintenance and magnetic field structure that is needed to fully comprehend how these cool, dense structures form and survive within the corona.
Prominences are formed from individual threads and knots of mass (Engvold, 1976) that are suspended within the magnetic field of the corona. They are typically one hundred times cooler and denser than the coronal average (Labrosse et al., 2010) and are formed over polarity inversion lines (PIL) (Babcock & Babcock, 1955). The role of the magnetic field in structuring and maintaining prominence material can be examined by mapping the flow of plasma along field-aligned filament threads. These flows can highlight the anatomy of the magnetic field and could be used to test the veracity of many of the current models (see e.g., Mackay et al., 2010, for a comprehensive review).
The majority of observations that examine prominence threads are taken in H which typically yield spatial resolutions higher than have been achievable in the extreme ultra-violet (EUV) and X-ray. Lin et al. (2005) used data from the Swedish Solar Telescope and found that filament threads had an average width of 0.3” but postulated that since this was near the instrument’s resolution, that finer structures were likely to exist. EUV observations have shown that the higher temperature components of filaments are wider than their H counterparts due to absorption by the hydrogen Lyman continuum (Heinzel et al., 2001; Schmieder et al., 2004). This may have an impact on the fundamental scale that these threads can be measured to at EUV wavelengths.
Zirker et al. (1998) first coined the term ‘counter-streaming’ to describe the bi-directional pattern of flows observed within filaments. These motions (see also e.g., Engvold, 1976; Lin et al., 2003, 2005; Chae et al., 2007; Schmieder et al., 2008; Panasenco & Martin, 2008) highlight a more complex picture of prominence dynamics and can give clues to the physical scale of the fundamental prominence threads as well as the source of the mass flows.
The counter-streaming flows examined by Zirker et al. (1998) were observed in the wings of the H line as both red and blue-shifts indicating that plasma was flowing both towards and away from the observer. A similar motion was observed perpendicular to the line-of-sight along the threads of the prominence spine.
The work presented here details ultra-high resolution EUV observations of counter-streaming flows along filament threads observed with NASA’s High-resolution Coronal Imager (Hi-C). It is the first observation of anti-parallel flows along adjacent filament threads in the EUV. We make the distinction here between the general term ‘counter-streaming’ (which can refer to bulk prominence mass flows as well as finer-scale motion), and the more specific ‘anti-parallel’ flows which we define as mass flows in opposite directions observed along adjacent filament threads.
Section 2 sets out a brief outline of the Hi-C instrument and the data used in this study. Section 3 sets out our results concerning (i) the photospheric magnetic environment of the filament, (ii) the width of the prominence threads, (iii) the velocity of the plasma flows along the threads, and (iv) the temperature profile of these flows. Section 4 presents the conclusions gathered from our analysis of this data-set.
2. Observations and data analysis
The High-resolution Coronal Imager (Hi-C; Cirtain et al., 2013; Kobayashi et al., 2013) is a new instrument developed by NASA’s Marshall Space Flight Center and partners111see acknowledgements that was launched on a sounding rocket at approximately 18:50 UT on 11 July 2012 from White Sands Missile Range. The instrument imaged a large, magnetically-complicated active region (AR 11520) with the highest degree of spatial resolution ever achieved in the EUV wavelength regime.
The pixel size of Hi-C is 0.1” giving it a spatial resolution of 0.3”. Comparing this with the 0.6” pixel size and 1.2” resolution of SDO/AIA (Lemen et al., 2012), Hi-C offers about four times higher resolution. The cadence of Hi-C was 5.5 seconds compared to SDO/AIA’s 12 seconds. AR 11520 was imaged by Hi-C for approximately five minutes and resulted in 200 seconds of high quality data for the field-of-view (FOV) (7.1’ x 7.0’) shown in Figure 1 (top-left panel).
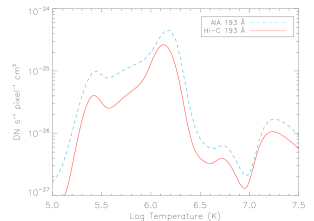
The Hi-C optics were designed to image a narrow wavelength region around 193 Å which is dominated by the Fe XII 195.119 Å line, formed at 1.5 MK. The temperature response of Hi-C (from SSW routine HIC_GET_RESPONSE.PRO) is very similar to the SDO/AIA 193 Å channel (see Figure 2). The SDO/AIA temperature response function was calculated using the CHIANTI (v7.1; Landi et al., 2013) ‘Isothermal’ routine with “coronal” abundances, standard ionization equilibrium, and a density of 1010 cm-3. It can be seen that both functions cover the same temperature regions with the same peaks and troughs in sensitivity.
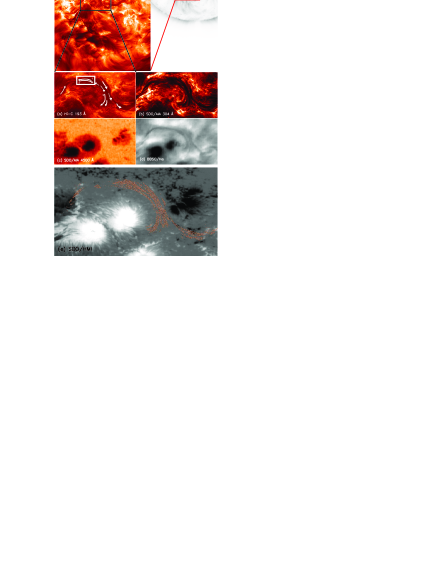
Figure 1 shows the context and location of the filament under investigation in Hi-C as well as co-aligned data from SDO/AIA (193 Å, 304 Å, 4500 Å), BBSO/H and SDO/HMI. Information from additional SDO/AIA filters (94 Å, 131 Å, 171 Å, 193 Å, 211 Å, 335 Å) was also utilized in the analysis of these flows.
3. Results
The small active region filament imaged by Hi-C exhibited clear anti-parallel flows along adjacent threads that run perpendicular to the line-of-sight, approximately along the spine of the filament. It is clear that these flows are part of the filament structure as they follow the topology of the filament channel. This is confirmed in Figure 1d where the filament is seen in H.
The nature of the anti-parallel flows has been explored by investigating the magnetic environment of the filament, the physical width of the filament threads, the velocity of the mass flows along these threads, and the temperature profile of the plasma that makes up these flows.
3.1. Magnetic structure
AR 11520 is a magnetically complex, decaying active region. The filament under observation is located in the middle of this region, wrapped around a sunspot (Figure 1c) and over a PIL (Figure 1e). The filament material is observed clearly in H (Figure 1d) which shows that the filament has a two-part structure (i.e. the main body curving around the sunspot and an additional component seen to branch off towards the West).
The plasma flows observed with Hi-C travel along the spine of the filament with the majority of the flows travelling Westward (shown by the arrows in Figure 1a). This suggests that the Eastward flows may be contained within a small subset of strands along the main filament body.
Flows of material within filaments can give clues about the magnetic field structure in and around these features (Mackay et al., 2010). However, caution must be exercised as the higher density of these structures means that these flows are not necessarily aligned with the magnetic field i.e., plasma is not ‘frozen into’ the magnetic field any longer. With this in mind, we suggest that these flows infer the magnetic field is horizontal along the spine of the filament but note that this does not shed any light on the structure of the surrounding magnetic field supporting the filament.
The HMI photospheric magnetogram in Figure 1e shows the position of the filament, overlaid in Hi-C contours, with respect to the PIL and surrounding magnetic field. Along the edge of the PIL multiple instances of magnetic flux convergence and subsequent cancellation were observed and attributed to the interaction between the dominant polarities on either side of the PIL, and areas of parasitic flux (i.e., smaller portions of weaker flux with a polarity opposite to the dominant polarity in a particular location). Various authors (see e.g., Martin & Echols, 1994; Wang & Muglach, 2007) suggest that these sites are associated with the ‘footpoints’ of filaments i.e., areas where the structure is rooted to the photosphere.
Multiple footpoints could be responsible for the difference in flow direction observed within the central part of the filament (white box Figure 1a). If the anti-parallel flows are in fact rooted in different polarity pairs, there could be a marked difference in say, any rate of magnetic reconnection and chromospheric evaporation taking place at each site. This in turn could influence the direction and nature of the plasma flows.
We interpret these flows as evidence of cool mass injection from the chromosphere moving horizontally along the filament spine and suggest that these anti-parallel flows are not a special-case scenario. Their particular orientation in this active region coupled with the high spatial resolution of Hi-C is the reason they are observed here for the first time.
3.2. Thread Width
The fine-scale structure of the filament threads is an important factor to determine. The anti-parallel flows along the filament are observed with Hi-C but are not as clear in SDO/AIA. Some anti-parallel motion may be seen in SDO/AIA 193 Å and 304 Å images but it is not clearly discernible (even with image enhancement) and we note that it would not be identifiable without Hi-C as a guide.
The width of the two adjacent threads that exhibit anti-parallel flows is examined in Figure 3. The top portion of this figure shows the anti-parallel flows seen by Hi-C and SDO/AIA 193Å where the dashed vertical lines indicate cuts that were taken to examine the width of the threads. It can be seen in these images that two distinct threads are clearly distinguished by Hi-C but not by SDO/AIA. The larger pixel size of SDO/AIA is also very apparent. The lower panel of this figure shows the intensity profile along the cuts in each case. These profiles show that the two threads are clearly identified by Hi-C but are merged into one structure by the larger pixel size of SDO/AIA.
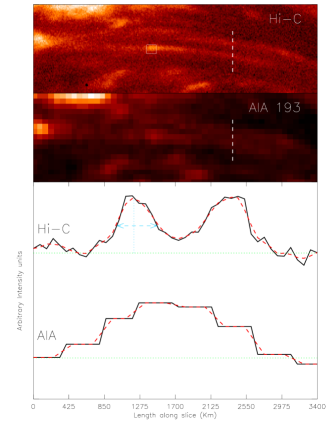
We define the physical width of the threads as the full width at half maximum (FWHM) of this intensity profile (blue dashed line) and this is found to be 0.8 0.1”. The gap between the threads was of a similar width (0.9”). This provides a strong indication that Hi-C has resolved fundamentally coherent structures at this wavelength. This is further validated by the number of Hi-C pixels contained within each thread’s intensity peak (7-9) which shows this is a clear structure well within the resolution of the instrument. This coherence will be investigated further by examining the speed of the flows.
3.3. Velocity
The flows labelled 1–3 in Figure 1a were
investigated further by constructing time-distance plots of intensity
(in pixels indicated by the arrow positions) over the 200 seconds of Hi-C
data available. Additional flows were observed along the filament but were not
measurable as time-distance plots due to background noise. Figure
4 shows these time-distance plots with the observed
flows and velocities highlighted.
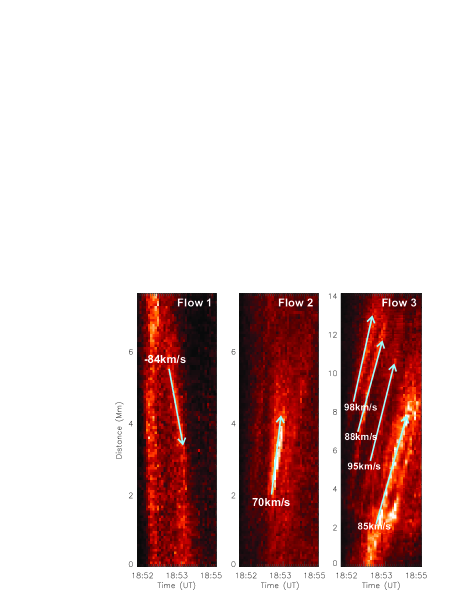
It can be seen in Figure 4 that flows 1 and 2 are anti-parallel and of the same order (-84.2 15.3 km s-1 and 70.2 15.6 km s-1 respectively). Flow ‘3’ (as labelled in Figure 1a) was also examined and was seen to exhibit multiple mass flows over the time series indicated by numerous diagonal signatures on the time-distance plot.
The magnitude of these uni-directional velocity flows are of the same order as flows 1 and 2 suggesting that the anti-parallel flows observed have a typical flow speed for this filament. Flow speeds measured by other authors in H are corresponding slower e.g., 5 - 20 km s-1 citepzirker94 due to the lower temperature/higher density of plasma imaged in this wavelength.
The larger pixel size of SDO/AIA meant that any signatures were lost in the background intensity and thus no measurement of velocity was possible without Hi-C.
3.4. Temperature
SDO/AIA provides valuable context for analysis of the Hi-C observations and allows the active region filament to be viewed over numerous wavelengths thereby allowing information regarding the area’s temperature distribution to be examined. Data from eight SDO/AIA channels (94 Å, 131 Å, 171 Å, 193 Å, 211 Å, 304 Å, 335 Å, 1600 Å) in the region of the anti-parallel flows was employed to determine how the intensity of the flows changed when viewed in different filters. A small region on one of the strands exhibiting anti-parallel flows was chosen for investigation (Figure 3 white box). The left panel of Figure 5 shows normalised light-curves in five of these SDO/AIA channels (plus Hi-C) which exhibited a peak in intensity (channels 94 Å 211 Å and 335 Å exhibited a flat intensity profile over the time series).
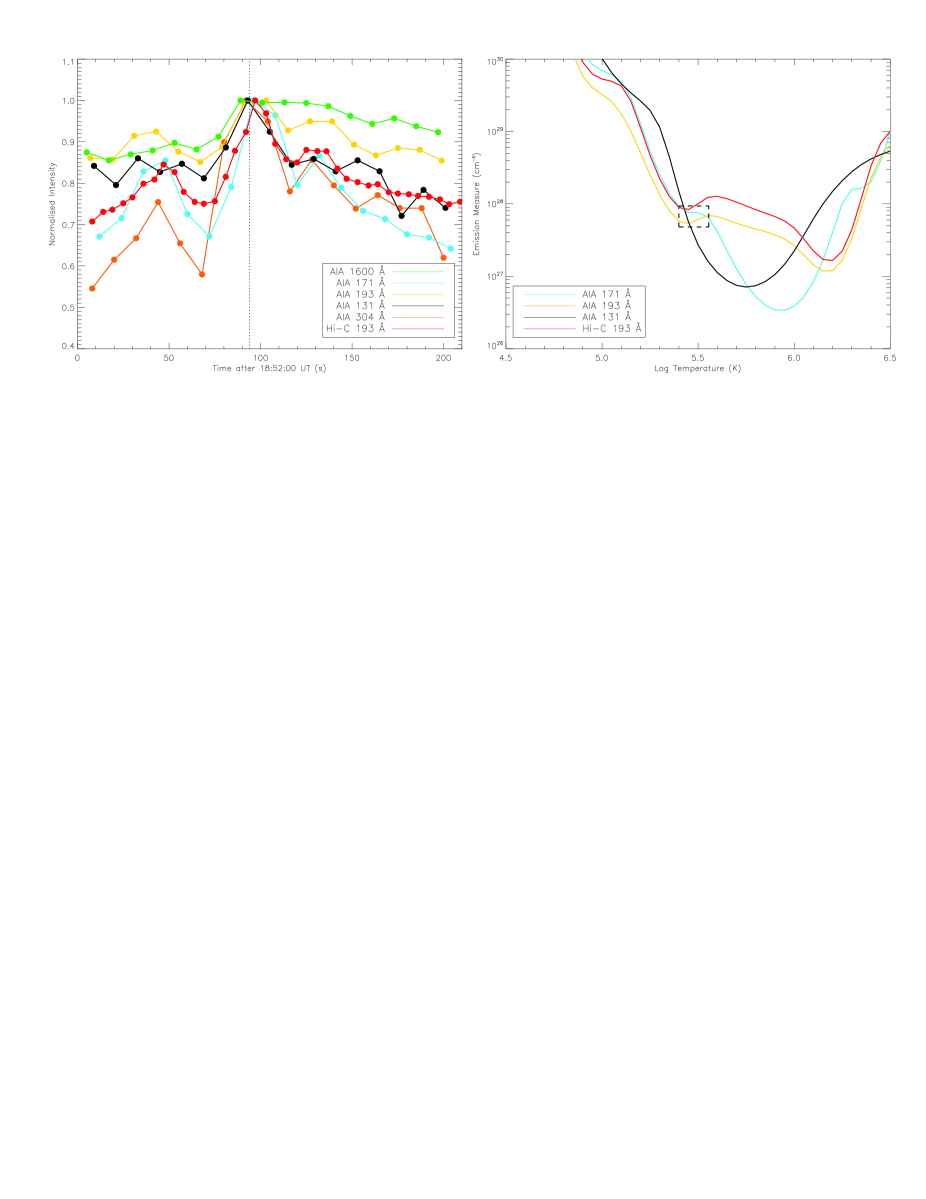
Six filters exhibited a peak in intensity at around 18:53:35 UT (dotted line in left panel of Figure 5) with the spread of the peaks being 10 s around this time. Since the temporal cadence of SDO/AIA is 12 s, it is not possible to quantify each filter’s peak emission time with more accuracy so we shall consider these peaks co-temporal within the instrumental constraints.
This co-temporal intensity peak suggests that either the plasma is very multithermal or is isothermal at a temperature that all these filters are sensitive to. It is very likely that this is a mass flow as opposed to a heating event creating a conduction front as the peaks would occur in a clear order with a time-lag in between (see e.g., Viall & Klimchuk, 2011) if this was the case.
The temperature distribution of these flows was further investigated using the Emission Measure Loci method (see e.g., Del Zanna et al., 2002). The constructed plot is shown in the right panel of Figure 5 and was made using the same intensity values gathered from the region highlighted by the small white box in Figure 3.
The SDO/AIA temperature response functions were calculated using the method described by Del Zanna et al. (2011) (see Section 2). Caution must be exercised when using imager data for this type of analysis as there are a number of well-known problems with some of the SDO/AIA filters e.g. cross-talk, unidentified lines, second order contributions (see e.g., O’Dwyer et al., 2010; Del Zanna et al., 2011; Boerner et al., 2012). The four filters used for EM loci analysis were selected as they showed a peak in intensity at this time and are not representative of transition region plasma (as the SDO/AIA 304 Åand 1600 Åare).
It can be seen that the four curves cross within the area highlighted by the dashed black box. The middle of this box is found to be at log T (K) = 5.45 0.1. This temperature is higher than the average temperature of filament material which is of the order of 104 K (Labrosse et al., 2010).
4. Discussion and conclusions
This work has highlighted anti-parallel flows observed along adjacent filament threads as seen by Hi-C. It has been shown that although SDO/AIA gives valuable context and multi-wavelength observations, the instrument cannot identify these small-scale flows or measure their width or velocity. This work, as well as additional work using Hi-C (see Cirtain et al., 2013; Testa et al., 2013; Winebarger et al., 2013; Régnier et al., 2013), has explicitly shown that Hi-C captured phenomena never seen before and which cannot be properly examined using current instrumentation.
The pattern of flows seen along the filament suggests that the flows are closely related to the magnetic footpoints of the structure. It is likely that the two threads exhibiting anti-parallel flows are separate sub-structures within the filament as the coherence of the velocity flows suggests the plasma is flowing along different flux tubes. The flows travel horizontally along the spine of the filament but we have no information about the inclination of the individual threads so cannot comment on the overall structure of the magnetic field.
Measuring the width of the filament threads established that the structures are spatially coherent. However it is the velocity coherence that demonstrates these anti-parallel flows are contained within separate sub-structures. Furthermore, it is possible these separate threads are ‘bundles’ of smaller-scale thread-like structures exhibiting the same pattern of mass flows.
Based on the calculated velocities, these anti-parallel flows are similar to other flows observed within the filament suggesting that they are not a special case and therefore may be ubiquitous within all filaments/prominences.
The temperature of one of the flows is indicated to be log T (K) = 5.34 0.2 ( 200,000 K) which is supported by the corresponding intensity enhancements seen in the cooler SDO/AIA 304 Å and 1600 Å filters. This temperature is around ten times higher than the norm for filaments and could be due to the proximity of the intense magnetic field around the sunspot, or because the plasma flows are the result of chromospheric evaporation. Either way, this temperature agrees with the observations presented.
Studying small-scale filament flows such as those observed by Hi-C can give valuable information concerning fundamental questions such as the source and sinks of the mass flows, as well as the orientation of the magnetic field within these structures. From these observations it seems the magnetic field within this filament is parallel to the solar disk rather than helical in nature - something which can impact a lot of the current models on prominence structure.
This is the first direct, sub-arcsecond observation of anti-parallel/counter-streaming flows along filament threads at EUV wavelengths and showcases the power of Hi-C’s higher spatial and temporal resolution. Future work will expand upon this analysis by incorporating modelling of the filament magnetic field using SDO/HMI data. This will allow us to comment further on the origin of the anti-parallel flows and also to extend this work to other examples of small-scale filament flows.
References
- Babcock & Babcock (1955) Babcock, H. W. & Babcock, H. D. 1955, ApJ, 121, 349
- Boerner et al. (2012) Boerner, P., Edwards, C., Lemen, J., et al. 2012, Sol. Phys., 275, 41
- Chae et al. (2000) Chae, J., Denker, C., Spirock, T. J., Wang, H., & Goode, P. R. 2000, Sol. Phys., 195, 333
- Chae et al. (2007) Chae, J., Park, H.-M., & Park, Y.-D. 2007, Journal of Korean Astronomical Society, 40, 67
- Cirtain et al. (2013) Cirtain, J. W., Golub, L., Winebarger, A. W., et al. 2013, Nature, 493, 501
- Del Zanna et al. (2002) Del Zanna, G., Landini, M., & Mason, H. E. 2002, A&A, 385, 968
- Del Zanna et al. (2011) Del Zanna, G., O’Dwyer, B., & Mason, H. E. 2011, A&A, 535, A46
- Deng et al. (2002) Deng, Y., Lin, Y., Schmieder, B., & Engvold, O. 2002, Sol. Phys., 209, 153
- Engvold (1976) Engvold, O. 1976, Sol. Phys., 49, 283
- Heinzel et al. (2001) Heinzel, P., Schmieder, B., & Tziotziou, K. 2001, ApJ, 561, L223
- Kobayashi et al. (2013) Kobayashi, K., Cirtain, J. W., Golub, L., et al. 2013, xx
- Labrosse et al. (2010) Labrosse, N., Heinzel, P., Vial, J.-C., et al. 2010, Space Sci. Rev., 151, 243
- Landi et al. (2013) Landi, E., Young, P. R., Dere, K. P., Del Zanna, G., & Mason, H. E. 2013, ApJ, 763, 86
- Lemen et al. (2012) Lemen, J. R., Title, A. M., Akin, D. J., et al. 2012, Sol. Phys., 275, 17
- Lin et al. (2005) Lin, Y., Engvold, O., Rouppe van der Voort, L., Wiik, J. E., & Berger, T. E. 2005, Sol. Phys., 226, 239
- Lin et al. (2003) Lin, Y., Engvold, O. R., & Wiik, J. E. 2003, Sol. Phys., 216, 109
- Mackay et al. (2010) Mackay, D. H., Karpen, J. T., Ballester, J. L., Schmieder, B., & Aulanier, G. 2010, Space Sci. Rev., 151, 333
- Martin & Echols (1994) Martin, S. F. & Echols, C. R. 1994, in Solar Surface Magnetism, ed. R. J. Rutten & C. J. Schrijver, 339
- O’Dwyer et al. (2010) O’Dwyer, B., Del Zanna, G., Mason, H. E., Weber, M. A., & Tripathi, D. 2010, A&A, 521, A21
- Panasenco & Martin (2008) Panasenco, O. & Martin, S. F. 2008, ASP Conf. Ser., 383, 243
- Régnier et al. (2013) Régnier, S., Alexander, C. E., Walsh, R. W., Cirtain, J. W., Winebarger, A. R., Golub, L., Korreck, K. E., DePontieu, B., Kobayashi, K., Korreck, K. E., Mitchell, N., Platt, S., Weber, M., De Pontieu, B., Title, A., Kobayashi, K., Kuzin, S., DeForest, C. E. 2013, in prep.
- Schmieder et al. (2008) Schmieder, B., Bommier, V., Kitai, R., et al. 2008, Sol. Phys., 247, 321
- Schmieder et al. (2004) Schmieder, B., Lin, Y., Heinzel, P., & Schwartz, P. 2004, Sol. Phys., 221, 297
- Testa et al. (2013) Testa, P., De Pontieu, B., Martínez-Sykora, J., et al. 2013, ApJ, 770, L1
- Viall & Klimchuk (2011) Viall, N. M. & Klimchuk, J. A. 2011, ApJ, 738, 24
- Wang & Muglach (2007) Wang, Y.-M. & Muglach, K. 2007, ApJ, 666, 1284
- Winebarger et al. (2013) Winebarger, A. R., Cirtain, J. W., Golub, L., DePontieu, B., Kobayashi, K., Moore, R. L., Walsh, R. W., Korreck, K. E., McCauley, P., Title, A., Kuzin, S., & DeForest, C. E. 2013, submitted
- Zirker et al. (1998) Zirker, J. B., Engvold, O., & Martin, S. F. 1998, Nature, 396, 440