Extension of SASE bandwidth up to as a way to increase the efficiency of protein structure determination by x-ray nanocrystallography
at the European XFEL
Abstract
Femtosecond x-ray nanocrystallography exploiting XFEL radiation is an emerging method for protein structure determination using crystals with sizes ranging from a few tens to a few hundreds nanometers. Crystals are randomly hit by XFEL pulses, producing diffraction patterns at unknown orientations. One can determine these orientations by studying the diffraction patterns themselves, i.e. by indexing the Bragg peaks. The number of indexed individual images and the SASE bandwidth are inherently linked, because increasing the number of Bragg peaks per individual image requires increasing the bandwidth of the spectrum. This calls for a few percent SASE bandwidth, resulting in an increase in the number of indexed images at the same number of hits. Based on start-to-end simulations for the baseline of the European XFEL, we demonstrate here that it is possible to achieve up to a tenfold increase in SASE bandwidth, compared with the nominal mode of operation. This provides a route for further increasing the efficiency of protein structure determination at the European XFEL. We illustrate this concept with simulations of lysozyme nanocrystals.
DEUTSCHES ELEKTRONEN-SYNCHROTRON
Ein Forschungszentrum der Helmholtz-Gemeinschaft
DESY 13-109
June 2013
Extension of SASE bandwidth up to as a way to
increase the efficiency of protein structure determination by x-ray
nanocrystallography
at the European XFEL
Svitozar Serkeza, Vitali Kocharyana, Evgeni Saldina, Igor Zagorodnova, Gianluca Gelonib, and Oleksander Yefanovc
aDeutsches Elektronen-Synchrotron DESY, Hamburg
bEuropean XFEL GmbH, Hamburg
cCenter for Free-Electron Laser Science, Hamburg ISSN 0418-9833 NOTKESTRASSE 85 - 22607 HAMBURG
1 Introduction
X-ray crystallography is currently the leading method for imaging macromolecules with atomic resolution. Third generation synchrotron sources allow for successful structure determination of proteins. The size of a typical single crystal used for conventional protein crystallography is in the order of m m HUNT . Obtaining sufficiently large crystals is currently a serious stumbling block as regards structure determination. The new technique of femtosecond nanocrystallography is based on data collection from a stream of nanocrystals, and ideally fills the gap between conventional crystallography, which relies on the use of large, single crystals, and single-molecular x-ray diffraction.
The availability of XFELs allows for a new ”diffraction before destruction” approach to overcome radiation damage due to the ultrafast and ultrabright nature of the x-ray pulses, compared to the time scale of the damage process HAJD -SEIB . In fact, if such time-scale is longer than the pulse duration, the diffraction pattern yields information about the undamaged material. Femtosecond nanocrystallography involves sequential illumination of many small crystals of proteins by use of an XFEL source CHA3 . The high number of photons incident on a specimen are expected to produce measurable diffraction patterns from nanocrystals, enabling structure determination with high resolution also for systems that can only be crystallized into very small crystals and are not suitable, therefore, for conventional crystallography. Each crystal is used for one exposure only, and the final integrated Bragg intensities must be constructed from ”snapshot” diffraction patterns containing partially recorded intensities. Each pattern corresponds to a different crystal at random orientation. Experiments at the LCLS LCLS2 confirmed the feasibility of the ”diffraction before destruction” method at near atomic resolution using crystals ranging from m to m CHA3 . This method relies on x-ray SASE pulses with a few mJ energy, a few microradians angular spread, and about bandwidth with a photon energy range between 2 keV and 9 keV.
The success of nanocrystallography depends on the robustness of the procedure for pattern determination. After acquisition, diffraction patterns are analyzed to assign indexes to Bragg peaks (indexing procedure). Each of the indexed peaks is integrated in order to obtain an intensity. Intensities of corresponding peaks are averaged within the dataset. The table of peak indexes and intensities obtained in this way is used for protein structure determination. Indexing algorithms used in crystallography enable to determine the orientation of the diffraction data from a single crystal when a relatively large number of reflections are recorded. Femtosecond nanocrystallography brings new challenges to data processing KIRI . The problem is that single snapshots of crystal diffraction patterns may contain very few reflections, which are not enough for indexing. In this paper we will show how to overcome this obstacle.
The number of Bragg peaks is proportional to the bandwidth of the incident radiation pulse. Considering the baseline configuration of the European XFEL TSCH , and based on start-to-end simulations, we demonstrate here that it is possible to achieve a tenfold increase in bandwidth by strongly compressing electron bunches with a charge of nC up to 45 kA. This allows data collection with a bandwidth, a few mJ radiation pulse energy, a few fs pulse duration, and a photon energy range between 2 keV and 6 keV, which is the most preferable range for nanocrystallography BERG .
The generation of x-ray SASE pulses at the European XFEL using strongly compressed electron bunches has many advantages, primarily because of the very high peak power and very short pulse duration that can be achieved in this way DOHL . Here we demonstrate (see Section 3 for more details) that a few TW power-level can be achieved in the SASE regime, and with 3 fs-long pulses. For electron bunches with very high peak-current, the wakefields (mainly due to the undulator vacuum pipe) have a very important effect on the lasing process. In fact, the variation in energy within the electron bunch due to wakefield effects is large, and yields, as a consequence, a tenfold increase in the SASE radiation bandwidth. However, as we demonstrate here (see Section 2 in more details), a large bandwidth presents many advantages for nanocrystallography, and provides a route for increasing the efficiency of data processing.
2 Potential for femtosecond x-ray nanocrystallography using SASE pulses with bandwidth
In nanocrystallography CHA3 , crystals of a few hundred nanometers or smaller are delivered to the interaction region in a liquid jet. When a crystal in the jet is hit at random and unknown orientation, such orientation can readily be determined from the diffraction pattern itself, by indexing the Bragg peaks KIRI . Several auto-indexing programs have been developed for crystallography. They search for a repeating lattice in the measured diffraction pattern, knowing the mapping of that pattern onto the Ewald sphere OTWI -LESL . In the practical case of a crystal with different unit-cell spacings in each dimension, the basis vectors of the reciprocal lattice can be identified quite readily from the reciprocal lattice spacings observed in the diffraction pattern. Each Bragg peak in the pattern can be thereby indexed by its 3D Miller indexes, and properly accumulated. In this way, diffraction data are build up, averaging over all crystal shapes and sizes, and yielding complete 3D information as if one were collecting data from a single undamaged rotating crystal.
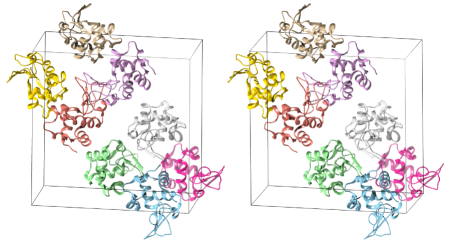
Each x-ray pulse produces a diffraction pattern from a single crystal. The resulting data set consists of thousands of diffraction patterns from randomly oriented crystals, recorded under ”snap-shot conditions”. Each pattern is not angle-integrated across the Bragg reflections, and is affected by beam divergence, energy spread, broadening by the small size and possible lattice imperfections of the crystals. We assume that the pulse duration is sufficiently short, so that no radiation damage effects occur. Our aim here is to demonstrate that a tenfold increase in the SASE bandwidth results in an increase in the number of indexed images at a fixed number of hits. In this paper we test this concept with simulations of lysozyme nanocrystals, see Fig. 1. The orientation of each nanocrystal is determined from the diffraction pattern by using automated indexing software such as CrystFEL WHIT . The spectral width of the x-ray beam may be simulated by summing diffracted intensities over a spread of photon energies. For simulations in this work we neglect the photon beam divergence, because this effect causes a much smaller effect than the tenfold increase in bandwidth.

Results from our simulated experiment can be represented in terms of the reciprocal lattice concept, as shown in Fig. 2. There we assume that the spectrum of the incident radiation pulse has a stepped profile between and . Let us consider two Ewald spheres with radii and , tangent to the origin of the reciprocal lattice, as shown in Fig. 2. The shaded region between them is accessible to the experiment, as the diffraction condition is satisfied for all reciprocal lattice points within it. We model the diffraction patterns obtained in this case as an average over the number of diffraction patterns, obtained at wavelengths within the bandwidth.
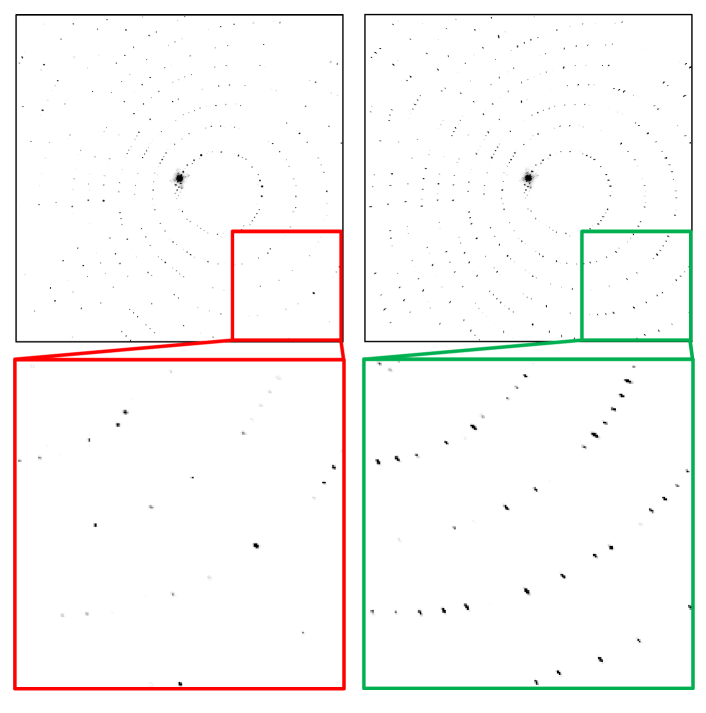
A comparison between diffraction patterns obtained with a monochromatic and a polychromatic x-ray pulse is shown in Fig. 3. The radiation pulses are short enough (about 3 fs) to overcome crystal destruction. Therefore, the simulation was performed neglecting radiation damage. Patterns were calculated for crystals at random orientations. Fig. 3 shows a typical simulation, clearly showing the significant increase in number of Bragg peaks per individual image in the case of a polychromatic x-ray beam. Our results suggest that if the bandwidth of the incident x-ray beam is tenfold increased, the number of indexed reflections will be much higher.
3 FEL studies
We performed a feasibility study with the help of the FEL code Genesis 1.3 GENE running on a parallel machine. We will present results for the SASE3 FEL line of the European XFEL, based on a statistical analysis consisting of runs. The overall undulator and electron beam parameters used in the simulations are presented in Table 1.
| Units | ||
|---|---|---|
| Undulator period | mm | 68 |
| Periods per cell | - | 73 |
| Total number of cells | - | 21 |
| Intersection length | m | 1.1 |
| Energy | GeV | 17.5 |
| Charge | nC | 0.25 |

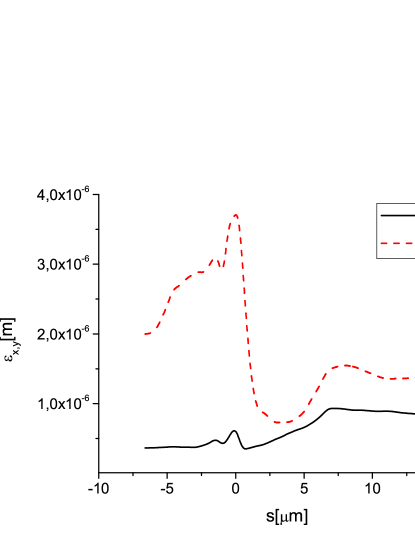


The expected beam parameters at the entrance of the SASE3 undulator, and the resistive wake inside the undulator are shown in Fig. 4, see S2ER . Our calculations account for both wakes and quantum fluctuations in the SASE1 undulator. The nonlinear increase of the energy spread is a consequence of the quadratic superposition of the initial energy spread , being the coordinate inside the bunch, and the contribution due to quantum diffusion , yielding . Note the difference in energy chirp and energy spread at the entrance of SASE1 and at the entrance of SASE3. The additional energy chirp induced during the passage through SASE1, due to the presence of resistive wakes, is very helpful in our case, because it increases the energy chirp, and finally leads to a larger bandwidth.
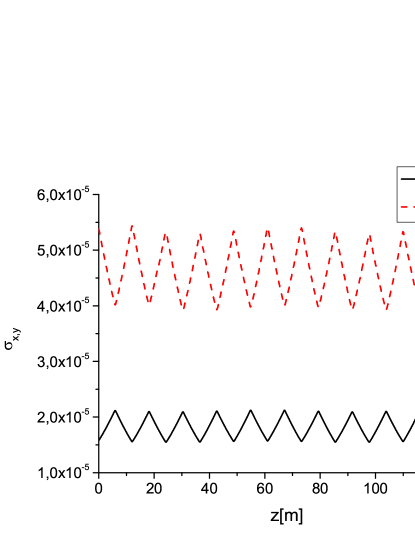
Due to collective effects in the bunch compression system, emittances in the horizontal and vertical directions are significantly different. As a result, the electron beam looks highly asymmetric in the transverse plane: in the horizontal direction m, while in the vertical direction m. The evolution of the transverse electron bunch dimensions are plotted in Fig. 5.
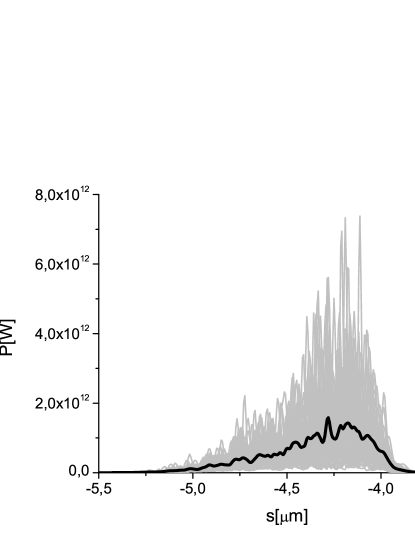
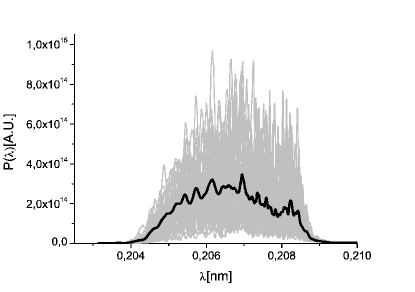


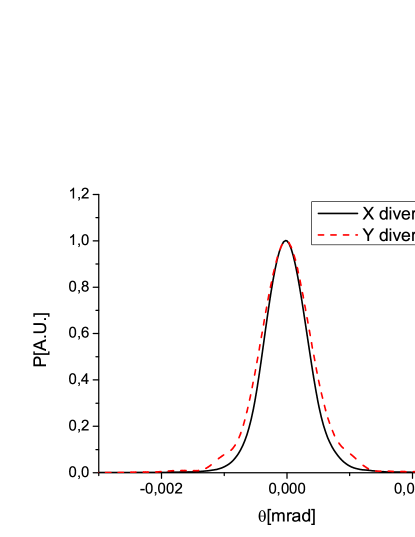
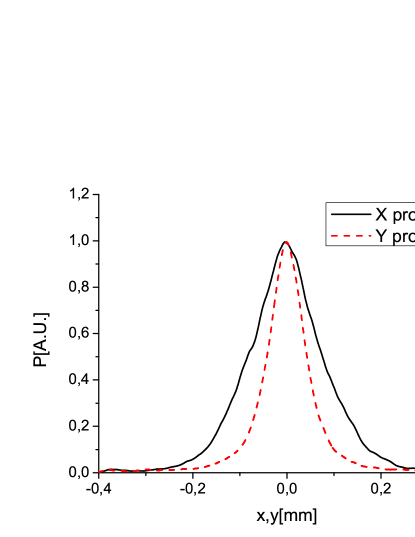
The output SASE power distribution and spectrum after the undulator segments of SASE3 are shown in Fig. 6. The evolution of the energy per pulse and of the energy fluctuations as a function of the undulator length are shown in Fig. 7. Finally, the distribution of the radiation pulse energy per unit surface and the angular distribution of the radiation pulse energy at the exit of SASE3 undulator are shown in Fig. 8.
Note that, since the electron beam is transversely asymmetric, the output radiation beam is asymmetric too. Intuition would incorrectly suggest that a larger size of the electron bunch should be responsible for a larger size of the radiation beam, but a quick comparison of Fig. 5 and Fig. 8 show that this is not the case in reality. In fact we see that, in the vertical direction, the size of the photon beam is about m, practically the same as the electron beam. This means that, within a gain length, the expansion of the radiation beam due to diffraction in the vertical direction is much less than the vertical size of the electron bunch. On the contrary, in the other direction radiation expands outside of the electron bunch due to diffraction effects, and the photon beam size grows to about m, which is times larger than the electron bunch size.
Finally, it should be appreciated that the characteristics of the radiation beam produced as described in this article are very suitable for nanocrystallography. The photon energy is about keV, and radiation is delivered in fs pulses with an energy of about mJ . Our study shows that for the particular mode of operation investigated here, we have straightforwardly TW power in the SASE regime already, which constitutes an increase of about two orders of magnitude compared with the nominal mode of operation.
4 Conclusions
Output characteristics of the European XFEL have been previously studied assuming an operation point at 5 kA peak current. In this case, the baseline SASE undulator sources will saturate at about 50 GW (see e.g. TSCH ). This power limit is very far from the multi-TW level required for bio-imaging applications. In this paper we explore the possibility to go well beyond the nominal 5 kA peak current. In order to illustrate the potential of this approach we consider a 0.25 nC bunch compressed up to 45 kA peak current. Based on start-to-end simulations it is shown here that 2 TW power could be generated in the SASE regime for a photon energy range between 2 keV and 6 keV, which is optimal for femtosecond X-ray nanocrystallography and single biomolecular imaging111Numerical calculations show that, using undulator tapering in the SASE mode of operation, it is possible to reach 2 TW peak power at 6 keV. However, such undulator tapering additionally reduces the bandwidth from in an uniform undulator to about . Since our goal here is to maximize the bandwidth for applications in nanocrystallography, in this article we consider the uniform undulator option, allowing for generation of radiation pulses of 1 TW power and bandwidth.. This example illustrates the potential for improving the performance of the European XFEL without additional hardware222Our simulations are based on the 21 cells foreseen for the SASE3 undulator beamline TSCH , Table 1.. This solution to generate TW power mode of operation is not without complexities. The price for using a very high peak-current is operation with a large energy chirp within the electron bunch, yielding a large SASE radiation bandwidth. However, it is shown here that there are applications like nanocrystallography, where x-ray radiation pulses with a few percent bandwidth present many advantages, compared to those produced in the nominal SASE mode of operation, which have a relative bandwidth of a fraction of a percent.
5 Acknowledgements
We are grateful to Massimo Altarelli, Reinhard Brinkmann, Henry Chapman, Janos Hajdu, Viktor Lamzin, Serguei Molodtsov and Edgar Weckert for their support and their interest during the compilation of this work. We thank Edgar Weckert for providing the code MOLTRANS to one of us (O.Y.).
References
- [1] M. S. Hunter et al., Biophysical Journal 100, p.198 (2011).
- [2] J. Hajdu, Curr. Opin. Struct. Biol. 10, 569 (2000)
- [3] R. Neutze et al., Nature 406, 752 (2000)
- [4] H. Chapman et al., Nat. Phys. 2, p. 839 (2006).
- [5] K. J. Gaffney and H. N. Chapman, Science 316, 1444 (2007)
- [6] M. M. Seibert et al., Nature 470 (7332) 78-81 (2011)
- [7] H. Chapman et al., Nature 470, p.73 (2011).
- [8] P. Emma et al., Nature photonics doi:10.1038/nphoton.2010.176 (2010)
- [9] Kirian et al., Opt Express 18, 5713-5723 (2010).
- [10] T. Tschentscher for the European XFEL project team, ”Layout of the x-ray systems at the European XFEL”, XFEL.EU TN-11-001 (2011).
- [11] S. Baradaran et al., LCLS-II New Instruments Workshops Report, SLAC-R-993 (2012), see Section 4.3.2. by H. Chapman et al., and Section 4.3.3. by F. R. N. C. Maia et al.
- [12] T. Limberg et al., ”Optimized bunch compressor system for the European XFEL”, Proceedings of 2005 Particle Accelerator Conference, Knoxville, Tennessee, 1236, http://accelconf.web.cern.ch/AccelConf/P05/PAPERS/RPPT011.PDF (2005)
- [13] Z. Otwinowski, W. Minor , Methods Enzymol., 276, 307-326 (1997).
- [14] I. Steller, R. Bolotovsky, M. Rossmann J. Appl. Crystallogr., 30 1036-1040 (1997).
- [15] A. Leslie, Acta Crystallogr., D55, 1696-1702 (1999).
- [16] The structure can be found in the Protein Data Bank: http://www.rcsb.org/pdb/explore/explore.do?structureId=4ETD
- [17] T. A. White, et al., Applied Crystallography 45, p. 33 (2012).
- [18] S. Reiche et al., Nucl. Instr. and Meth. A 429, 243 (1999).
- [19] I. Zagorodnov, ”Beam Dynamics Simulations for XFEL”, http://www.desy.de/xfel-beam/s2e (2011), and ”Compression scenarios for the European XFEL”, http://www.desy.de/fel-beam/data/talks/files/ZagorodnovACC2012readynew.pptx, (2012).