A new way to measure supermassive black hole spin in accretion disc dominated Active Galaxies
Abstract
We show that disc continuum fitting can be used to constrain black hole spin in a subclass of Narrow Line Seyfert 1 (NLS1) AGN as their low mass and high mass accretion rate means that the disc peaks at energies just below the soft X-ray bandpass. We apply the technique to the NLS1 PG1244+026, where the optical/UV/X-ray spectrum is consistent with being dominated by a standard disc component. This gives a best estimate for black hole spin which is low, with a firm upper limit of . This contrasts with the recent X-ray determinations of (close to) maximal black hole spin in other NLS1 based on relativistic smearing of the iron profile. While our data on PG1244+026 does not have sufficient statistics at high energy to give a good measure of black hole spin from the iron line profile, cosmological simulations predict that black holes with similar masses have similar growth histories and so should have similar spins. This suggests that there is a problem either in our understanding of disc spectra, or/and X-ray reflection or/and the evolution of black hole spin.
keywords:
X-rays: accretion discs, black hole physics1 Introduction
’Black holes have no hair’, meaning that they have no distinguishing features, other than mass and spin (charge is negligible in an astrophysical setting). However, they are most easily observed via a luminous accretion flow, so mass accretion rate is another important quantity in determining their appearance, with a weak dependence on inclination angle. Thus there are only four parameters, and yet there is a wide diversity in the observed properties of AGN. While the black hole mass and mass accretion rate can be reasonably well determined, spin only leaves an imprint on the space-time close to the event horizon, so is hard to measure. Hence it is often the first candidate to explain any property which is not well understood, such as the emergence of powerful radio jets (e.g. Begelman, Blandford & Rees 1984), feedback from which controls the star formation powered growth of galaxies (e.g. Bower et al 2006). However, spin has wider importance as it preserves the history of how the mass of the black hole grows over cosmic time (Volonteri et al 2005; Fanidakis et al 2011), determines the gravitational wave signature arising from black hole coalescence in galaxy mergers (Centrella et al 2010), and whether the resulting black hole is likely to be ejected from the host galaxy (King et al 2008).
Currently, the only well established method to measure black hole spin in Active Galactic Nuclei (AGN) is from the iron K line profile. X-ray illumination of the accretion disc gives rise to a fluorescent iron K line at 6.4-7 keV and associated continuum reflection, both of which are sculpted by special and general relativistic effects. Larger line widths require material closer to the black hole, and hence imply higher spin (Fabian et al 1989; 2000).
A range of black hole spins are found with this technique (e.g the compilations of Nandra et al 2007; Brenneman & Reynolds 2009; de la Calle Perez et al 2010), but a subset of low luminosity spectra from the most variable Narrow Line Seyfert 1 (NLS1) galaxies (Gallo 2006) show dramatically broad iron features. These require extreme spin if these are produced primarily through relativistic reflection e.g. MCG-6-30-15 (Wilms et al 2001; Fabian et al 2002; Brenneman & Reynolds 2006; Miniutti et al 2007; Chiang & Fabian 2011), and 1H0707-495 (Fabian et al 2004; 2009). However, the models developed to explain these low luminosity datasets are extreme, not just in terms of black hole spin, but also in requiring a source geometry where the continuum can be strongly gravitationally focussed onto the inner disc to give reflection dominated spectra and an extremely centrally concentrated emissivity (Fabian et al 2004; Miniutti & Fabian 2004; Fabian et al 2009; Zoghbi et al 2010).
These extreme parameters motivated alternative models where the spectral curvature around the iron line is instead produced by complex absorption (e.g. Mkn 766: Turner et al 2007; Miller et al 2007; MCG-6-30-15: Miller et al 2009). The broad features are then indicative of winds and feedback from the AGN rather than black hole spin (Sim et al 2010; Tatum et al 2012).
There is hope that the controversy over the nature of the spectra may be settled using new combined spectral-timing analysis techniques (Fabian et al 2009; Wilkins et al 2013 but see Legg et al 2012) and/or new high energy data from NuStar (Risaliti et al 2013 but see Miller & Turner 2013). However, the current debate even on these topics highlights the need for another method to measure of black hole spin. One possibilitity is from the soft X-ray excess, an additional component seen ubiquitously in AGN alongside the expected disc and high energy power-law tail. If this is also formed from reflection, then black hole spin can be constrained by the amount of relativistic smearing of the soft X-ray lines as well as the iron K line (Crummy et al 2006). However, this remains controversial, as the soft X-ray excess may instead be a separate continuum component (see Section 2, below).
Instead, there is another well studied method to measure black hole spin which is routinely applied to Galactic black holes binaries (BHB). These can have accretion disc spectra which peak at X-ray energies, as expected from standard disc models (Shakura & Sunyaev 1973). A single measure of the peak temperature, , and total disc luminosity, , give an estimate of black hole spin when the system parameters (black hole mass, inclination and distance) are known. This derived size scale is observed to remain constant despite large changes in mass accretion rate, giving confidence in the standard disc models (Ebisawa et al 1991; 1993; Kubota et al 2001, Gierlinski & Done 2004; Davis, Done & Blaes 2006; Steiner et al 2010). However, this constant radius (i.e. behaviour is only seen when the disc dominates the spectrum. The reconstruction of the disc intrinsic luminosity and temperature becomes progressively more model dependent where the high energy tail contributes more than % of the bolometric luminosity, hence such data are not reliable estimators of black hole spin (Kubota et al 2001; Kubota & Done 2004; Steiner et al 2010).
This technique has not been widely used in AGN, predominantly because the predicted disc spectra depend on both black hole mass and mass accretion rate, so without a good mass estimate it is not possible to accurately determine the position of the peak disc emission. However, generically this peak should lie in the UV region, which cannot be directly observed in low redshift AGN due to interstellar absorption, so there was no strong motivation to study this further. AGN spectra are also generally not dominated by the thermal disc component, but have substantial luminosity at higher energies (Elvis et al 1994; Richards et al 2006) i.e. where BHB show that spin determination from the disc continuum component is not robust.
There are three key factors which allow us to now apply this technique to some AGN to constrain their black hole spin. Firstly, black hole mass in AGN can now be estimated via scaling relationships based on the optical broad line region widths (e.g Kaspi et al 2000). The optical continuum from the disc then directly measures the mass accretion rate through the outer disc (with a weak dependence on inclination: Davis & Laor 2011). Secondly, we have recently identified a new class of AGN, whose spectra are dominated by the disc (Jin et al 2012a; b hereafter J12a,b and Done et al 2012; hereafter D12; Terashima et al 2012). These do have a high energy tail and a soft X-ray excess, but the luminosity in these components is small compared to the disc emission. Hence they form a subset of objects where disc continuum fitting model can be used with some confidence. These objects are all NLS1, so have low mass black holes, and high mass accretion rates (Boroson 2002). This combination gives the highest predicted disc temperatures, peaking in the EUV rather than the UV, so increasing spin leads to the Wien tail of the disc emission extending into the observable soft X-ray bandpass (D12). Thirdly, we have developed new improved disc models which approximately incorporate the results of full radiative transfer through the disc photosphere via a colour temperature correction to the blackbody temperature (D12). Such models have previously only been widely available for spectral fitting stellar mass black holes in binary systems (Li et al 2005).
We demonstrate the technique using PG 1244+026, a bright, low redshift (z = 0.048, corresponding to D = 211 Mpc) disc-dominated NLS1 AGN (J12a,b, see also Figs 2 and 4), where absorption corrections to both the UV and soft X-ray emission are small due to the low column along the line of sight. This is not one of the NLS1 which shows a low flux state, so does not have the extreme iron line features, but instead has a relatively simple X-ray continuum shape (see Figs. 2 and 4). We use a new, 100ks, high quality dataset from the XMM-Newton satellite (see Jin et al 2013, hereafter J13) to improve statistics over those of J12a,b, and to determine the black hole mass via X-ray variability as well as the H line width. Using the maximum mass produces a lower limit on the disc temperature which strongly requires low spin in order not to overpredict the observed soft X-ray flux. Extending the AGN continuum model of D12 to include relativistic effects, inclination dependence and advection does not substantially change this conclusion.
A low spin for this NLS1 is in sharp contrast with the high spin derived for other NLS1 which show low flux episodes described above. Our X-ray data are not sufficient to derive the profile of the iron line with high confidence, so we cannot yet say whether the low spin determination in this object is in conflict with its iron line profile. Better high energy data are required in order to determine whether this new method gives a spin estimate which is consistent with that derived from the iron line, or whether it instead reveals a lack of understanding of disc continuum emission and/or of disc reflection.
 |
 |
2 Disc models and the nature of the soft X-ray excess
Since the early 1980s it was recognised that the blue optical/UV continuum from AGN is from a geometrically thin, optically thick accretion disc around a supermassive black hole (Malkan 1983). This disc emission should not completely thermalise, as electron scattering in the disc is important as well as true absorption (e.g. Czerny & Elvis 1987; Ross, Fabian & Mineshige 1991). The photospheric emission from the disc including these effects can be calculated from full radiative transfer models (e.g. the TLUSTY code of Hubeny et al 2001, as used by Davis & Laor 2011). However, in the stellar mass BHB, these effects are typically modelled as a colour temperature correction, where the local flux , where is the predicted blackbody temperature at radius .
For the BHB, typical values are (Shimura & Takahara 1995). Observations of LMC X-3 at show a disc dominated spectrum which peaks in at keV (Kolehmainen & Done 2013). Scaling this by a factor of as appropriate for a at predicts that low mass, high mass accretion rate AGN such as NLS1 should have discs which peak at keV, close to the observable soft X-ray range. The potential detectablility is enhanced by the slightly larger colour temperature expected in AGN (, D12) together with the higher mass accretion rates () of most NLS1.
While the disc emission is relatively well understood, it is accompanied in both BHB and AGN by coronal emission to much higher energies whose origin is much less clear. AGN spectra also typically show an additional component, termed the soft X-ray excess. This appears as a smoothly rising continuum component over the extrapolated 2-10 keV power law coronal emission below 1 keV. It can be well fit by cool, optically thick, thermal Comptonisation emission in addition to the hot, optically thin Compton emission required to make the 2-10 keV power law. However, the temperature of this cool component remains remarkably constant despite changes in the predicted underlying accretion disc temperature, making this solution appear fine tuned (Czerny et al 2003; Gierlinski & Done 2004).
Another model for the origin of the soft X-ray excess is that it is produced by reflection from partially ionised material. The reduced absorption opacity below the ionised Oxygen edge at keV gives an increased reflectivity at low energies, producing excess emission over the intrinsic power law at these energies (Ross & Fabian 1993; Ross & Fabian 2005). This has the advantage that it produces the soft excess at a fixed energy as observed, though only for a fixed ionisation parameter which equally requires fine tuning (Done & Nayakshin 2007). This ionisation state includes strong line emission from iron L and Oxygen which are not seen as narrow features in the data, so extreme relativistic effects (high black hole spin and centrally focussed emissivity) are required to smear this reflected emission into a smooth continuum (Crummy et al 2006). The shape of the soft X-ray excess can then be used as an independent tracer of black hole spin.
The similarity of extreme relativistic effects required to explain both the iron line and soft X-ray excess continuum is used as an argument that both are indeed formed in this way (Crummy et al 2006). However, this is also currently controversial, with counterexamples where different spins are required to explain the soft excess and iron line profiles (Patrick et al 2011), though this mismatch may also point to multiple reflectors with similar relativisitic effects but different ionisation parameters (e.g. Fabian et al 2004).
However, there is now growing evidence from variability studies that the soft excess represents a true additional component connected to the disc rather than to the high energy power law. A monitoring campaign on Mkn509 (a standard broad line Seyfert 1, hereafter BLS1) shows that the long term variability of the soft excess correlates with that of the UV but not with the hard X-rays (Mehdipour et al 2011). Conversely, on short timescales, the soft excess remains constant while the hard X-rays vary (Noda et al 2011; 2013). Similar lack of soft X-ray variability with strong hard X-ray variability is also seen in the disc dominated NLS1 (RE J1034+396: Middleton et al 2009; RX J0136.9-3510: Jin et al 2009), including this object (PG1244+026: Jin et al 2013, hereafter J13). This all suggests that the soft excess in these objects is again dominated by a true additional component which links to the UV disc rather than to the power law. We note that an alternative, reflection dominated interpretation of the spectrum of RX J1034+396 has both the 0.5-0.7 and 5-10 keV spectra dominated by a single reflection component, so cannot explain the very different amounts of variability seen at these energies (Zoghbi & Fabian 2011; their Fig 6, see discussion in J13).
| ( cm-2) | () | (keV) | |||||
|---|---|---|---|---|---|---|---|
| 1972/1068 |
Nonetheless, the low state spectra of the extreme variability subclass of NLS1 may contain substantially more reflected emission (e.g. Fabian et al 2009). These objects do indeed show a significantly different pattern of X-ray variability (Gierlinski & Done 2006), although there is probably a contribution from an additional component at the softest energies even in these objects (Zoghbi, Uttley & Fabian 2011).
Whatever the origin of the soft X-ray excess, and the higher energy coronal emission, together they can carry a substantial fraction of the accretion power (e.g. the standard quasar template spectra of Elvis et al 1994; Richards et al 2006 and PG1048+213 in D12). If this is powered by the same accretion flow as powers the UV disc emission then energy conservation requires that part of the accretion energy must be dissipated instead in a non-standard disc component. We have developed a model, optxagnf, which incorporates conservation of energy by assuming that the accretion flow thermalisises to a (colour temperature corrected) blackbody at radii larger than but that below this the disc density becomes too low for thermalisation (perhaps because its scale height increases due to a UV line/radiatively driven disc wind or perhaps due to this wind failing to escape and impacting back on the surface of the disc and giving rise to shock heating of the photosphere: e.g streamlines in Risaliti & Elvis 2010). Some fraction, , of the gravitational energy within is emitted as the standard high energy coronal component while the remainder of the energy forms the soft X-ray excess, modelled as a cool, optically thick, thermal Comptonisation component (D12).
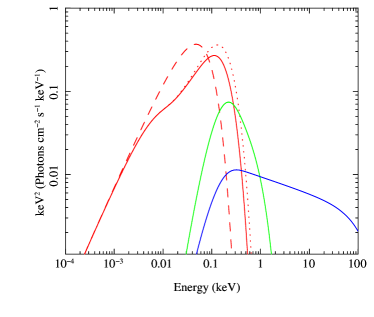
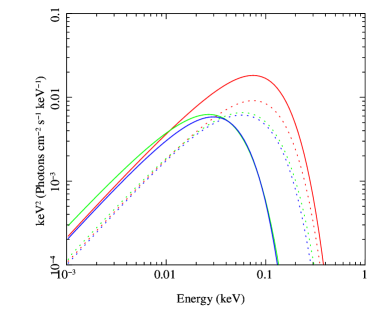
Figure 1a shows typical model spectra for a NLS1 (, ). The red dotted line shows a standard accretion disc spectrum assuming complete thermalisation down to the last stable orbit of a non-spinning black hole, while the dashed line includes the colour temperature correction from electron scattering in the disc photosphere as a function of radius. The red solid line shows the disc spectrum truncated at , with 30% () of the remaining energy dissipated in a hot ( keV), optically thin corona with photon spectral index (blue), with the rest forming the soft X-ray excess from a cool ( keV), optically thick () region (green).
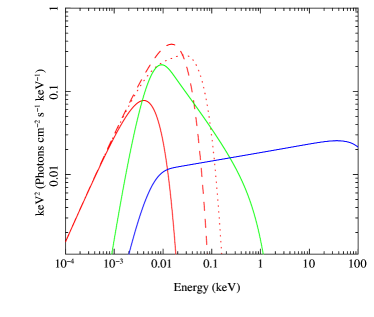
Figure 1b shows the same sequence of spectra for a BLS1 (, ). All other parameters are kept constant except that and . Figs 1a,b span the range of observed spectral energy distributions seen in J12a,b.
3 The spectral energy distribution of PG1244+026
Our new XMM-Newton data were taken on 2011-12-25, and combine X-ray spectral data from the EPIC cameras, together with simultaneous optical and UV photometry from the Optical Monitor (OM). The extraction of these data follows standard procedures, and is described in detail in J13.
The OM data are corrected for emission line contamination using archival optical (SDSS) and UV (HST) spectra, which leads to a reduction in each OM filter band by %. The new photometric data then match reasonably well to the archival SDSS optical continuum points, corrected for emission lines, FeII blends and Balmer continuum components (described in detail in J12a).
We use the optxagnf model described above which is included in xspec (Arnaud 1996) version 12.7.1 and above. We correct for absorption in the X-ray and optical/UV in both our Galaxy and the host galaxy using the (z)wabs and (z)redden models, with E(B-V) in (z)redden fixed to the X-ray column in units of cm-2. We fix the interstellar column through our Galaxy at cm-2, but leave that of the host galaxy as a free parameter.
The optxagnf model requires the mass of the black hole as an input parameter. The archival Sloan Digital Sky Survey (SDSS) optical spectrum clearly shows the classic broad and narrow emission line components (J12a) allowing an initial mass estimate to be derived from standard scaling relations (Kaspi et al 2000). These require the width of the broad component of the H line which we derive after subtracting a narrow component whose profile is matched to the narrow [OIII] 5007Å line profile. The resulting full-width half maximum (FWHM) is 950 km/s, making this one of the most extreme objects in the Narrow Line Seyfert 1 (NLS1) class, particularly at this relatively high luminosity of ergs s-1 (Boroson & Green 1992). Together, the FWHM and values give a black hole mass estimate of (J12a). A conservative uncertainty of dex gives . This mass range means the bolometric luminosity ergs s-1 (estimated in the spectral fits below) is a factor higher than the Eddington luminosity, . Radiation pressure can then have a marked effect on the dynamics of the broad line region. Taking this into account in the scaling relations (Marconi et al 2008) increases the initial mass estimate to .
However, we caution that these corrections for radiation pressure are poorly known, so instead we derive independent constraints on the mass from the X-ray variability properties. We split our 2-10 keV X-ray lightcurve into two 40ks segments, binned on 250s, and find an average the fractional excess variance of per cent (J13). Comparing this to the reverberation mapped sample of Ponti et al (2012) gives a mass range of . We take this as the more robust estimate for the mass range of PG1244+026
 |
 |
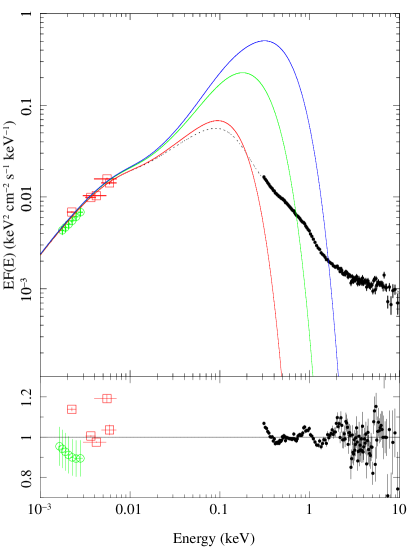
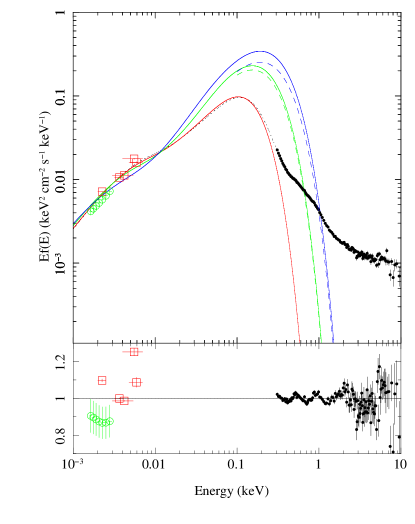
Based on the above, we fix the mass at the upper limit of , which gives the minimum and hence the minimum predicted disc temperature. The fit parameters are detailed in Table 1. Figure 2 (top panel) shows the resulting optxagnf model fit (dotted black line) to the absorption corrected data assuming a black hole spin of . The red line shows the model assuming all the energy thermalises in the disc. This is very similar to the model fit to the data apart from in the soft and hard X-ray regimes, showing that the energy dissipated in these components is only a small fraction of the total inferred bolometric flux. Increasing the spin to (green) and (blue) increases the disc temperature sufficiently to strongly overpredict the observed soft X-ray flux. The fit residuals (bottom panel) are dominated by the XMM-Newton OM points, specifically the V and UVM2 wavelength filters. These discrepancies could be due to residual aperture/emission line effects despite our efforts to correct for them (see also J13). Removing these points does not significantly affect the fit, so we include them as these are truely simultaneous (unlike SDSS).
The optxagnf model does not include relativisitic effects, nor inclination corrections (it assumes an inclination of ), nor does it account for advection. We include these factors below.
4 A relativistic AGN continuum model: optxconv
We extend the optxagnf model to incorporate an inclination dependence and relativistic effects. Inclination affects the observed disc emission due to the angular dependence of the radiation. Full radiative transfer photosphere models (e.g. those used by Davis & Laor 2011) show that the optical emission is fairly isotropic for inclination angles , so we normalise our model by to account for this.
Inclination also affects the observed appearance of the disc through relativistic effects. In principle we could convolve the colour temperature corrected blackbody spectrum at each radius with the appropriate relativistic smearing kernel at that radius, and integrate over the whole disc. However, this is very inefficient in terms of computational time. Instead, we use the fact that most of the disc emission arises from radii less than twice that of the innermost radius, so smear the entire disc spectrum with the relativistic kernel for the appropriate spin and inclination (kerrconv: Brenneman & Reynolds 2006), with emissivity fixed at 3 and with inner and outer radii fixed at and , respectively. The energy released below is assumed to have a constant spectrum as a function of radius, so we convolve the soft excess and high energy tail by the relativistic kernel with inner and outer radius fixed at and , respectively. Thus the entire model can be built using only two convolutions.
| source | D | M | i | kerrbb spin | bhspec spin | optxconv spin | optxconv | ObsID |
|---|---|---|---|---|---|---|---|---|
| LMC X-3 | 52 | 7 | 67 | 20188-02-11-00 | ||||
| GRO J1655-40 | 3.2 | 7 | 70 | 10255-01-23-00 | ||||
| XTE J1550-564 | 5.3 | 10 | 72 | 30435-01-12-00 |
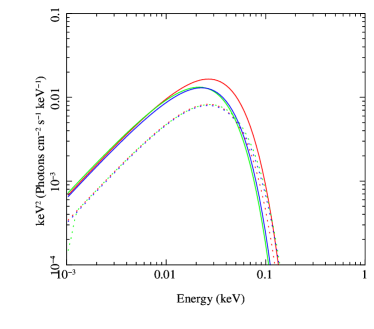
Figures 3a,b show that this is a good approximation by comparing the results of our code, modified using the approximate smearing functions (green line) with disc models which incorporate the full relativistic kernel (blue line: kerrbb: Li et al 2005). We fix both models to and use isotropic emission so they are directly comparable. The red line shows the extent of the relativistic effects by comparing to our model without the relativistic smearing. We show a sequence of models for inclination of (solid lines) and (dotted lines) for spin (left panel) and (right panel). It is clear that the relativisitic effects make most difference for high spin and low inclination (red line most different from green and blue), and that the pure disc results are recovered by our model for the entire range of inclination and spin considered here i.e. good match of green and blue lines in all cases.
4.1 Fitting to black hole binaries
The optxconv model then will reproduce all the well known results from kerrbb fits to black hole binaries (BHB) as Fig 3 shows it reproduces the shape of kerrbb, and its analytic expression for is that of Davis et al (2006) i.e. gives for typical BHB mass and mass accretion rates, as used in all kerrbb fits. However, we show this explicitally by picking three black holes with solid spin estimates from disc continuum fitting, namely GRO J1655-40, XTE J1550-564 and LMC X-3. These were all considered in Davis et al (2006), but there have also been multiple other studies of spin from their disk dominated spectra (e.g. GRO J1655-40: Shafee et al 2006; XTE J1550-546: Steiner et al 2011; LMC X-3: Steiner et al 2010). These previous spin results are shown in Table 2. We pick specific RXTE ObsID’s from the disc dominated states of Davis et al (2006) which lie on the constant radius part of the luminosity-temperature plot. The spin results from optxconv are given in Table 2 and are all consistent with those from Davis et al (2006) for the same assumed parameters (distance, black hole mass and inclination). We note that these are not always consistent with the iron line spins, nor with the spins derived from disc continuum fitting in data which are not dominated by the disc (as required for an iron line profile) e.g. Miller et al (2009) derive from both disc and iron line in a non-disc dominated spectrum of GRO J1655-40. Non-disc dominated spectra do not show a robust luminosity-temperature relation so cannot be used for reliable disc continuum fitting (Kubota & Done 2004). Using the iron line alone gives a black hole spin which is higher than the disc continuum fits (see introduction in Kolehmainen & Done 2010). The line can easily give lower spin than the disc dominated continuum fits if the disc does not extend down to the ISCO in the states where the line is prominant. However, significantly higher spin from the iron line means that one (or both) of the disc (more likely the system parameters of mass, inclination and distance) or iron line models is wrong.
Interestingly, both GRO J1655-40 and XTEJ1550-564 show significant pairs of high frequency QPO’s at 300/450 Hz, and 180/280 Hz respectively (Belloni, Sanna, & Mendez 2012). Assuming that the highest frequency of the pair represents the Keplarian frequency at the last stable orbit gives a lower limit on spin of (GRO J1655-40) and (XTE J1550-564) using the mass estimates of Table 2, but these are not very constraining.
4.2 Fitting optxconv to PG1244+026
The red solid line in Figure 4 shows the new model fit to the data from PG1244+026. We assume an inclination of as an obscuring torus probably removes all type I AGN from , and fix the black hole spin at . This gives a best fit black hole mass of , and (see Table 3). Similarly to Figure 2, we show the pure disc spectrum as a dotted red line, and a sequence of pure disc models with (green) and (blue). Again, the high spin solutions strongly overpredict the observed soft X-ray flux.
However, the enhanced soft X-ray emission that derives from the disc extending down further into the gravitational potential means that two high spin models give and , respectively. Advection can become important at these high luminosities, with some fraction of the radiation being carried along with the flow rather than being radiated (Abramowicz et al 1988), suppressing the disc emission from the innermost radii. The best model calculations of this effect (including the vertical as well as radial structure of the disc) show the total disc emission is not affected below (Straub et al 2013), but reduces to and for and (Sadowski 2011, their Figure 4.11). The green and blue dashed lines in Figure 4 show the effect of this on the predicted inner disc emission. Plainly this is insufficient to reduce the soft X-ray flux for the high spin models to a level compatible with the observations, ruling out a high spin scenario for this mass and inclination.
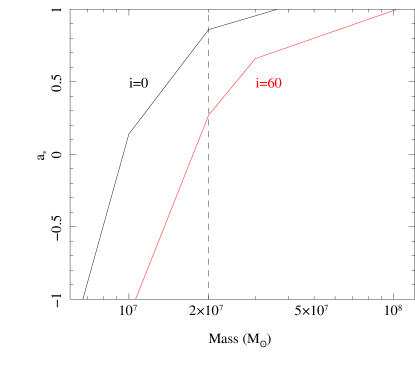
The correlated parameters are mass, spin, inclination and . We explore this parameter space by fixing inclination at and , and trace out the best fit mass for all spins from to (see Fig 5). The corresponding increases systematically with decreasing mass and spin, with maximum of for and for , so none none of the best fit solutions are strongly superEddington. However, at maximal spin, is much lower, at and respectively for (mass ) and (mass of ), respectively. This is within the range of normal Quasar (Boroson 2002), yet the spectral energy distribution is very different to that of the standard quasar template spectrum (e.g. Elvis et al 1994). In our opinion this makes these higher mass/spin solutions less plausible. We note that our maximum mass of requires spin even at .
| ( cm-2) | () | (keV) | ||||||
|---|---|---|---|---|---|---|---|---|
| 1640/1067 |
5 Comparison with reflection spin estimators for PG1244+026
There is an iron line in the X-ray data, but there is not sufficient signal-to-noise in the 3-10 keV bandpass to use this to tightly constrain the black hole spin (see J13 for details). Hence we cannot currently compare the two techniques in this object.
However, reflection may also form the soft X-ray excess. This is an alternative model to the one used here where we assumed that the soft excess was a true additional component. Fitting the entire X-ray spectrum of PG1244+026 with ionised reflection models strongly requires high spin (Crummy et al 2006; J13), in conflict with the disc continuum fits above. However, the lack of correlated variability of the soft X-ray excess with that of the hard power law argues against a reflection origin for the majority of the soft X-ray excess in this object (J13), so the black hole spin estimate from reflection fits to the soft X-ray excess are probably not valid in this object.
6 Discussion
This is the first demonstration that black hole spin in a NLS1 can be constrained from disc continuum fitting. The only previous application of this technique in AGN was for a very high mass black hole accreting at moderate rate () where the disc peak is resolved in the observable optical/UV due to the high source redshift of (Czerny et al 2011). Instead, our study uses the lack of an observed peak in the soft X-ray range to constrain spin in a local, much lower mass black hole, higher mass accretion rate AGN. These NLS1 are an important class of AGN as these are typically the systems where extreme relativistic effects requiring high spin and gravitational lightbending are claimed from the shape of the reflected iron line emission during low flux episodes, where the spectra appear reflection dominated. These are interpreted in the lightbending model as due to the continuum source dropping in height so that strong lightbending both suppresses the intrinsic power law emitted towards the observer, and enhances the illumination of the very innermost parts of the disc, leading to a strongly centrally peaked emissivity (Fabian et al 2004; Miniutti & Fabian 2004). The higher flux spectra from these objects are much less reflection dominated and their reflection emissivity is less centrally concentrated, consistent with a larger source height where lightbending is less effective.
Our low spin result for PG1244+026 is in sharp contrast with the high (almost maximal) spin required to fit the low flux episodes of the NLS1 1H0707-495 (Fabian et al 2004; 2009). While these are different objects, they have similar mass and mass accretion rates, and the X-ray spectrum of 1H0707-495 in its high flux episodes is remarkably similar to that of PG1244+026. Cosmological simulations of the co-evolution of black holes in AGN and their host galaxies predict that low mass black holes should all have similar spins as they are built from the same process (gas accretion rather than merging black holes). These should all have high spin if the accretion angular momentum direction is prolonged, or all low if the accretion is chaotic (e.g. Fanidakis et al 2011). Hence our result implies that either our disc continuum spin estimate is wrong, or the reflection dominated interpretation of the low flux state spectra are wrong, or that our understanding of the cosmological evolution of black hole spin is wrong. We discuss each of these possibilities in turn below.
The disc continuum fit could underestimate spin if the mass were significantly underestimated. This does not seem likely given the very narrow line widths in this object and its rapid X-ray variability (see Section 3). Alternatively, advection could become much more important if the black hole mass were instead towards the lower limit of the probable range. While a very super-Eddington mass accretion rate would not be an issue for a single object, we note that the high sample of J12a,b all have similar X-ray spectra and masses, so probably will all have similarly low spin constraints. With the current models these AGN all have , following smoothly on from the other two subsamples which have and (J12a,b, D12). If instead all these objects were super-Eddington there would be a deficit of systems with mass accretion rate around . The only other possibility is that the disc models themselves are wrong, despite being solidly tested in the BHB systems. The most significant difference made by increasing the mass is that the disc temperature decreases. This means that the disc can power a UV line driven wind (Proga et al 2000; Risaliti & Elvis 2010) and mass loss in this wind could be substantial enough to change the disc structure (Laor & Davis 2013).
Alternatively, the high spin derived from X-ray reflection models for the X-ray low states of NLS1 such as 1H0707-495 could be overestimated. This can be the case if most of the soft X-ray excess is a true additional continuum but is erroneously fit with reflection models. The strong relativistic effects required to smear the predicted soft X-ray line emission into the observed continuum then drive the fit, as the statistics at low energies are much better than at the iron line e.g. most of the objects in Crummy et al (2006) require high spin at high significance. However, the low flux spectra which most strongly require high spin are often fit with two reflectors, one for the soft X-ray excess, and another for the iron line but the iron line alone strongly requires high spin in 1H0707-495 (Fabian et al 2009). Instead, the curvature around the iron line could be due to absorption rather than to relativisitic effects (Turner et al 2007; Miller et al 2007). This appears to require a fine-tuning of the geometry (Zoghbi et al 2011) but these extreme line profiles are only seen in a subset of NLS1, those where the flux drops dramatically (Gallo 2006) which may select objects where the line of sight is directly down the wind. Alternatively, the reflection spectrum could itself be distorted if the disc photosphere is strongly turbulent and/or dominated by Compton scattering, as predicted for the inner regions of the disc in the failed wind/hitchhiking gas model of Risaliti & Elvis (2010).
Finally, the cosmological spin evolution could be wrong. This seems almost certain as the models only include spin up/down from accretion and black hole mergers, yet these objects also can power jets at some stages of their active lifetimes. The jet may remove angular momentum from the black hole if it is powered by the Blandford-Znajek process though this is also still controversial as the jet could also be powered simply by accretion e.g. Russell, Gallo & Fender (2013).
7 Conclusions
This paper demonstrates that disc continuum fitting can constrain black hole spin in AGN, though there are still systematic uncertainties from black hole mass determinations which require reverberation mapping to substantially reduce. Applying the continuum fitting technique to a sample of disc dominated AGN to derive the spin distribution will give new insight into current controversies which beset the interpretation of X-ray spectra. More fundamentally, measuring black hole spin reliably would give a test of the origin of jet power, and shed new light on the nature of the accretion powered growth of super-massive black holes across cosmic time.
Acknowledgements
CD acknowledges a conversation with Ric Davies at MPE where in describing the need for new data to use the disc continuum fitting technique in AGN, it became clear that this was already feasible.
References
- [Abramowicz et al.(1988)] Abramowicz, M. A., Czerny, B., Lasota, J. P., & Szuszkiewicz, E. 1988, ApJ, 332, 646
- [\citeauthoryearArnaud1996] Arnaud K. A., 1996, ASPC, 101, 17
- [Begelman et al.(1984)] Begelman, M. C., Blandford, R. D., & Rees, M. J. 1984, Reviews of Modern Physics, 56, 255
- [Belloni et al.(2012)] Belloni, T. M., Sanna, A., & Mendez, M. 2012, MNRAS, 426, 1701
- [Boroson & Green(1992)] Boroson, T. A., & Green, R. F. 1992, ApJS, 80, 109
- [Boroson(2002)] Boroson, T. A. 2002, ApJ , 565, 78
- [Bower et al.(2006)] Bower, R. G., Benson, A. J., Malbon, R., et al. 2006, MNRAS, 370, 645
- [Brenneman & Reynolds(2006)] Brenneman, L. W., & Reynolds, C. S. 2006, ApJ , 652, 1028
- [Brenneman & Reynolds(2009)] Brenneman, L. W., & Reynolds, C. S. 2009, ApJ , 702, 1367
- [Centrella et al.(2010)] Centrella, J., Baker, J. G., Kelly, B. J., & van Meter, J. R. 2010, Reviews of Modern Physics, 82, 3069
- [Chiang & Fabian(2011)] Chiang, C.-Y., & Fabian, A. C. 2011, MNRAS, 414, 2345
- [\citeauthoryearCrummy et al.2006] Crummy J., Fabian A. C., Gallo L., Ross R. R., 2006, MNRAS, 365, 1067
- [\citeauthoryearCzerny & Elvis1987] Czerny B., Elvis M., 1987, ApJ, 321, 305
- [\citeauthoryearCzerny et al.2003] Czerny B., Nikołajuk M., Różańska A., Dumont A.-M., Loska Z., Zycki P. T., 2003, A&A, 412, 317
- [\citeauthoryearDavis & Laor2011] Davis S. W., Laor A., 2011, ApJ, 728, 98
- [\citeauthoryearDavis, Done, & Blaes2006] Davis S. W., Done C., Blaes O. M., 2006, ApJ, 647, 525
- [de La Calle Pérez et al.(2010)] de La Calle Pérez, I., Longinotti, A. L., Guainazzi, M., et al. 2010, A& A, 524, A50
- [Done & Nayakshin(2007)] Done, C., & Nayakshin, S. 2007, MNRAS, 377, L59
- [Done et al.(2012)] Done, C., Davis, S. W., Jin, C., Blaes, O., & Ward, M. 2012, MNRAS, 420, 1848
- [Ebisawa et al.(1991)] Ebisawa, K., Mitsuda, K., & Hanawa, T. 1991, ApJ , 367, 213
- [Ebisawa et al.(1993)] Ebisawa, K., Makino, F., Mitsuda, K., et al. 1993, ApJ , 403, 684
- [\citeauthoryearElvis et al.1994] Elvis M., Wilkes B. J., McDowell J. C., Green R. F., Bechtold J., Willner S. P., Oey M. S., Polomski E., Cutri R., 1994, ApJS, 95, 1
- [Fabian et al.(1989)] Fabian, A. C., Rees, M. J., Stella, L., & White, N. E. 1989, MNRAS, 238, 729
- [Fabian et al.(2000)] Fabian, A. C., Iwasawa, K., Reynolds, C. S., & Young, A. J. 2000, PASP, 112, 1145
- [Fabian et al.(2002)] Fabian, A. C., Vaughan, S., Nandra, K., et al. 2002, MNRAS, 335, L1
- [Fabian et al.(2004)] Fabian, A. C., Miniutti, G., Gallo, L., et al. 2004, MNRAS, 353, 1071
- [Fabian et al.(2009)] Fabian, A. C., Zoghbi, A., Ross, R. R., et al. 2009, Nature, 459, 540
- [Fanidakis et al.(2011)] Fanidakis, N., Baugh, C. M., Benson, A. J., et al. 2011, MNRAS, 410, 53
- [Gallo(2006)] Gallo, L. C. 2006, MNRAS, 368, 479
- [\citeauthoryearGierliński & Done2004] Gierliński M., Done C., 2004, MNRAS, 349, L7
- [Gierliński & Done(2006)] Gierliński, M., & Done, C. 2006, MNRAS, 371, L16
- [\citeauthoryearHubeny et al.2001] Hubeny I., Blaes O., Krolik J. H., Agol E., 2001, ApJ, 559, 680
- [\citeauthoryearJin et al.2009] Jin C., Done C., Ward M., Gierliński M., Mullaney J., 2009, MNRAS, 398, L16
- [Jin et al.(2012)] Jin, C., Ward, M., Done, C., & Gelbord, J. 2012, MNRAS, 420, 1825 (J12a)
- [Jin et al.(2012)] Jin, C., Ward, M., & Done, C. 2012, MNRAS, 425, 907 (J12b)
- [Jin et al.(2013)] Jin, C., Done, C., Middleton, M.J., Ward, M., MNRAS, submitted (J13)
- [\citeauthoryearKaspi et al.2000] Kaspi S., Smith P. S., Netzer H., Maoz D., Jannuzi B. T., Giveon U., 2000, ApJ, 533, 631
- [King et al.(2008)] King, A. R., Pringle, J. E., & Hofmann, J. A. 2008, MNRAS, 385, 1621
- [Kolehmainen & Done(2010)] Kolehmainen, M., & Done, C. 2010, MNRAS, 406, 2206
- [Kolehmainen & Done (2013)] Kolehmainen, M. J., Done, C., 2013, MNRAS, submitted
- [Kubota et al.(2001)] Kubota, A., Makishima, K., & Ebisawa, K. 2001, ApJL, 560, L147
- [\citeauthoryearKubota & Done2004] Kubota A., Done C., 2004, MNRAS, 353, 980
- [Laor & Davis(2013)] Laor, A., & Davis, S. W. 2013, MNRAS, submitted
- [Legg et al.(2012)] Legg, E., Miller, L., Turner, T. J., et al. 2012, ApJ , 760, 73
- [Li et al.(2005)] Li, L.-X., Zimmerman, E. R., Narayan, R., & McClintock, J. E. 2005, ApJS, 157, 335
- [Malkan(1983)] Malkan, M. A. 1983, ApJ , 268, 582
- [Marconi et al.(2008)] Marconi, A., Axon, D. J., Maiolino, R., et al. 2008, ApJ , 678, 693
- [Mehdipour et al.(2011)] Mehdipour, M., Branduardi-Raymont, G., Kaastra, J. S., et al. 2011, A& A, 534, A39
- [\citeauthoryearMiddleton et al.2009] Middleton M., Done C., Ward M., Gierliński M., Schurch N., 2009, MNRAS, 394, 250
- [Miller et al.(2009)] Miller, J. M., Reynolds, C. S., Fabian, A. C., Miniutti, G., & Gallo, L. C. 2009, ApJ , 697, 900
- [\citeauthoryearMiller, Turner & Reeves2009] Miller L., Turner T. J., Reeves J. N., 2009, MNRAS, 399, L69
- [\citeauthoryearMiller et al.2007] Miller L., Turner T. J., Reeves J. N., George I. M., Kraemer S. B., Wingert B., 2007, A&A, 463, 131
- [Miller & Turner(2013)] Miller, L., & Turner, T. J. 2013, arXiv:1303.4309
- [Miniutti & Fabian(2004)] Miniutti, G., & Fabian, A. C. 2004, MNRAS, 349, 1435
- [Miniutti et al.(2007)] Miniutti, G., Fabian, A. C., Anabuki, N., et al. 2007, PASJ, 59, 315
- [Nandra et al.(2007)] Nandra, K., O’Neill, P. M., George, I. M., & Reeves, J. N. 2007, MNRAS, 382, 194
- [Noda et al.(2011)] Noda, H., Makishima, K., Yamada, S., et al. 2011, PASJ, 63, 925
- [Noda et al.(2013)] Noda, H., Makishima, K., Nakazawa, K., et al. 2013, PASJ, 65, 4
- [Patrick et al.(2011)] Patrick, A. R., Reeves, J. N., Lobban, A. P., Porquet, D., & Markowitz, A. G. 2011, MNRAS, 416, 2725
- [Ponti et al.(2012)] Ponti, G., Papadakis, I., Bianchi, S., et al. 2012, A& A, 542, A83
- [\citeauthoryearProga, Stone & Kallman2000] Proga D., Stone J. M., Kallman T. R., 2000, ApJ, 543, 686
- [Richards et al.(2006)] Richards, G. T., Lacy, M., Storrie-Lombardi, L. J., et al. 2006, ApJS, 166, 470
- [Risaliti & Elvis(2010)] Risaliti, G., & Elvis, M. 2010, A& A, 516, A89
- [Risaliti et al.(2013)] Risaliti, G., Harrison, F. A., Madsen, K. K., et al. 2013, Nature, 494, 449
- [Ross & Fabian(2005)] Ross, R. R., & Fabian, A. C. 2005, MNRAS, 358, 211
- [Ross & Fabian(1993)] Ross, R. R., & Fabian, A. C. 1993, MNRAS, 261, 74
- [Russell et al.(2013)] Russell, D. M., Gallo, E., & Fender, R. P. 2013, MNRAS, 864
- [Sadowski(2011)] Sadowski, A. 2011, arXiv:1108.0396 (PhD thesis)
- [Shafee et al.(2006)] Shafee, R., McClintock, J. E., Narayan, R., et al. 2006, ApJL, 636, L113
- [\citeauthoryearShakura & Sunyaev1973] Shakura N. I., Sunyaev R. A., 1973, A&A, 24, 337
- [\citeauthoryearShimura & Takahara1995] Shimura T., Takahara F., 1995, ApJ, 445, 780
- [\citeauthoryearSim et al.2010] Sim S. A., Miller L., Long K. S., Turner T. J., Reeves J. N., 2010, MNRAS, 404, 1369
- [Steiner et al.(2010)] Steiner, J. F., McClintock, J. E., Remillard, R. A., et al. 2010, ApJL, 718, L117
- [Steiner et al.(2011)] Steiner, J. F., Reis, R. C., McClintock, J. E., et al. 2011, MNRAS, 416, 941
- [Straub et al.(2012)] Straub, O., Done, C., & Middleton, M. J. 2012, arXiv:1208.0160
- [Tatum et al.(2012)] Tatum, M. M., Turner, T. J., Sim, S. A., et al. 2012, ApJ , 752, 94
- [Terashima et al.(2012)] Terashima, Y., Kamizasa, N., Awaki, H., Kubota, A., & Ueda, Y. 2012, ApJ , 752, 154
- [\citeauthoryearTurner et al.2007] Turner T. J., Miller L., Reeves J. N., Kraemer S. B., 2007, A&A, 475, 121
- [Volonteri et al.(2005)] Volonteri, M., Madau, P., Quataert, E., & Rees, M. J. 2005, ApJ , 620, 69
- [Wilkins & Fabian(2013)] Wilkins, D. R., & Fabian, A. C. 2013, MNRAS, 430, 247
- [Wilms et al.(2001)] Wilms, J., Reynolds, C. S., Begelman, M. C., et al. 2001, MNRAS, 328, L27
- [Zoghbi et al.(2010)] Zoghbi, A., Fabian, A. C., Uttley, P., et al. 2010, MNRAS, 401, 2419
- [Zoghbi et al.(2011)] Zoghbi, A., Uttley, P., & Fabian, A. C. 2011, MNRAS, 412, 59
- [Zoghbi & Fabian(2011)] Zoghbi, A., & Fabian, A. C. 2011, MNRAS, 418, 2642